Executive Summary
Japanese profits have benefited from the prolonged deleveraging of Japan Inc. The reduction in debt coupled with exceptionally low interest rates has allowed cash flow to impact the bottom line. This has been the major engine of the increase in Japanese profitability that we have witnessed, not some Damascene conversion of Japan Inc. to the cult of shareholder value maximisation (SVM). The Japanese equity market has continued to de-rate despite the improved fundamentals, which creates a potentially very interesting opportunity for investors.
In my last two missives – The Curious Incident of the Elevated Profit Margins and Slow Burn Minsky Moments (and what to do about them) – I touched upon Japan, amongst other countries. In this note I wish to take a deeper dive into Japan and the potential it may offer the value investor today.
Understanding Profits
Much like in the case of the U.S., which I detailed recently, Japan has experienced an extended period of above “normal” profitability. However, in Japan’s case, we have witnessed a move from a historically exceptionally low return on sales to something more like an internationally normal return on sales. As Exhibit 1 illustrates, from 1960 to around 2012 the average return on sales was just under 3%, while post 2012 this has risen to an average of nearly 5.5%.
Exhibit 1: Japanese Profits (% of Sales)
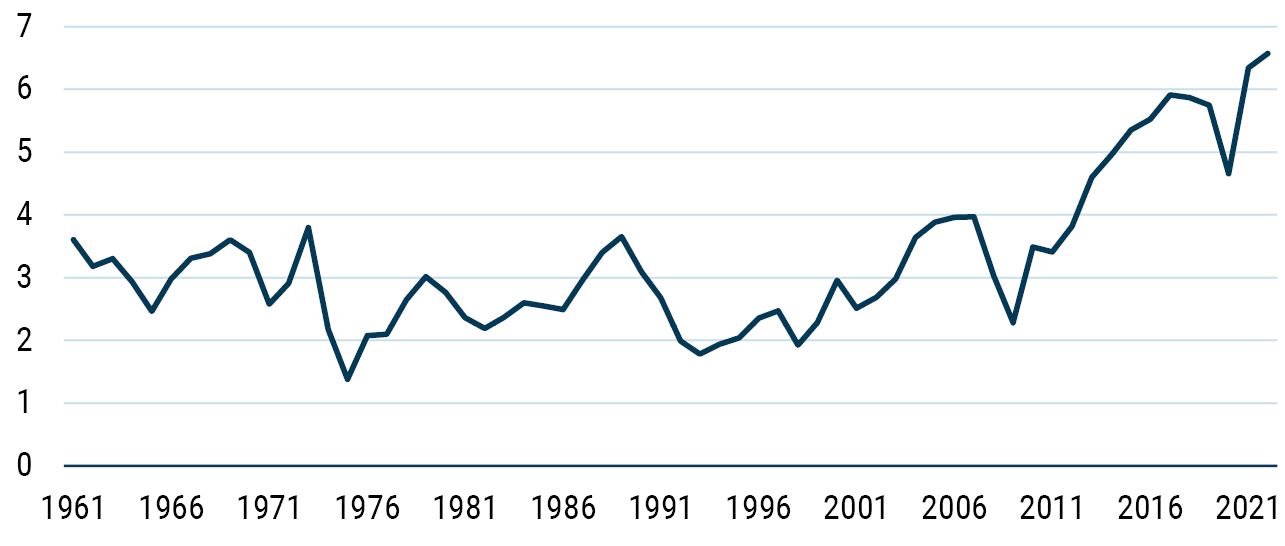
As of September 2023 | Source: Japan Ministry of Finance
So, what is behind this notable shift in corporate profitability? One of the oft heard refrains is that Japan has undergone a Damascene conversion and suddenly “got the religion” of shareholder value maximisation (SVM). Given my published view of SVM as The World’s Dumbest Idea, you might colour me skeptical of this particular explanation.
The Beautiful Blade of Occam’s Razor
Thankfully I don’t have to resort to using the mantra of SVM to explain what has been going on. Whilst I am sure that some companies have indeed become more shareholder-aware, I think there is an altogether simpler explanation for what we have seen in Japan.
The key is to understand the difference between the two series in Exhibit 2. Here I show the same profits series as in Exhibit 1 (ordinary profits), but this time I contrast them with operating profits. Now, unlike some countries, Japan actually has a reasonably strict definition of operating profits (which means these aren’t the pro forma, make-believe estimates of analysts, as in the U.S. case).
With even just a cursory glance at the chart, we reach some distinctly different conclusions looking at operating profits compared to ordinary profits. The most obvious takeaway is that operating profits aren’t at historical highs – they were at higher levels in the 1960-70s. Yes, operating profits are significantly higher than they were during the 1990s, but the improvement is nowhere near as historically extreme as the recent increase in ordinary profits.
Exhibit 2: Operating versus Ordinary Profits (% of Sales)
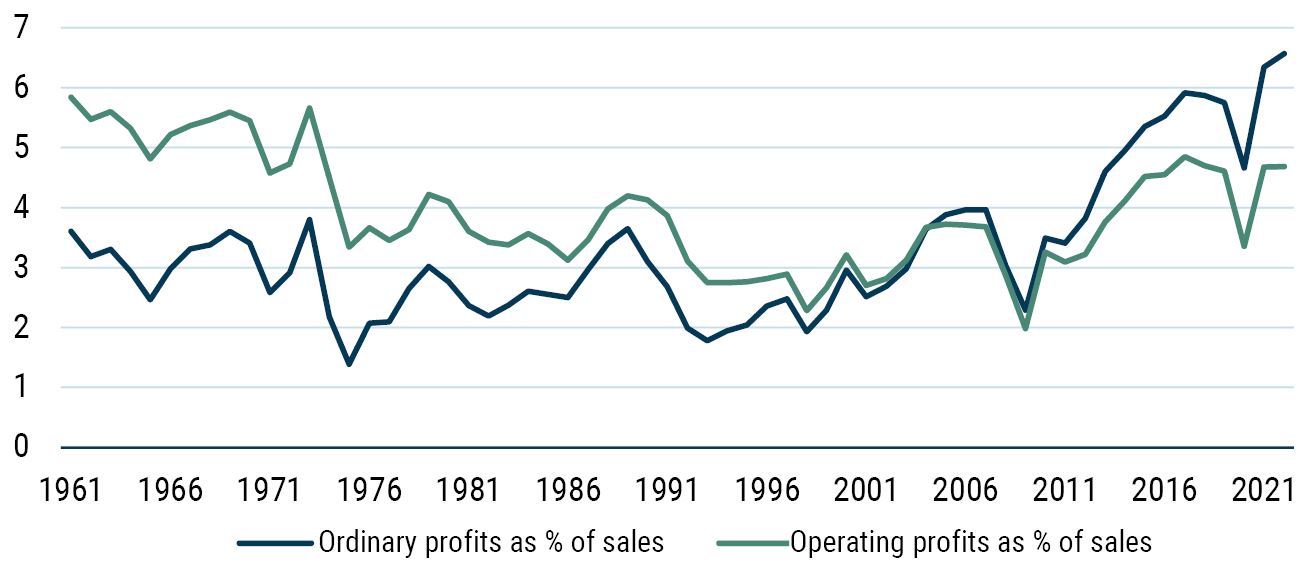
As of September 2023 | Source: Japan Ministry of Finance
By now you are probably screaming (if you don’t already know): What the hell is the difference between ordinary and operating profits in Japan? The key difference between the two series is interest expense (shown in Exhibit 3 and Table 1). As stated above, operating profits (as a percent of sales) are only fractionally higher in the more recent sample, but ordinary profits are considerably higher. This has been due to a very large decline in the interest expense paid out by corporates.
Exhibit 3: Differences between Operating and Ordinary Profits
(% of Sales)
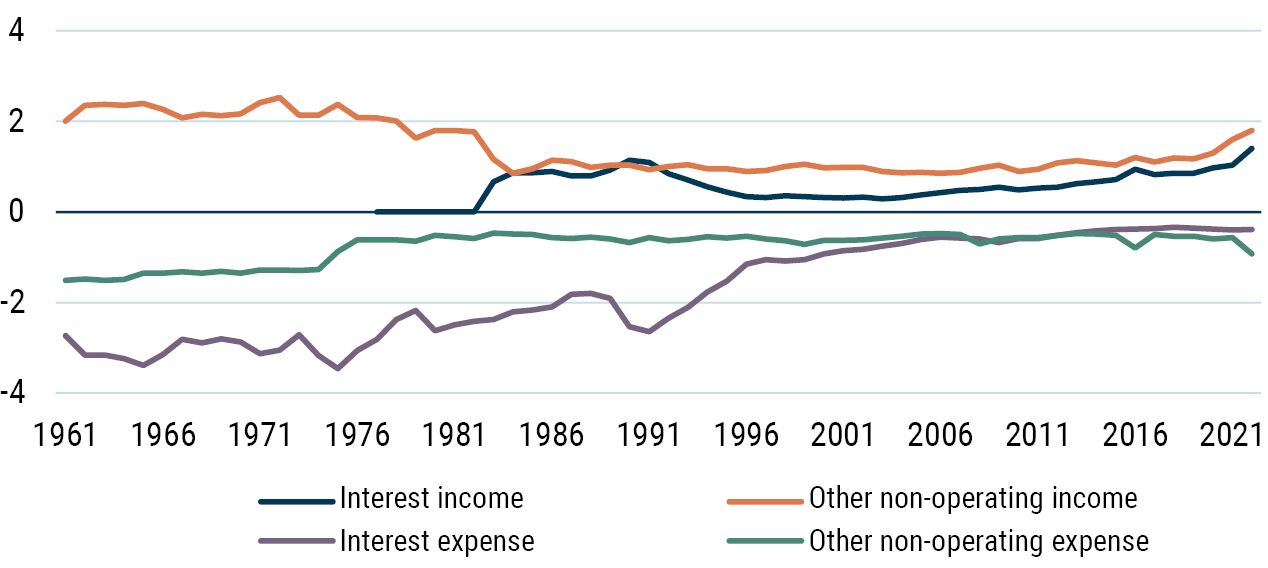
As of September 2023 | Source: Japan Ministry of Finance
Table 1: Differences between Operating and Ordinary Profits
(% of sales)
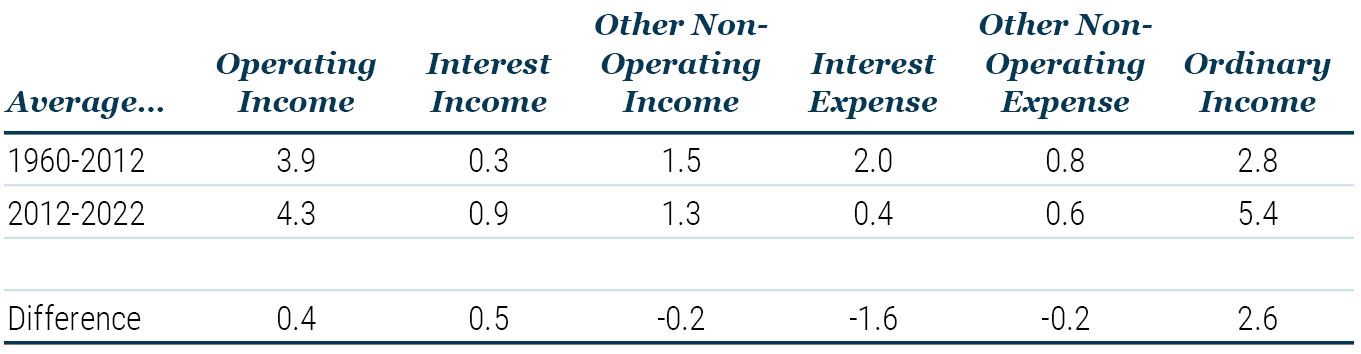
As of September 2023 | Source: Japan Ministry of Finance
So, from this perspective, we don’t need to fall back on stories of the rise of SVM to explain what we have witnessed in Japan – operating profits are only 0.4% higher in the last ten years compared to the prior long-term history. A far simpler explanation is that Japan Inc. has been deleveraging over a long period of time, and this, coupled with very low interest rates, has led to much lower interest expenses, which in turn allow operating profits to flow through into ordinary profits (accounting for over 60% of the increase in profits compared to the long-run history).
The Top-Down View
As my regular readers will know, when analysing profits, I often reach for the Kalecki equation to help understand macro drivers. 1 This equation breaks down profits into the positives of net investment and dividends, subtracting the drags of household savings, government savings, and foreign savings (readers are referred to my previous notes for more detailed explanation).
Exhibit 4 and Table 2 show the Kalecki equation for Japan (note, we have switched from using profits over sales to profits over GDP, although it is the same profits series).
Exhibit 4: Kalecki Equation for Japan (% of GDP)
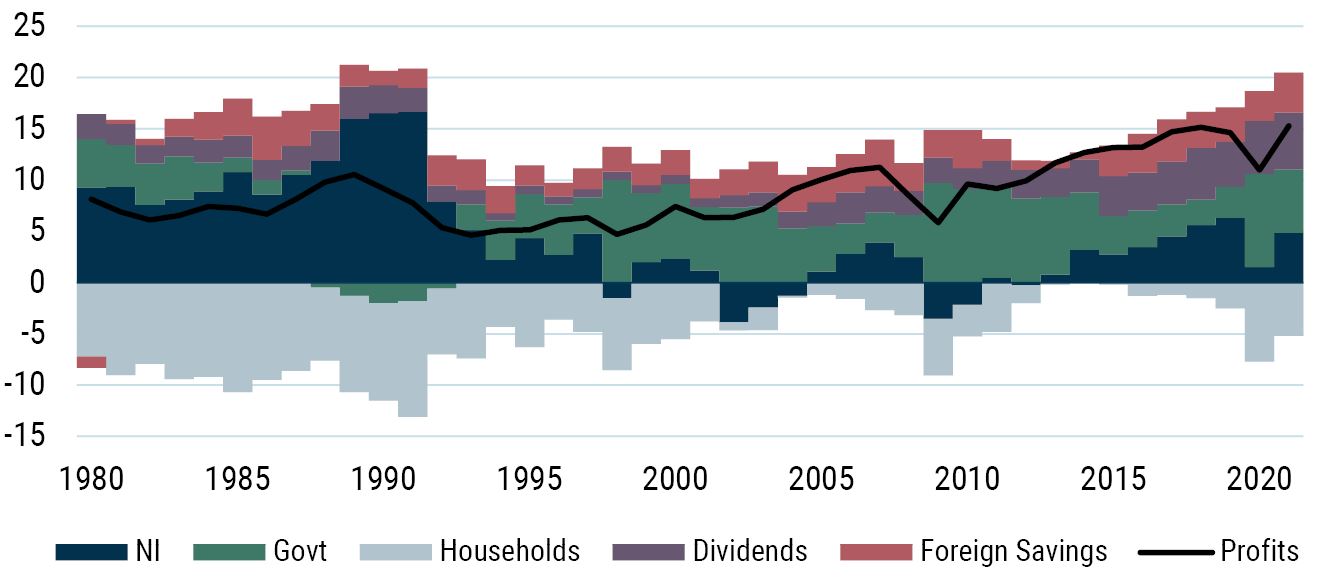
As of September 2023 | Source: Japan Cabinet Office
Table 2: Kalecki Breakdown for Japan (% of GDP)
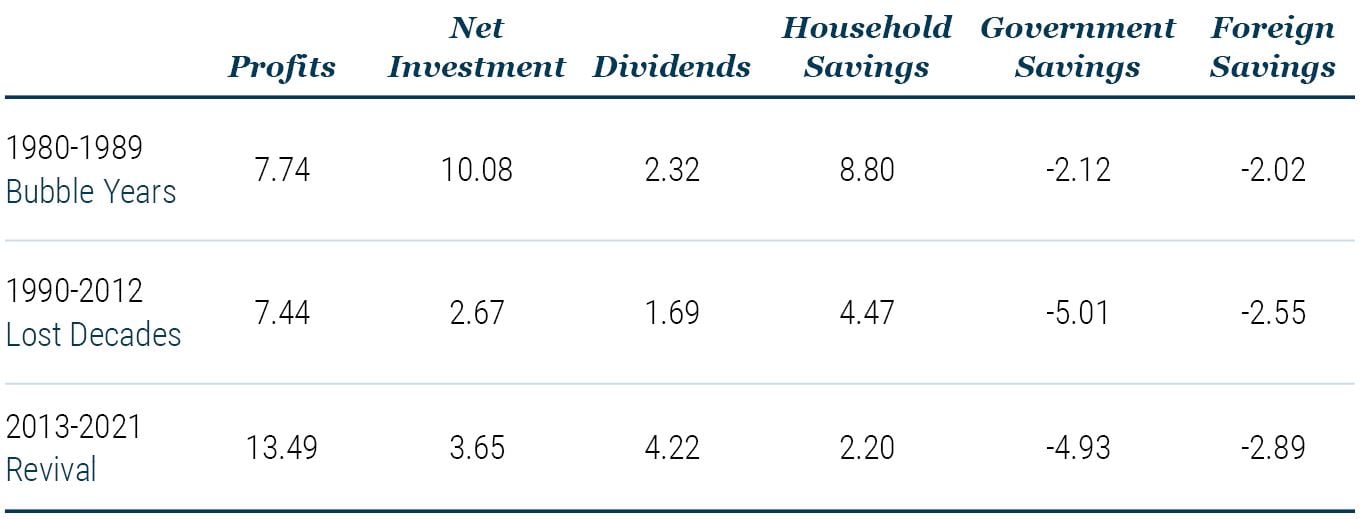
As of September 2023 | Source: Japan Cabinet Office
I find Table 2 to be particularly useful in framing the shifting drivers of profits over three distinct periods that Japan has endured. The first period is the bubble years (baburu keizai). This period was dominated by a massive net investment boom and very high household savings.
After the bursting of the bubble, we witnessed the lost decades (ushinawareta junen). Interestingly, profits (as a percent of GDP) were not vastly different between the bubble years and the lost decades. However, the drivers of the profits were. Net investment collapsed, as is to be expected in the wake of such a massive investment boom, with household savings falling sharply and the government deficit more than doubling to fill the void left by the investment bust.
The third episode is the most recent decade. Here we see a near doubling of profits (ordinary, as defined above, as a percent of GDP). The key drivers of this increase (compared to the lost decades) were a rise in dividends and a further decline in household savings (each accounting for roughly 40% of the difference in profits performance).
The decline in household savings is perfectly consistent with the argument used previously (that deleveraging has reduced the interest expense for Japanese corporates). Recall that interest expenses are paid to someone – ultimately a household as a form of income. Hence, given a fall in income (due to lower interest expenses paid by firms), to keep consumption levels unchanged, a fall in household savings would be required. So once again we see the very clear impact of the role of deleveraging in improving Japanese profitability.
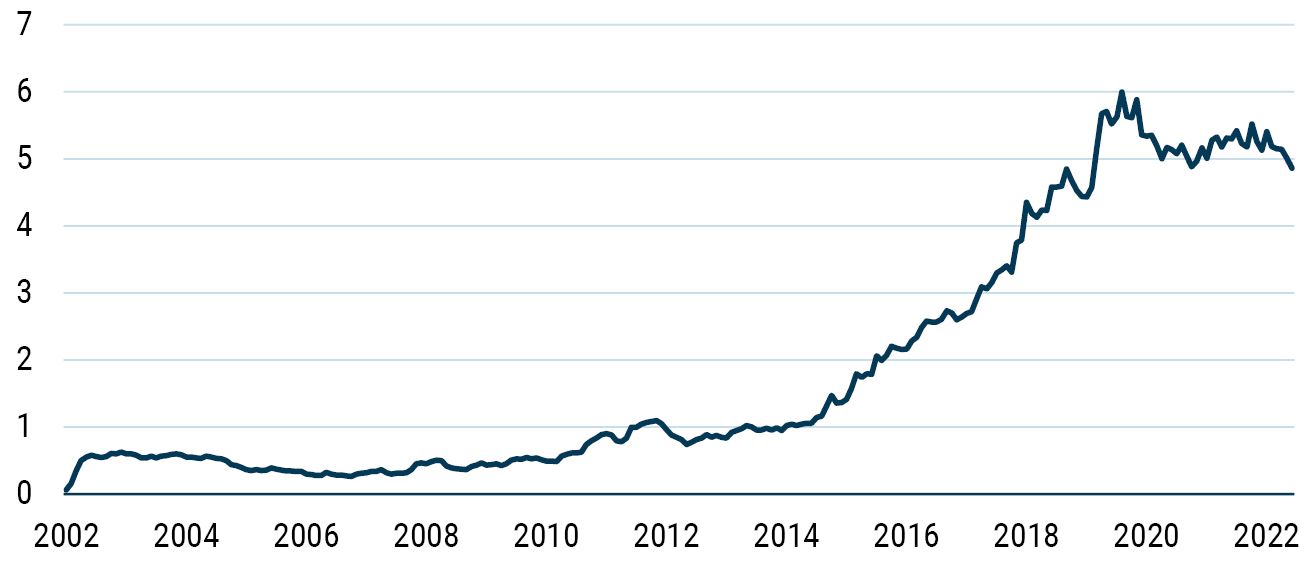
However, it is also very notable that dividends increased significantly in this period, rising from a paltry 1.7% of GDP in the lost decades, on average, to over 4% per annum in the last decade. Over this most recent decade, ordinary profits as a percent of GDP have grown at around 4.5% per annum. Meanwhile, dividends as a percent of GDP have grown at around 7%. So, around 60-65% of the improvement in dividends has been due to improved profits. The remaining dividend growth has come from improvement in the payout ratio (Exhibit 5 blue line). Note that this payout ratio is derived from the Ministry of Finance survey and hence includes unlisted companies. If we look at the listed sector alone, we see very little change in the payout ratio (orange line). This lack of substantial improvement in the listed sector payout ratio should give pause to the adherents to the rise of SVM in Japan.
The bottom line is that in essence, and unsurprisingly, the top-down picture is consistent with the insights we gained from looking at the “bottom-up” data. Deleveraging has a lot to do with Japan’s improved profitability.
Exhibit 5: Japan Inc. Payout Ratio
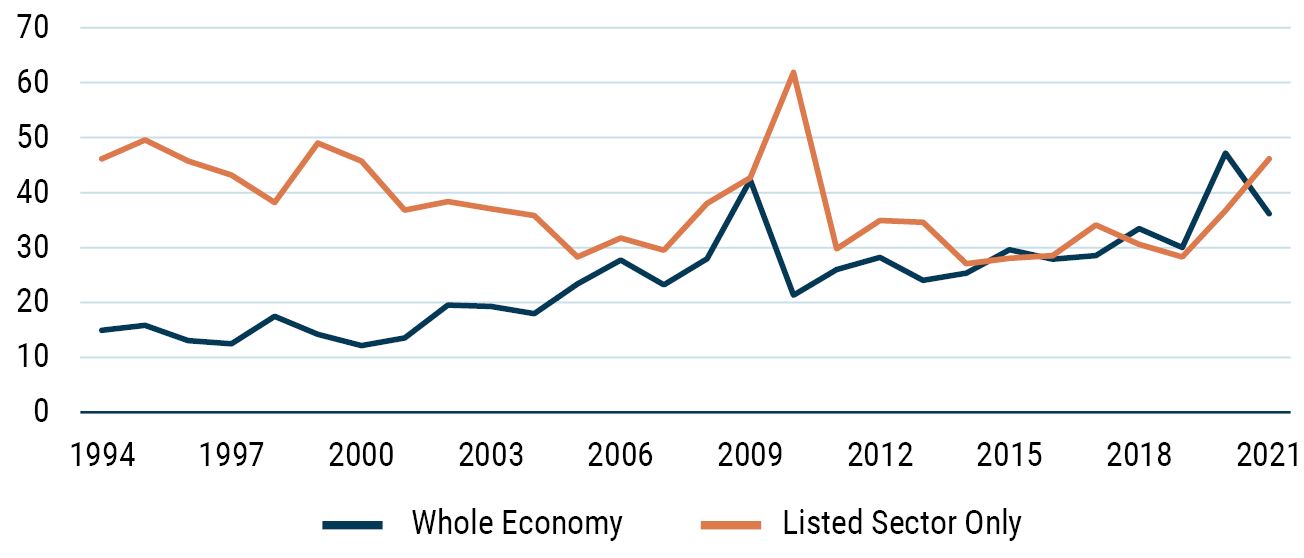
As of September 2023 | Source: Japan Ministry of Finance, Datastream
Deleveraging and Corporate Savings Behaviour
The evidence of deleveraging is clear to see. For instance, Exhibit 6 shows the enormous expansion of Japanese corporate balance sheets during the 1980s – the bubble years – followed by the long deleveraging from the late 1990s to around 2012. Post 2012 we have seen Japanese firms increasing their leverage but remaining net savers. This is essentially saying that Japanese corporates have increased gross leverage but still hold massive amounts of cash to offset against this, meaning that net debt is still falling.
Exhibit 6: Japan Inc. Assets and Liabilities
As of September 2023 | Source: Japan Ministry of Finance
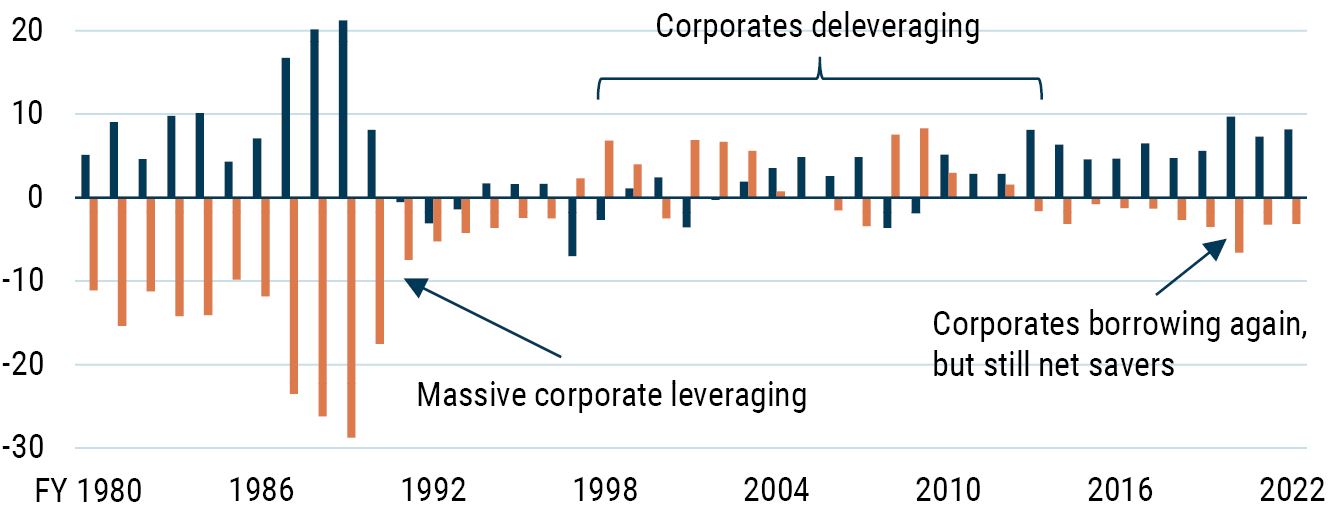
The net saving by Japanese firms can also clearly be seen by looking at the sectoral balances data. Again, the enormous leveraging is easy to spot during the bubble years, with corporate dis-saving equivalent to nearly 6.5% of GDP per annum. The switch in behaviour on the part of Japanese corporates is also very easy to see. Post 1998, Japan Inc. has been saving around 6.5% of GDP a year!
Exhibit 7: Japan Sectoral Balances (% of GDP)
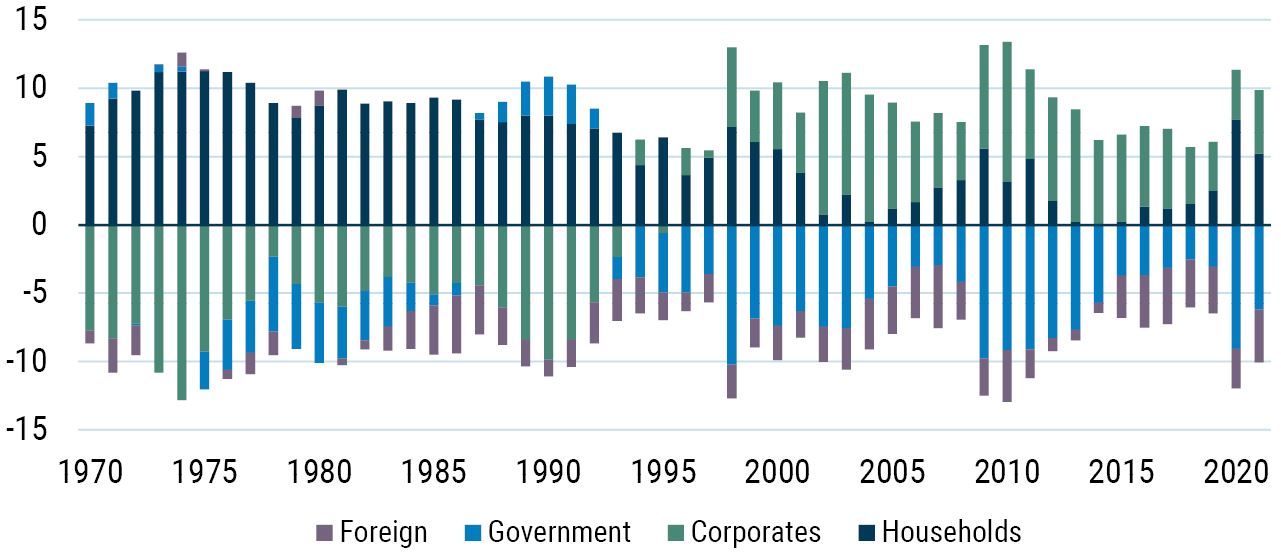
As of September 2023 | Source: Japan Cabinet Office
The same basic concepts can be seen when we look at the bottom-up data. Exhibit 8 shows total debt and net debt for companies listed on the TOPIX. We can see that total debt has been rising over the last few years, but net debt has been falling. The difference between the two is obviously the amount of cash that Japan Inc. has been hoarding (Exhibit 9).
Exhibit 8: TOPIX Total and Net Debt
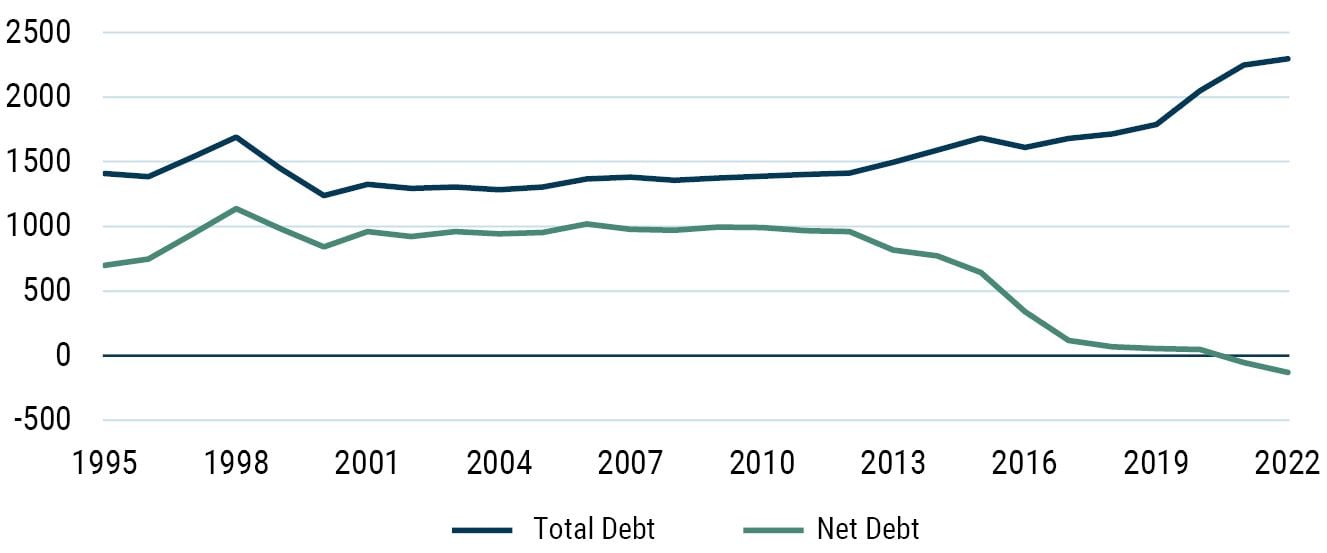
As of September 2023 | Source: Bloomberg
To me, at least, this build-up of cash again implies factors other than the rise of SVM in Japan. I find it hard to reconcile the build-up of cash with the idea of firms acting in shareholders’ best interests. I would suggest that this argues strongly for the need for an activist approach to investing in Japan, like an approach used by the GMO Usonian Japan Equity team, since I suspect it is only with such an approach that investors will be able to access these reserves.
Exhibit 9: TOPIX Cash
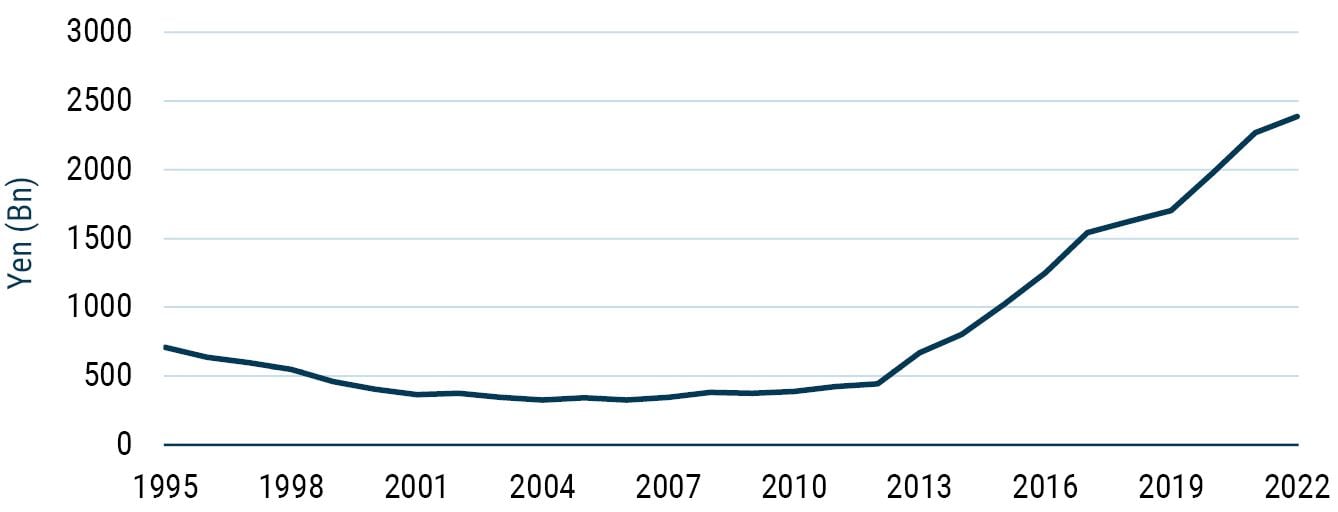
As of September 2023 | Source: Bloomberg
What Has Japan Inc. Been Doing with Its Savings?
The next question that naturally arises from the realization that Japan Inc. has been saving so much is what on earth have they been doing with all the savings? As noted above, cash balances have been rising over the revival period (to the tune of an average 2.5% of GDP per year since 2012).
However, the other big use of corporate savings has been foreign direct investment (FDI). Japan has been diversifying its production base outwards (ironically, the exact opposite of much of the discussion we hear these days in the rest of the world in terms of friend-shoring, on-shoring, near-shoring, etc.).
Exhibit 10: Japan Inc. Asset Flows (% of GDP)
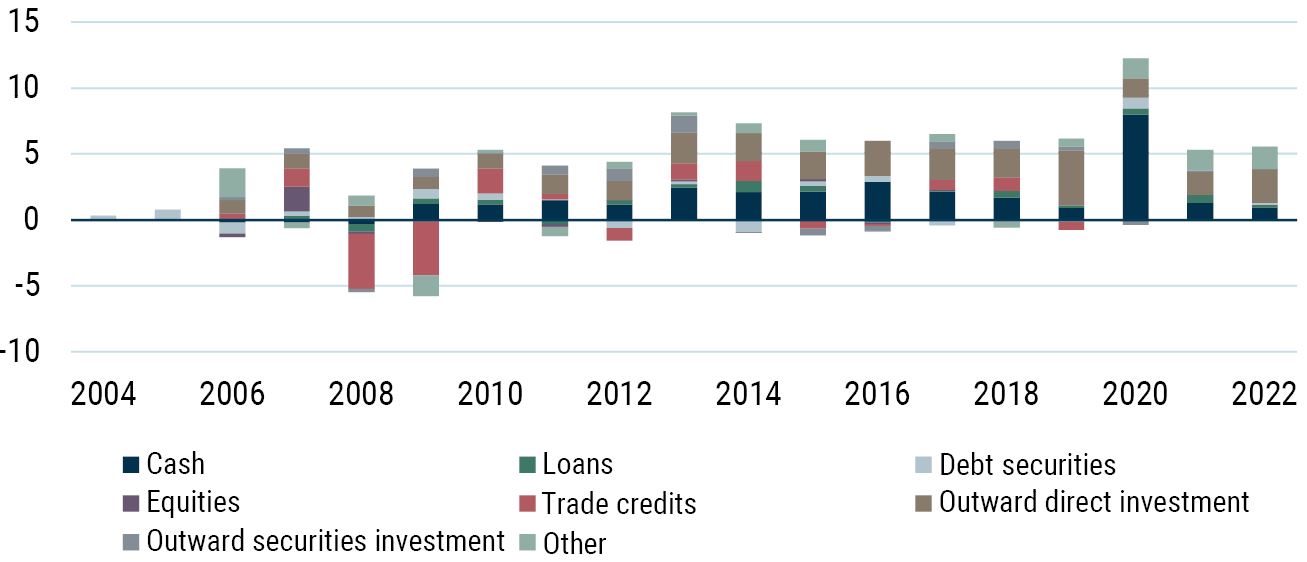
As of September 2023 | Source: Japan Ministry of Finance
As for the destinations of this near tsunami of FDI, Exhibit 11 shows that it has been roughly equally distributed between the U.S., Europe, and Asia.
Exhibit 11: Japanese FDI by Destination (2012-2022, %)
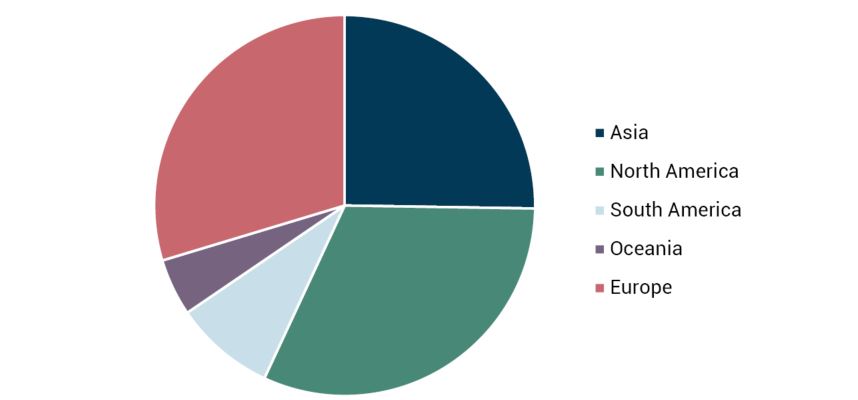
As of September 2023 | Source: Japan Ministry of Finance
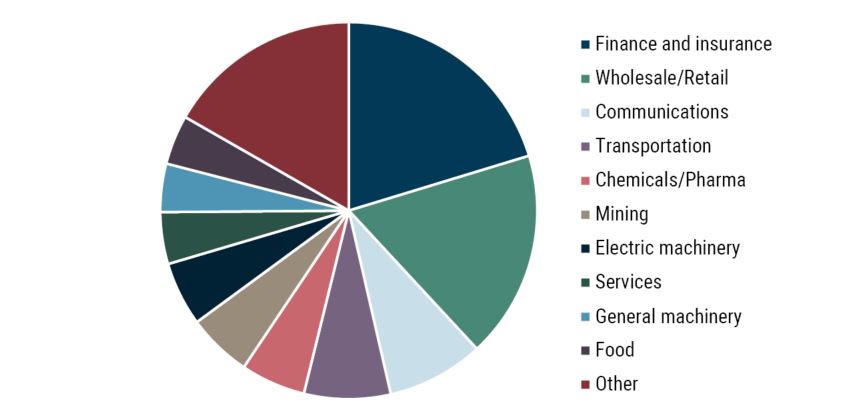
In terms of the industrial composition of the FDI, finance and insurance has been the biggest single sector, closely followed by wholesale and retail. The communications and transportation sectors are after that, followed by chemicals and pharmaceuticals, mining, and electric machinery.
Exhibit 12: Japanese FDI by Industry (2012-2022, %)
As of September 2023 | Source: Japan Ministry of Finance
Ownership – Another Nail in the SVM Coffin
Another feature of the “Japan has got religion” story is the claim that the ownership structure of Japanese equities has altered radically of late. The evidence suggests that indeed there has been a very significant shift in the ownership structure of Japan – but that it occurred around 20 years ago! So, hardly new news. In essence, foreigners are now the largest single group of equity owners, while individuals have been reducing their share of ownership since the founding of the market. And companies have been unwinding their cross-shareholdings (witness the decline in ownership of both business and financials).
Exhibit 13: Ownership of Stocks Listed on the Tokyo Stock
Exchange (%)
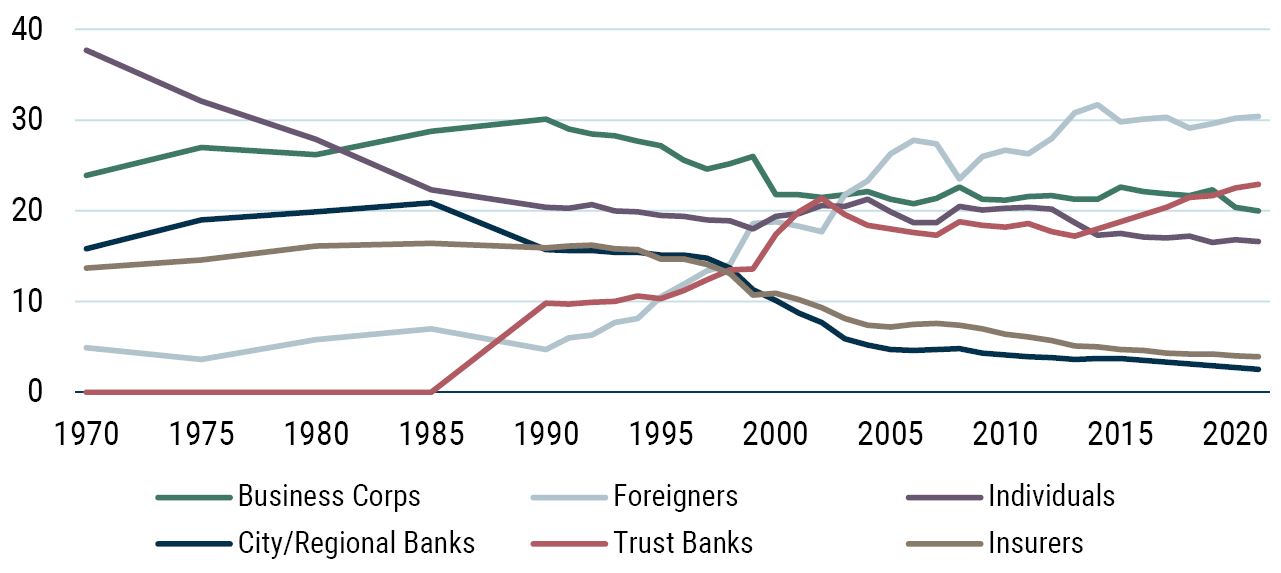
As of September 2023 | Source: Tokyo Stock Exchange
Franks, Mayer, and Miyajima (2014) 2 suggest simplifying the above into two broad categories – insiders and outsiders. They argue that individuals, trust banks (pension funds), investment trusts, and foreigners are outsiders, whereas financials and corporates are essentially insiders. Exhibit 14 shows the long-term evolution of this classification. As noted above there has certainly been a significant shift, with insiders seeing a significant decline in their ownership share from a peak of roughly 70% in the bubble years to a current 20%. However, outsiders have dominated the market for a long time with the pace of corporate reform remaining glacial.
Exhibit 14: Insider versus Outsider Ownership of the TSE
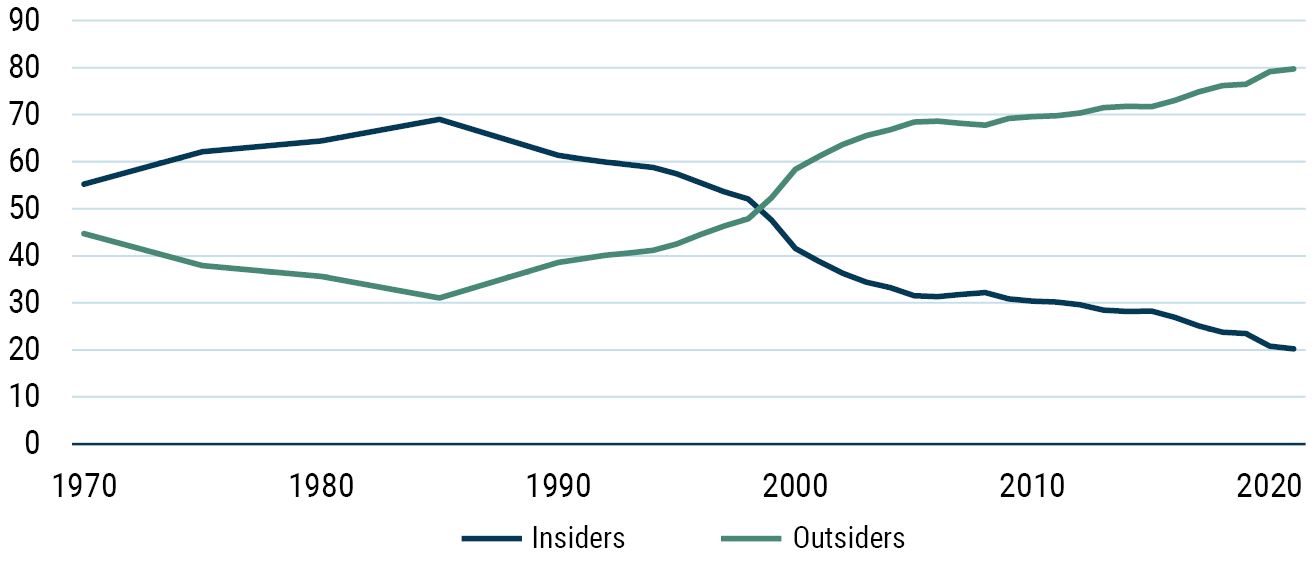
As of September 2023 | Source: Tokyo Stock Exchange, GMO
However, as Drew Edwards (who leads GMO’s Usonian Japan Equity team) pointed out to me, this high-level data may be missing something more subtle, that the ownership of shares has moved toward groups who vote, like investors (e.g., those who have signed the Japan Stewardship Code, etc.). So, although the ownership data shows shifts occurring long ago, a more nuanced view would suggest the 1990s-era change in ownership was not driven by SVM or a governance enhancement push. Rather, banks unwound cross-holdings in the 1990s out of financial necessity and because of the “Japanese Big Bang” Financial System Reforms. The Abenomics-era push to unwind cross-holdings and change ownership behavior started in 2013. As Drew noted to me, “the results are slowly becoming more evident”…as ever, patience is a virtue.
A few years ago, all I heard were stories of the massive role of the Bank of Japan in owning equities. In particular, headlines such as “BoJ owns Two-Thirds of the ETF Market” were commonplace. Indeed, by my estimates the BoJ does hold somewhere around 60% of the Japanese index ETF market today. Many of these ETFs track the Nikkei 225, which like the Dow Jones is a price-weighted index. This can give rise to some strange effects. For instance, Fast Retailing has a near 12% weight in the Nikkei but only a 0.5% weight in the TOPIX. Similarly, Softbank has a 4% weight in the Nikkei but a 0.9% weight in the TOPIX. Given the weights of stocks like Fast Retailing in the Nikkei-tracking ETFs and the BoJ’s ownership of the ETFs, a very rough calculation suggests that the BoJ effectively owns around 13% of the total equity of Fast Retailing and around 7.5% of Softbank’s equity.
When we look at BoJ ownership across the entire TOPIX we see they hold equities accounting for almost 5% of the market, down from a peak of 6% in 2020. 99% of this ownership is in the form of index-tracking ETFs.
Exhibit 15: BoJ Ownership of the TOPIX (%)
As of September 2023 | Source: Bank of Japan, Bloomberg
The Story So Far…
Despite the common refrain that Japan has “finally got religion” and that corporate governance reform and SVM are behind the rise in Japan Inc.’s profitability, the data suggest otherwise.
The rise in profitability is really the outcome of a decades-long deleveraging process that has seen the amount of cash flow diverted to interest payments collapse. This in turn allows the cash flows to fall through to the bottom line and, hence, equity investors.
Japanese corporates have been saving at a prodigious rate (around 6.5% of GDP per annum) for more than 20 years now! This is reflected in the massive build-up of cash on company balance sheets (around 2.5% of GDP per annum for the last decade). Shareholders will likely need to use an activist approach to unlock this value. The other main use of savings has been spurring a surge in foreign direct investing.
Despite all the talk of reform in corporate Japan, the ownership data suggest that this has been going on for a very long time and that outsiders have been the dominant group for over 20 years. Hence, it is hard to attribute the profitability surge of the last 10 years to this factor.
To me at least, this all adds up to a case where Japan hasn’t (thankfully) wholesale adopted the world’s dumbest idea (SVM). Rather, we have seen a paying down of debt, which should allow a sustainable increase in bottom-line profits.
The Icing on the Cake – a Tale of Two Cities
Now for the really exciting part of this paper. Unlike the U.S., which has more than discounted the high profitability (see The Curious Incident of the Elevated Profit Margins for more on this), Japan has actually witnessed continued de-rating despite the increased profitability. So, while the Shiller PE for the U.S. currently stands on nearly 30x – more than fully reflecting the high profit margins of the last decade – the Japanese market currently trades around 18x.
Exhibit 16: Shiller PE for the U.S. and Japan
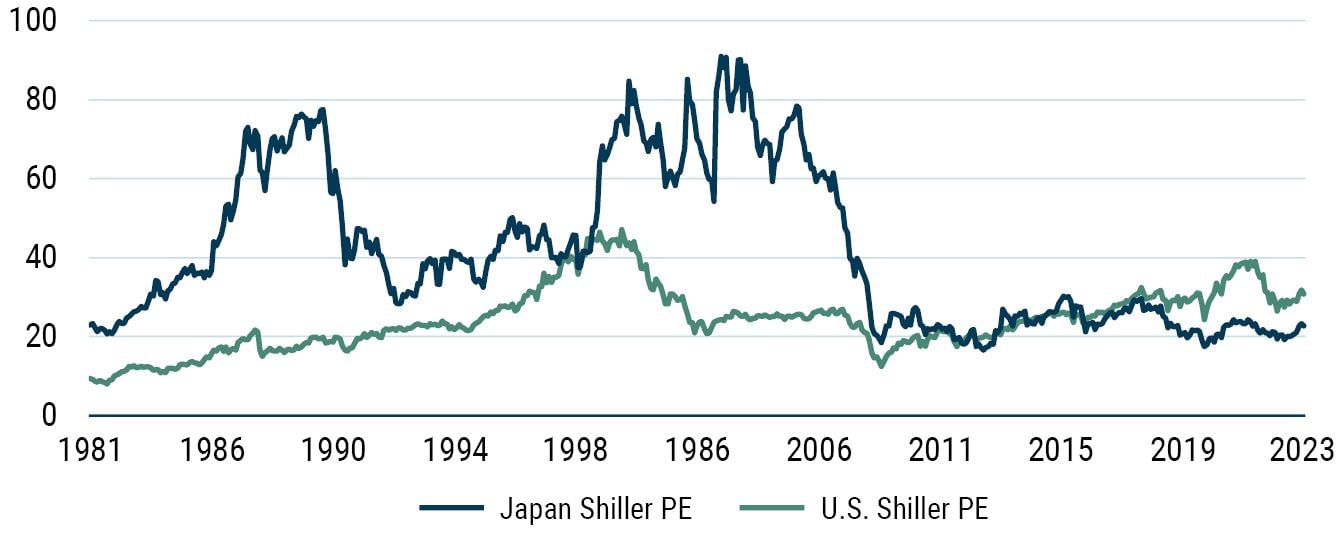
As of September 2023 | Source: Barclays
The valuation case is even more transparent and compelling when we look at EV/EBITDA – if you ever needed a bull case for Japan, this is the valuation chart for you! The U.S. stands on an impressively high 13.5x on this measure. Japan is at the other extreme, trading on just 5.25x.
Exhibit 17: U.S. and Japanese EV/EBITDA (x)
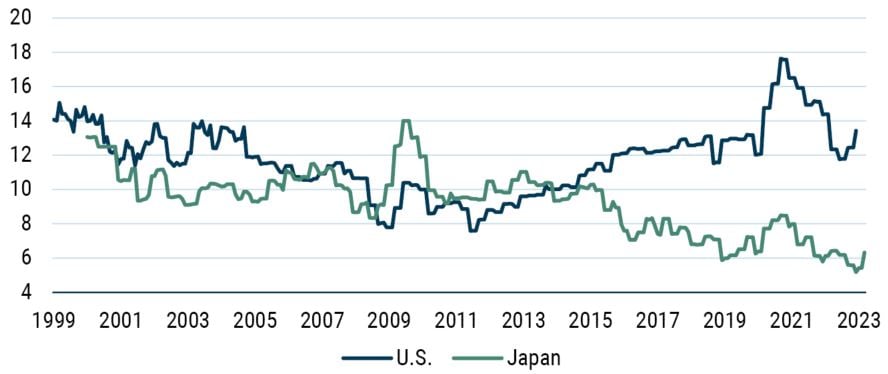
As of September 2023 | Source: Bloomberg
As if this wasn’t enough, the yen also looks cheap (hardly surprising given the rate differential between Japan and the rest of the world). Should the yen remain cheap, then it should obviously benefit Japanese exporters, further boosting profits. If we see a return to more PPP-like levels for the currency, then unhedged investors will, of course, benefit.
Exhibit 18: Dollar/Yen and PPP Estimate
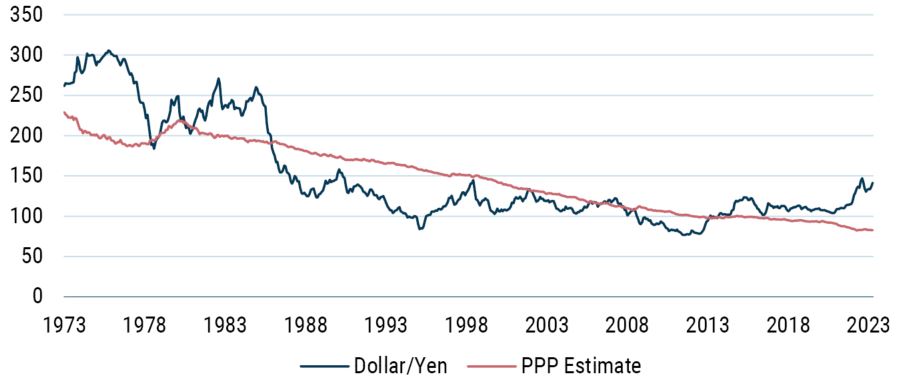
As of September 2023 | Source: Datastream, GMO
Bottom Line
Japanese profits have benefited from the prolonged deleveraging of Japan Inc. This reduction in debt coupled with exceptionally low interest rates has allowed cash flow to impact the bottom line. This has been the major engine of the increase in Japanese profitability that we have witnessed, not some Damascene conversion of Japan Inc. to the cult of SVM.
As I have shown before, the U.S. has not only priced in the higher levels of profitability but has effectively discounted both the future and the hereafter as well. Japan stands in marked contrast. The Japanese equity market has continued to de-rate despite the improved fundamentals. To me, this creates a potentially very interesting opportunity.
As a final fillip to the case, the yen continues to look significantly undervalued, and this should provide either a further fundamental boost or a currency appreciation boost to unhedged equity investors.
Download article here.