In late 2020, we launched GMO’s Equity Dislocation Strategy to exploit the extraordinary dislocation in the valuation of value and growth stocks. We sought to generate strong returns from the bursting of the growth bubble and narrowing of valuations between the cheapest and most expensive stocks. From its inception in October 2020 through January 2024, Equity Dislocation returned 13.5% per annum 1 while MSCI ACWI Value only beat MSCI ACWI Growth by a modest 4.1% per annum. Equity Dislocation significantly outperformed a passive value-growth implementation due a combination of strong stock selection, a focus on the most mispriced securities, and thoughtful risk controls.
Equity Dislocation Strategy since launch
Cumulative returns
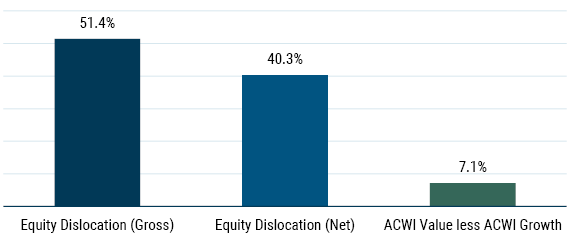
Data from 10/31/2020 to 1/31/2024
The Opportunity Today
Despite solid returns to date, we believe the opportunity for Equity Dislocation remains compelling. The chart below shows the valuation of the cheap 50% of the U.S. market relative to the expensive 50% of the U.S. market, normalized such that 1.0 is the historic median. As of January 31, 2024, the U.S. valuation differential between value and growth remains at a historic extreme (4th percentile vs. history) due to the significant outperformance of growth stocks in 2023. In Europe, the opportunity is similarly attractive at the 2nd percentile vs. history. 2 Valuation spreads within sectors remain dislocated with the ratio of the most expensive vs. cheapest valuation terciles in the top quartile across nearly all sectors relative to history (Energy and Real Estate are the exception, near average). 3
All together, we estimate that value globally still needs to outperform growth by 50-60% for relative valuations to return to long-term averages. Consequently, Equity Dislocation remains the largest single exposure in our Benchmark-Free Allocation Strategy.
Value is Extremely Cheap
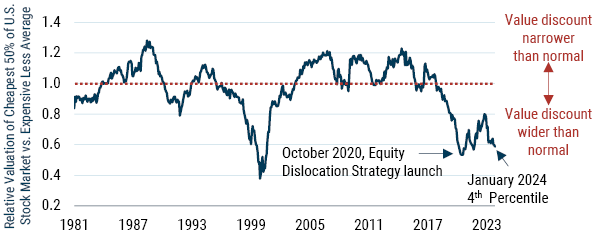
As of 1/31/2024 | Source: GMO
Stock valuations are calculated on a blend of Price/Sales, Price/Gross Profit, Price/Book, and Price/Economic Book.
The Path Forward
The resurgence of growth in the U.S. once again cast doubt on whether value can outperform looking forward. We view today’s extreme valuation differentials as strong evidence in support of value’s potential to meaningfully outperform growth. The recent positive performance of U.S. growth was led by a handful of mega cap stocks, and was an outlier compared to the rest of the world. Outside the U.S., value has been consistently winning.
The U.S. may also be ripe for a value-growth reversal as sentiment shifts. The AI frenzy combined with expectations for rate cuts in 2024 renewed “bubbly” investor behavior. If the projected Fed cuts fail to occur or growth companies fail to deliver on aggressive expectations, growth investors will likely wind up disappointed. 4
We expect value-growth spreads to return to historic norms. However, even if value continues to trade at an extraordinary discount, we believe Equity Dislocation stands to profit from the abnormally wide rebalancing impact. 5 Rebalancing is an often overlooked and critical component of value investing. Value stocks are priced for disappointment; a small upside surprise causes multiple expansion and graduation to the growth universe. An optimistically priced growth stock falls into the value universe when it fails to meet lofty expectations and its multiple contracts. Value investing wins by buying low and selling high. The associated price moves are abnormally large when valuation spreads are abnormally wide, and a long-short strategy can take profits as these transitions occur.
Absolute return, diversification, growth hedge
Equity Dislocation plays three roles in investor portfolios:
- Absolute return – We (and many other investors) hold Equity Dislocation due to the strong potential return in a value spread reversion scenario.
- Diversification – Since launch, Equity Dislocation has delivered returns commensurate with global equities, but in an entirely different pattern. The strategy is roughly market neutral and since inception has had approximately zero beta to equities.
- Hedging – If you are worried about excessive growth exposure in your portfolio through either your private equity book, an abundance of the “Magnificent Seven” via passive exposure, or concentrated active managers, Equity Dislocation has demonstrated a correlation of -0.4 to both MSCI ACWI Growth and MSCI U.S. Growth.
Download commentary here.
Gross of fees (11.1% per annum net of fees).
In Japan and the emerging markets, value has delivered stronger, more consistent relative performance; there value is still attractive, though less extreme, at 34th and 23rd percentile, respectively. Equity Dislocation has been able to generate positive returns from areas with value outperformance; Japan in particular has been a consistently, outsized contributor to Equity Dislocation returns since inception.
This disconnect persists despite some of the 2020 growth bubble froth having dissipated. In late 2020, Equity Dislocation was near its maximum 10% underweight to Information Technology and 10% overweight to Financials given the extreme expensiveness/cheapness of those two sectors, respectively. By 1/31/2024, we moderated our sector allocations and the strategy was only 2.3% net short IT and 4.4% net long Financials. We still find the security selection opportunity within sectors (i.e., the ability to identify cheap value and expensive growth) very compelling.
We do not believe that interest rates and value relative performance are fundamentally linked; however, there has been a strong realized correlation between the two recently. For more, see The Duration of Value and Growth: Much Closer to Each Other Than You’d Guess (Inker 2021).
See GMO’s 3Q 2022 Quarterly Letter, “The Value Opportunity Updated: After a Good Run, Value Looks Anything but Exhausted” and “Time to Dive Deep into Value: A Sliver of U.S. Stocks Offers an Excellent Opportunity,” (Inker 2022).
Disclaimer: The views expressed are the views of the Asset Allocation through the period ending February 2024, and are subject to change at any time based on market and other conditions. This is not an offer or solicitation for the purchase or sale of any security and should not be construed as such. References to specific securities and issuers are for illustrative purposes only and are not intended to be, and should not be interpreted as, recommendations to purchase or sell such securities. Past performance is no guarantee of future results.
Copyright © 2024 by GMO LLC. All rights reserved.
Gross of fees (11.1% per annum net of fees).
In Japan and the emerging markets, value has delivered stronger, more consistent relative performance; there value is still attractive, though less extreme, at 34th and 23rd percentile, respectively. Equity Dislocation has been able to generate positive returns from areas with value outperformance; Japan in particular has been a consistently, outsized contributor to Equity Dislocation returns since inception.
This disconnect persists despite some of the 2020 growth bubble froth having dissipated. In late 2020, Equity Dislocation was near its maximum 10% underweight to Information Technology and 10% overweight to Financials given the extreme expensiveness/cheapness of those two sectors, respectively. By 1/31/2024, we moderated our sector allocations and the strategy was only 2.3% net short IT and 4.4% net long Financials. We still find the security selection opportunity within sectors (i.e., the ability to identify cheap value and expensive growth) very compelling.
We do not believe that interest rates and value relative performance are fundamentally linked; however, there has been a strong realized correlation between the two recently. For more, see The Duration of Value and Growth: Much Closer to Each Other Than You’d Guess (Inker 2021).
See GMO’s 3Q 2022 Quarterly Letter, “The Value Opportunity Updated: After a Good Run, Value Looks Anything but Exhausted” and “Time to Dive Deep into Value: A Sliver of U.S. Stocks Offers an Excellent Opportunity,” (Inker 2022).