Executive Summary
- Value equities are still priced for significant outperformance, globally.
- Within the U.S., “Deep Value” (roughly the cheapest 20% of the universe) is the most (and only) attractive Value segment. Outside the U.S., Value (cheap 50%) is broadly attractive.
- Value is positioned to win, even if it remains cheap
Part 1
The Value Opportunity Updated: After a Good Run, Value Looks Anything but Exhausted
The 12 months to September 30 were the best for value relative to growth performance since the fall of 2001. It was a huge relief for those value investors who managed to survive the long period of growth ascendance since about 2007. Like many periods of value outperformance, however, it didn’t quite live up to the way that value investors had imagined such a year might be for a couple of reasons. First, while value stocks did outperform growth by a double-digit margin (MSCI ACWI Value beat ACWI Growth by 12.4%), value stocks didn’t actually make any money in absolute terms, falling by 4.4% in U.S. dollar terms (those of you who measure your returns in different currencies may feel a little better about value’s absolute performance). And second, it seems as if growth investing still got all the attention, even if in this case the attention was focused on the spectacular flameouts of a number of high-profile growth stocks and a few high-profile growth investors. Value’s strong performance seemed to be primarily about avoidance of really bad returns rather than any particularly notable successes. While long/short value strategies such as GMO’s Equity Dislocation Strategy were able to generate double-digit positive returns, a quick look at the attribution shows that most of the returns came from the very negative performance of high-priced growth stocks our strategy was short.
Given value’s significant outperformance of growth this year, we have been asking ourselves several questions that we know are also on the minds of our clients. Is there still money to be made in the value/growth trade? Are there better and worse parts of the world in which to be investing with a value mindset today? How tightly do you need to define “value” to get to an interesting group of stocks? And what would happen to value if these stocks don’t revert to historically normal value spreads but stay at today’s levels indefinitely?
Value is still priced for significant outperformance everywhere
As for the question of whether the value opportunity is over, it seems pretty clear to us that the answer is no. Exhibit 1 is an updated version of the valuation of value chart I’ve been showing for the last couple of years.
EXHIBIT 1: Where are we on relative valuations?
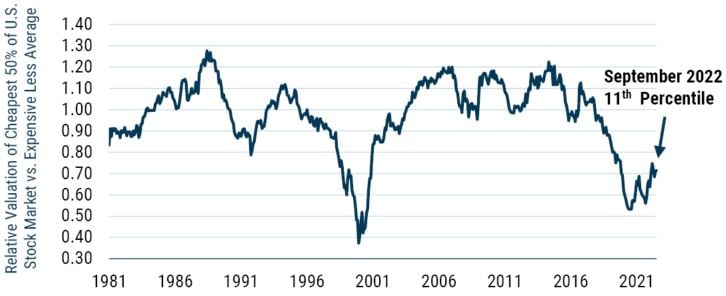
As of 9/30/2022 | Source: GMO
Composite Valuation Measure is composed of price/sales, prices/gross profit, price/book, and price/economic book.
This chart shows the valuation of the cheap half of the U.S. market against the expensive half, and it’s been renormalized so that the average valuation gap is 1.0. As of the end of September, value was trading at 0.72, which is the 11th percentile versus history. It’s certainly up from where it was a year ago, when we were at the 4th percentile versus history, but far from all the way back to normal. And the U.S. is certainly not an outlier compared to the rest of the world. Table 1 shows the percentile ranking for value versus growth in a variety of regions, sliced in a variety of ways.
Table 1: Percentile Ranking of Valuation Spreads
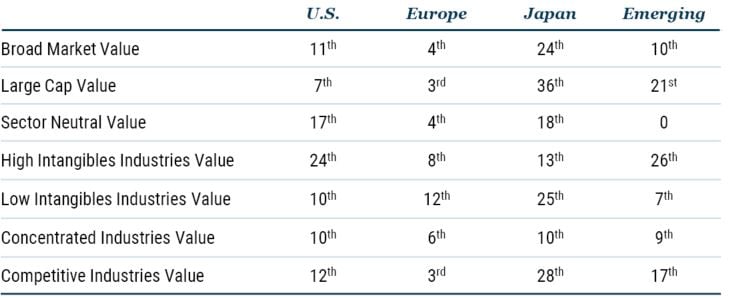
As of 9/30/2022 | Source: GMO
Valuations of 50% cheapest stocks on GMO Composite Valuation Measure, measured on a blend of price/sales, price/gross profit, price/book, and price/economic book.
While Europe is a notable outlier as the most extreme value spread in the world, we see a wider than normal spread of value in every region and in every different way we know how to slice value versus growth. The willingness to pay extreme prices for [supposedly] long-duration growth assets that benefited from low rates led to a massive growth bubble. Given the valuation extremes reached across regions and sectors, value’s recent outperformance corrects only part of the dislocation. For this reason, long value/short growth remains our highest conviction position.
Within the U.S., “deep value” (cheapest 20%) is the truly dislocated market segment
But while the halves of the market are a natural way to break things up from a style perspective, they can hide some important distinctions. In our Equity Dislocation Strategy we differ from the global style indices in a number of ways. We are much closer to equal weighting than capitalization weighting, we limit the size of our sector and industry bets between longs and shorts, and we focus much more heavily on the most extremely cheap and overvalued segments of the market rather than simply looking at the cheap and expensive 50%. Over 80% of the long and short sides of our strategy are in the cheapest and most expensive 20% of the universe, so it is natural for us to want to look at the quintiles of valuation rather than the halves. Exhibit 2 shows quintiles of valuation in the U.S.
EXHIBIT 2: Valuations with a finer-Toothed comb
Quintiles of valuation in top 1000 U.S. stocks
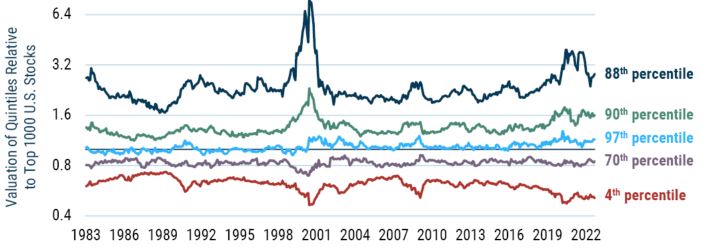
As of 9/30/2022 | Source: GMO
Composite Valuation Measure is composed of price/sales, prices/gross profit, price/book, and price/economic book. Quintiles of value and market are weighted by 4th root of market cap.
While the five different lines of this chart make it a little busy, we can immediately see several interesting features of the U.S. market today. On the expensive end (noted by the dark blue line), the valuation of the very most expensive stocks has indeed come down relative to the rest of the market. They peaked out trading around 4 times the valuation of the average company and are now trading around 3 times. That is still one of the more extreme valuations of the last 40 years, scoring as the 88th percentile valuation versus history. The rest of the growth universe is less expensive relative to the market but, if anything, a bit more expensive relative to its own history, at the 90th percentile. On the value end of things, however, the story isn’t quite so simple. The cheapest 20% of the market (in red) is very cheap indeed, still trading at the 4th percentile versus history. But the rest of the value universe is much less attractively positioned, with the next quintile at the 70th percentile and the “middle” quintile of stocks that are neither particularly value-y or growth-y at just about its most expensive valuation in history. For the purposes of our Equity Dislocation Strategy, nothing in this chart is particularly concerning. While the opportunity in the most expensive tier of stocks is less extreme than it was, it is still the group that seems worth focusing our short book on, whereas the long side gives us every reason to be focusing almost exclusively on this cheapest quintile of stocks. But the pattern within value is an intriguing one that does have some meaningful implications for long-only portfolios. Looked at in this way, it seems as if a value strategy in the U.S. should be avoiding the “shallow value” stocks that are mildly cheap relative to the market and focusing solely on the “deep value” quintile. But the version of this that is most relevant for a long/short that is close to equal weighting within the large cap universe is not necessarily the version you’d be most interested in for a long-only portfolio. 1
But what we see across different weighting schemes is that the pattern is pretty similar whether we are using the weighting scheme most relevant to a long/short (at least the way we tend to run our long/shorts) or ones that are more relevant to long-only portfolios. The percentile ranking of the cheapest 20% of the market against the percentile ranking of the next 30% of the market is shown in Table 2.
Table 2: Valuation Percentiles of Deep and Shallow Value
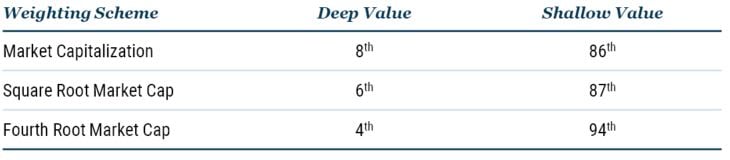
Data as of 9/30/2022
Valuation metric is GMO’s price/scale model, which blends a number of different valuation ratios, corrected for accounting distortions.
Your portfolio may have minimal exposure to U.S. deep value today
The upshot to us is pretty obvious. If you want to take advantage of the attractive pricing of value stocks in the U.S., you need to be focusing on the very cheapest tier of stocks. The rest of value is actually pretty unattractively positioned. This does pose a bit of a problem for a lot of value-biased managers given the way they build their portfolios. Most of the U.S. value managers who managed to survive the long dark winter for value since 2007 did so by diversifying their portfolios beyond deep value. Deep value stocks were both the worst performing cohort from 2007-2020 and the group that didn’t have particularly obvious compelling attractions beyond their cheapness. Your value portfolio would both have performed better and been an easier sell to clients if you blended value with other factors – value with a quality bias, value stocks that had some positive sentiment, or relatively inexpensive growth stocks (if allowed). Value-biased managers who had always built their portfolios in such a way would have outperformed “purer” value managers, as those other factors did significantly better than value in the 2007-2020 period. And value managers interested in not getting fired by clients annoyed with their performance would have been well served by moving to such a “multifactor” brand of value investing. At GMO we have long used a multifactor approach, albeit with a larger weight to value than many other managers. And we still believe that such an approach is the right way to build an “all-weather” value-biased equity portfolio that has a chance of keeping up even in an environment in which value is struggling. But today, I believe there is a good argument for putting together a more targeted portfolio that is not designed to do OK in all environments, but is instead tailored for the environment we find ourselves in where deep value is far better positioned than the rest of the value universe. Such a strategy would have done dreadfully in the value winter of 2007-2020, and I’m quite grateful that we weren’t running one. But now, when the forecast for value looks to be an extended period of clear skies, we have built a new U.S. equity strategy focused solely on the cheapest tier of stocks. (More detail on what the cheapest tier of U.S. stocks looks and acts like can be found in Part 2, below.)
Value is broadly attractive outside the U.S.
Interestingly, the pattern in the U.S. is not what we see in the rest of the world. Exhibit 3 shows the quintile breakdown of valuations in the MSCI EAFE and MSCI Emerging universes, where the attractiveness of value is much more uniform between “deep” and “shallow” value.
EXHIBIT 3: Brief tour of rest of world
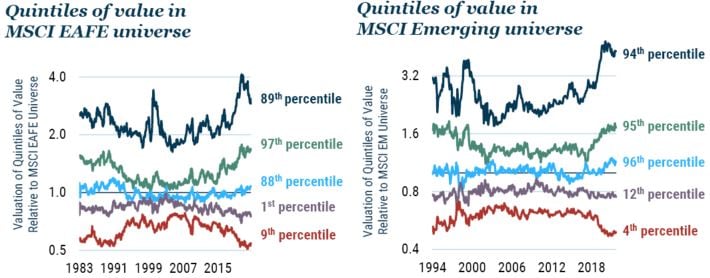
As of 9/30/2022 | Source: GMO
Composite Valuation Measure is composed of price/sales, prices/gross profit, price/book, and price/economic book. Quintiles of value and market are weighted by 4th root of market cap. MSCI data may not be reproduced or used for any other purpose. MSCI provides no warranties, has not prepared or approved this report, and has no liability hereunder. Please visit https://www.gmo.com/americas/benchmark-disclaimers/ to review the complete benchmark disclaimer notice.
In both of these regions, deep value stocks are very well positioned, but the next quintile of value is also quite attractively cheap. While the value opportunity is generally at least as good for these universes as it is in the U.S., the need to focus on deep value to the exclusion of other value-tilted stocks is much less obvious.
Value is positioned to win, even if it remains cheap
All this analysis of the attractiveness of value shares a strong underlying assumption: value is most attractive when it is trading at a larger than normal discount to growth stocks and least attractive when that discount is small. For anyone who believes that these valuation discounts tend to revert to historical averages, such an assumption seems obviously appealing. But what happens if such reversion does not occur? What if today’s abnormally wide discount is permanent? Can value outperform? We believe the answer is a resounding yes, driven by a factor that is often overlooked by investors when they think of value (or indeed growth) as an investing style. That factor is rebalancing, and it can help explain not only why value is such an attractive investing style today but also why it was such a dangerous parameter to focus too heavily on from 2005-2015. Exhibit 4 shows a breakdown of the components of return for value relative to growth in the U.S. in both the 1983-2006 period when value performed quite well and in the 2007-2021 period when value lost out to growth. 2 While the performance of value versus growth was quite different in the two periods, most of the components of return showed strong continuation.
EXHIBIT 4: Total returns for value versus growth
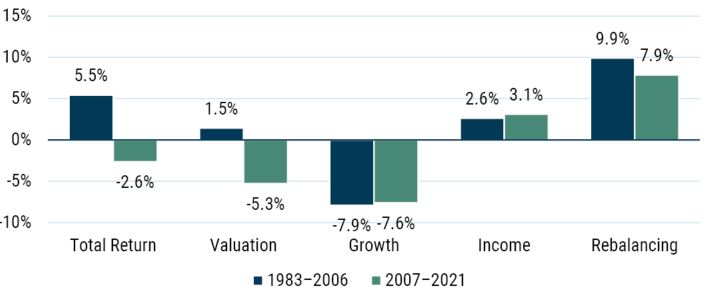
As of 1/31/2021 | Source: Worldscope, Compustat, MSCI, GMO
U.S. value defined as the cheap half on market cap within the U.S., U.S. growth is the expensive half on market cap within the U.S. MSCI data may not be reproduced or used for any other purpose. MSCI provides no warranties, has not prepared or approved this report, and has no liability hereunder. Please visit https://www.gmo.com/americas/benchmark-disclaimers/ to review the complete benchmark disclaimer notice.
The single biggest difference between the first period and the second was the valuation component. From 1983-2006, value stocks on average got more expensive relative to growth, whereas from 2007-2021 they got much cheaper. If valuation spreads were to remain constant, that factor would definitionally be zero, and the other three components would determine whether value would win or lose. The first two factors are the obvious ones we think of when we contemplate value and growth investing – growth and income. Everyone knows that growth stocks grow faster than value stocks, and everyone knows that value stocks spin off more income than growth stocks. In this case, what everyone knows is absolutely correct. But it is also incomplete. Growth stocks do indeed grow faster than value stocks, to the tune of 7.5-8% in an average year, and value stocks offer investors more income – whether in the form of dividends or net stock buybacks – to the tune of 2.5-3% per year. The problem for value is immediately apparent, because 7.5-8% is a lot bigger than 2.5-3%. The extra income from value stocks does not come particularly close to making up for the extra growth that comes from growth stocks. Happily for value, that is not the end of the story, because there is an additional component of returns that is invariably positive for value relative to growth – rebalancing. Rebalancing is a bit of a catch-all term for all of the ways that the constituents of the growth and value universes change over time. The single largest piece of rebalancing is the swapping of stocks between the value and growth universes. This naturally happens whenever a growth stock drops in valuation enough to fall out of the growth universe or a value stock rises in valuation enough to graduate to the growth universe. 3 While this type of turnover isn’t immensely large in the average year, it is almost invariably material. Exhibit 5 shows the percent of turnover between value and growth in the U.S.
EXHIBIT 5: How many exits/entries are there?
Style migration probabilities (%)
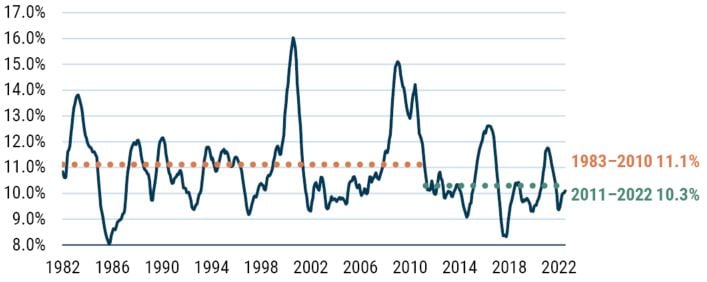
Data from 1982–2022 | Source: GMO, Compustat, Worldscope, MSCI
MSCI data may not be reproduced or used for any other purpose. MSCI provides no warranties, has not prepared or approved this report, and has no liability hereunder. Please visit https://www.gmo.com/americas/benchmark-disclaimers/ to review the complete benchmark disclaimer notice.
This series does bounce around a bit from year to year, but the average rate of migration is actually quite stable. I tried to engineer as large a gap as I could between the earlier period of value outperformance and the recent period of growth outperformance, and the largest gap I could come up with was a drop from 11.1% on average from 1983-2010 to 10.3% from 2011-2022. Even in the lowest years on record, this migration was in the 8-9% range.
This migration provides a large boost for value because the process of moving from value to growth is a positive one, whereas the process of moving from growth to value is invariably painful for investors. The size of the benefit for value and pain for growth is driven by the gap between the valuation of the exits from the value or growth universe and the valuation of the entries. Exhibit 6 shows a scatterplot of the size of this gap against the ratio of the valuation of value to growth stocks that we used in Exhibit 1.
EXHIBIT 6: Valuation Spread drives return from rebalancing
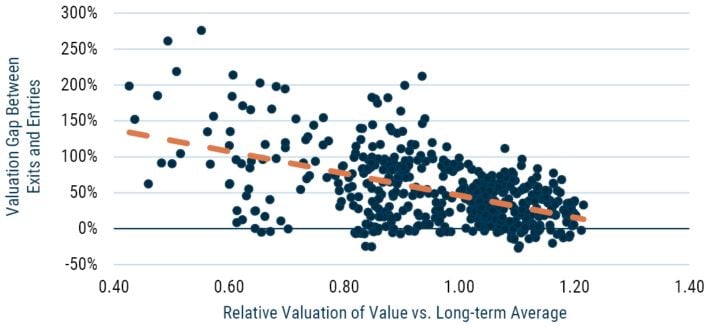
Data from 1982–2022 | Source: GMO, Compustat, Worldscope, MSCI
MSCI data may not be reproduced or used for any other purpose. MSCI provides no warranties, has not prepared or approved this report, and has no liability hereunder. Please visit https://www.gmo.com/americas/benchmark-disclaimers/ to review the complete benchmark disclaimer notice.
As the dashed regression line shows, there is a pronounced tendency for this exit/entry valuation gap to be larger when the spread of valuation between value and growth is larger. This relationship makes plenty of intuitive sense. If value stocks are trading far cheaper than growth, a growth stock falling in the value universe is likely to have fallen quite far in valuation, whereas a value stock that moves into the growth universe will have gotten a big valuation bump. 4
The size of the expected gap varies widely with the spread of value. We can use the regression line to see the impact of different discounts for value in Exhibit 7.
EXHIBIT 7: Entry/Exit Gap at today’s valuations
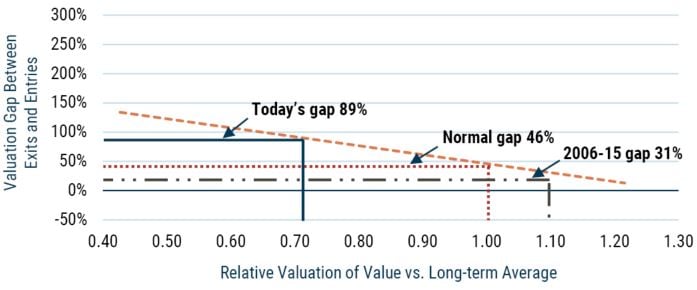
Source: GMO
At a normal valuation spread of 1.0, the expected exit/entry gap is 46%. At today’s spread, that gap is much larger at 89%, and in the tight spreads in the middle of the first two decades of the 2000s, it should only have been around 31%. Translating from the size of the gap to the size of the expected rebalancing effect, we can estimate that rebalancing at an average valuation should be 7-8%, at a tighter spread of 1.1 it should be only 5-6%, and at today’s spread it should be 11-13%. 5
To put it slightly differently, if valuation spreads are constant and value is trading at 1.1 times its average valuation, you would expect value to perhaps break even versus growth or even underperform slightly. At an average spread of 1.0, value would be expected to beat growth by 1-3% at a constant spread. And if spreads were to stay stable at September’s valuation of 0.72 times average, the expected return from value relative to growth should be in the range of 6-9%. While value will make money more quickly if valuations revert higher – as they indeed did over the past year – at a constant wide discount, a typical value portfolio could hope to beat the market by 3-4% per year, and a value/growth long/short portfolio could deliver a lovely 6-9% return on top of cash forever. Call me greedy, but I would love to see a world in which value stays at today’s spreads for at least the rest of my career. I’d have less to write about but managing money would at least be easy.
Part 2
Time to Dive Deep into Value: A Sliver of U.S. Stocks Offers an Excellent Opportunity
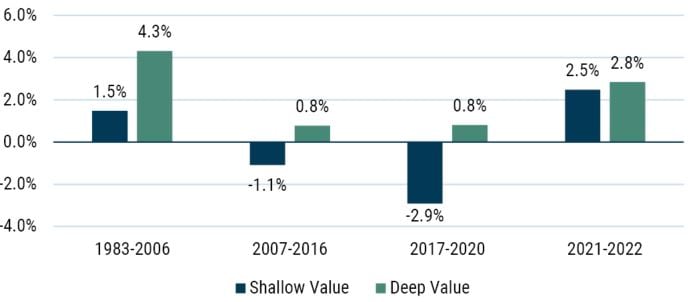
Across most of history, if you were going to own value stocks, you would have really wanted to own the very cheapest of them. Exhibit 8 shows the performance of the cheapest 20% of the top 1000 U.S. stocks (“deep value”) against the next 30% (“shallow value”) for various time periods in the last 40 years. In the good old days for value – here the period 1983-2006 – the cheapest 20% of the market outperformed the rest of the value universe by 4% per year. In the decade after those good times ended, value underperformed modestly with both deep and shallow value underperforming the market by less than 1%. But in the value nightmare of 2017-2020, it was deep value that was the true disaster, underperforming the market by 7.5% per year, much more than twice as bad as the underperformance of shallow value.
Exhibit 8: Performance of Deep and Shallow Value
Data from January 1983 to September 2022 | Source: GMO
Deep value and shallow value are best 20% and next 30% of top 1000 U.S. stocks on GMO’s price/scale model. Performance is relative to top 1000 U.S. stocks.
By 2020, it had been well over a decade since owning deep value was of any help, and over the prior four years it had been an utter disaster. While a decade of disappointing performance followed by a few years of disastrous performance is enough to make most clients fire you, the extremely patient ones who do not at least tend to ask some pointed questions about what you have learned and how your process has changed given that performance. Whether you are a quantitative manager trying to discover a backtest that would have avoided the worst of the recent pain or a fundamental value manager trying to learn from recent mistakes the old-fashioned way, the obvious response would be to figure out some method to avoid deep value.
But I suspect that is the wrong response. While it may seem obvious that deep value stocks must have finally turned into the value traps that investors fear, a little deeper digging shows that wasn’t actually the case. Exhibit 9 shows the valuation of deep value and shallow value normalized by their median discount over the 1983-2022 period.
Exhibit 9: Valuation of Deep and Shallow Value
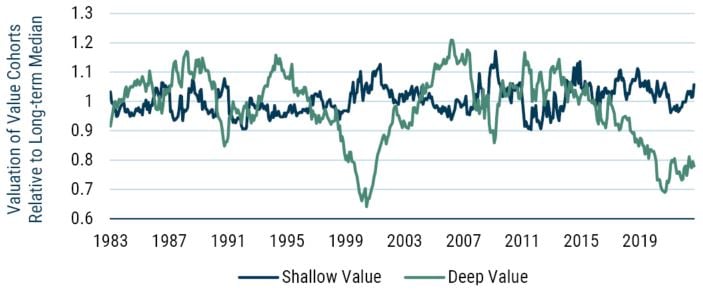
Data from January 1983 to September 2022 | Source: GMO
Deep value is cheapest 20% on GMO’s price/scale, shallow value is next 30%, both within top 1000 U.S. stocks by market capitalization. Valuation is normalized for whole period median relative valuation of each group.
Neither group was cheap versus history in the 2007-2016 period. Deep value was actually at its highest relative valuation in history at the end of 2006, whereas shallow value was just about at its median valuation. Over the next decade, deep value saw its valuation fall by 1.3%/year on average while shallow value saw its valuation rise by 0.4%/year. So, we redid Exhibit 8, looking at valuation-adjusted returns, and got results that look quite different, as can be seen in Exhibit 10.
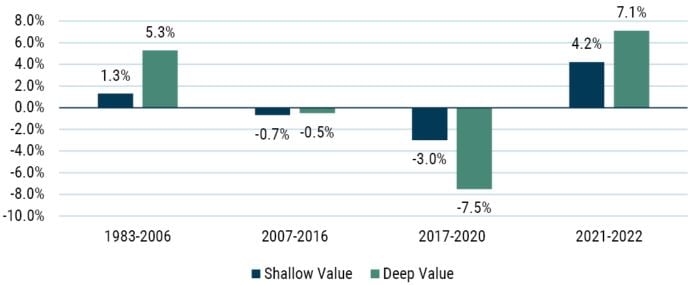
Exhibit 10: Valuation-Adjusted Performance of Deep and Shallow Value
Data from January 1983 to September 2022 | Source: GMO
Deep value and shallow value are best 20% and next 30% of top 1000 U.S. stocks on GMO’s price/scale model. Performance is relative to top 1000 U.S. stocks. Performance is adjusted for changes between the starting and ending valuations of the groups relative to top 1000 U.S. stocks.
This chart adjusts the returns of the groups (seen in Exhibit 8) by the change in the starting and ending valuations of those groups. Through this lens, we can see it wasn’t deep value that had a problem from 2007-2020. While performance was slightly worse for shallow value after adjusting for starting and ending valuations, deep value actually managed to hold its own during the long value nightmare. 6 As such, it is shallow value that has more explaining to do, as its valuation-adjusted performance was fairly negative in both legs of the growth era. It’s possible that shallow value’s troubles were temporary, as both deep and shallow value have done just fine in the last couple of years. But while the valuation-adjusted performance of deep value has certainly deteriorated from the glory days of 1983-2006 (at +1.1% per year since 2007, down from +4.3%), it returned a positive number in every period. If you combine that pretty decent fundamental performance with valuations today at the cheapest end of their history, you’re looking at a very compelling group of U.S. stocks to own. 7
For those concerned that the deep value group is a junky and undiversified group of stocks you would be terrified to hold, it isn’t, and this is true for a couple of different reasons. First, the basic pattern of deep value looking a lot cheaper than shallow value is robust to a surprisingly wide variety of different valuation measures, group construction methodologies, and weighting schemes. The version of value I’ve shown here is GMO’s price/scale model. You can think of that as a version of “standard value,” where we have tried to correct for accounting distortions that can make measures such as price/earnings and price/book misleading but where we are not otherwise trying to adjust for quality or future growth prospects. Table 3 shows the percentile rank versus history of the various ways of defining and weighting deep value in the U.S., where the 100th percentile would be the most expensive level in history and the 0th the cheapest. The three valuation models used span GMO’s techniques between simplest to most complex and forward-looking. 8
Table 3: Valuation Percentiles for Cheapest 20% of Top 1000 U.S. stocks on different measures and weightings of value
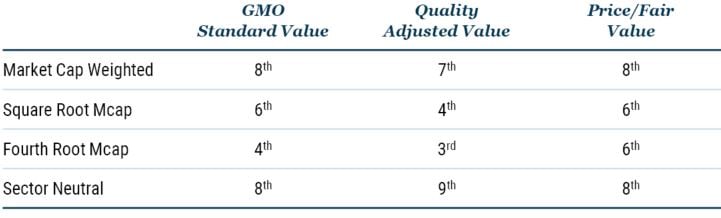
Data as of 9/30/2002 | Source: GMO
GMO Standard Value is GMO’s price/scale model, Quality Adjusted Value is price/scale adjusted for company quality, and Price/Fair Value is GMO’s dividend discount model.
The point of the table is that on a continuum of models and weighting schemes, we see a pretty uniform level of attractiveness for deep value. While the cheapest 20% of “standard value” portfolios do tend to be lower quality than the overall market, that is much less true for the other versions of value I’m showing; if you don’t want the sector biases that the raw deep value groups give you, you could build your group sector-neutral, thereby excluding them. For my part, while the sector-neutral version of the deepest value stocks is indeed trading at some of the largest-ever discounts to the overall market, allowing sector biases does not meaningfully increase the absolute risk of the group and makes the resulting group cheaper in absolute terms. As a result, I’m happy to allow a deep value portfolio a fair bit of leeway to take the sector biases a less processed value group naturally wants, and that is indeed what we are doing in the deep value portfolio (GMO U.S. Opportunistic Value Strategy) we are running for several clients today.
Download article here.
Specifically, Exhibit 2 weights stocks by the 4th root of their market capitalization within the top 1000 U.S. stocks by market capitalization. That effectively gives a nod toward larger cap names in deference to their higher liquidity and lower transaction costs but limits the weight of large stocks to a fraction of what they would be in a market cap weighted portfolio.
I’m showing a chart of the performance of value relative to growth instead of either value or growth relative to the market because the components of return are actually more stable for value relative to growth than either, relative to the market. In particular, rebalancing can get a bit weird when either value or growth is strongly outperforming, because when the value half of the market outperforms it “pushes out” the most expensive end of value into the growth universe as “old value” makes up more than 50% of the universe. When growth outperforms, we see a similar effect the other way, as the least expensive growth stocks get pushed into the value universe as growth expands beyond 50% of the market. Looking at value relative to growth, this effect is much less pronounced. Thanks very much to John Pease for explaining this effect to me and redoing the analysis as value versus growth.
There are a few other pieces of rebalancing, but they are fairly small. Within the growth universe, the very most expensive stocks are the most likely to dilute shareholders by issuing additional shares. When they do so, the weight of those stocks grows, making the growth universe a bit more biased toward the most expensive companies. IPOs also tend to be negative for the growth universe because companies generally go public at high valuations. Stock buybacks can also change the weight of stocks in the value and growth universes in a way unrelated to returns. Insofar as there is a bias for cheaper companies to do more buybacks, this can also drive a piece of rebalancing.
This doesn’t absolutely have to be the case. If the only stocks moving from value to growth or growth to value are the stocks just at the edges of the universe – a 51st percentile valuation stock going to 49th percentile or vice versa – the gap between the entries and exits could be quite small. Some months that is indeed what happens, which explains the dots right around the zero mark. But generally, a wider spread implies a wider gap.
The math is (gap size) x (migration probability) + other rebalancing effects. Those “other rebalancing effects” average 2-3% per year in favor of value. At a valuation spread of 1.0 that works out to 46% x 10.3% + 2-3% = ~7-8%.
I’ll admit this is something of an oversimplification. Because these are not static groups of stocks, in principle it would be ideal to do the kind of performance breakdown I did for value versus growth in the main body of the piece, building a rebalancing return from actual constituent changes. The trouble with doing things the “right” way is that the calculated rebalancing effect for groups as tightly defined as 20% of the market gets funky and a further series of adjustments is needed for less intuitive ways that the group shifts whenever its performance differs meaningfully from the market. For a group like the “next 30%” whose constituents are impacted not only by its own performance but the performance of the cheapest 20%, the math gets even funkier. This analysis is much more tractable and should give a broadly correct answer.
It is somewhat less compelling for investors who feel no obligation to own any U.S. stocks whatsoever. An equivalent value portfolio in any other region in the world is cheaper in absolute terms and positioned similarly relative to their regional universes.
From a simple diversification standpoint, it shouldn’t be much of a surprise that the cheapest 20% of a 1000 stock universe works out on average to be a little over 200 names for all of the weighting schemes and construction methodologies shown.
Disclaimer: The views expressed are the views of Ben Inker through the period ending November 2022, and are subject to change at any time based on market and other conditions. This is not an offer or solicitation for the purchase or sale of any security and should not be construed as such. References to specific securities and issuers are for illustrative purposes only and are not intended to be, and should not be interpreted as, recommendations to purchase or sell such securities.
Copyright © 2022 by GMO LLC. All rights reserved.
Specifically, Exhibit 2 weights stocks by the 4th root of their market capitalization within the top 1000 U.S. stocks by market capitalization. That effectively gives a nod toward larger cap names in deference to their higher liquidity and lower transaction costs but limits the weight of large stocks to a fraction of what they would be in a market cap weighted portfolio.
I’m showing a chart of the performance of value relative to growth instead of either value or growth relative to the market because the components of return are actually more stable for value relative to growth than either, relative to the market. In particular, rebalancing can get a bit weird when either value or growth is strongly outperforming, because when the value half of the market outperforms it “pushes out” the most expensive end of value into the growth universe as “old value” makes up more than 50% of the universe. When growth outperforms, we see a similar effect the other way, as the least expensive growth stocks get pushed into the value universe as growth expands beyond 50% of the market. Looking at value relative to growth, this effect is much less pronounced. Thanks very much to John Pease for explaining this effect to me and redoing the analysis as value versus growth.
There are a few other pieces of rebalancing, but they are fairly small. Within the growth universe, the very most expensive stocks are the most likely to dilute shareholders by issuing additional shares. When they do so, the weight of those stocks grows, making the growth universe a bit more biased toward the most expensive companies. IPOs also tend to be negative for the growth universe because companies generally go public at high valuations. Stock buybacks can also change the weight of stocks in the value and growth universes in a way unrelated to returns. Insofar as there is a bias for cheaper companies to do more buybacks, this can also drive a piece of rebalancing.
This doesn’t absolutely have to be the case. If the only stocks moving from value to growth or growth to value are the stocks just at the edges of the universe – a 51st percentile valuation stock going to 49th percentile or vice versa – the gap between the entries and exits could be quite small. Some months that is indeed what happens, which explains the dots right around the zero mark. But generally, a wider spread implies a wider gap.
The math is (gap size) x (migration probability) + other rebalancing effects. Those “other rebalancing effects” average 2-3% per year in favor of value. At a valuation spread of 1.0 that works out to 46% x 10.3% + 2-3% = ~7-8%.
I’ll admit this is something of an oversimplification. Because these are not static groups of stocks, in principle it would be ideal to do the kind of performance breakdown I did for value versus growth in the main body of the piece, building a rebalancing return from actual constituent changes. The trouble with doing things the “right” way is that the calculated rebalancing effect for groups as tightly defined as 20% of the market gets funky and a further series of adjustments is needed for less intuitive ways that the group shifts whenever its performance differs meaningfully from the market. For a group like the “next 30%” whose constituents are impacted not only by its own performance but the performance of the cheapest 20%, the math gets even funkier. This analysis is much more tractable and should give a broadly correct answer.
It is somewhat less compelling for investors who feel no obligation to own any U.S. stocks whatsoever. An equivalent value portfolio in any other region in the world is cheaper in absolute terms and positioned similarly relative to their regional universes.
From a simple diversification standpoint, it shouldn’t be much of a surprise that the cheapest 20% of a 1000 stock universe works out on average to be a little over 200 names for all of the weighting schemes and construction methodologies shown.