Executive Summary
In this paper we propose a novel approach to financing emerging countries’ transitions toward cleaner energy production. We believe a significant opportunity exists across two dimensions: greenhouse gas (GHG) emissions reduction and investment returns. Using insights from what in 2024 is thirty years of experience in emerging markets fixed income investing, our approach aims to facilitate the goal of energy transition that is consistent with sovereign net-zero commitments, while also offering attractive investment attributes relative to developed market (DM) fixed income analogs.
Introduction
Emerging market (EM) countries in aggregate contribute disproportionately to global GHG emissions because a substantial portion – approximately 80% – of the installed electricity generation capacity in these nations still relies on non-renewable, fossil fuel-based sources (coal, gas, and oil-based derivatives). To approach the net-zero goal of reducing global emissions by enough to prevent a temperature rise of more than 1.5 degrees Celsius, this non-renewable installed capacity needs to plummet to around 30% within the next 10 years. 1
The energy transition imperative arrives at a time when EM countries are still to varying degrees trying to catch up with their DM counterparts with respect to electrification. Chile, for example, is 50% of the way to renewable electrification currently, while South Africa has progressed less than 5%. In aggregate across EM, with growing populations, increased incomes, and electrification of mobility, an estimated 3,000 GW in capacity is already needed vs. a 1,500 GW installed capacity. Then, there is the need to “green” this 1,500 GW installed capacity. Altogether, this 4,500 GW demand, coupled with a $2.5 billion/GW estimated build cost, 2 translates to an $11 trillion funding need. So far, EM governments have only budgeted $4 trillion, resulting in a $7 trillion shortfall and thus leaving a significant role for the private sector to play in bridging the gap. 3
We believe a thoughtfully chosen investment universe can take investors a long way toward maximizing the energy transition impact of their allocation, therefore it’s important to understand the forces that drive the energy transition process from the top-down (sovereign) and the bottom-up (asset level). Globally, sovereigns influence companies' contributions to net-zero goals from the top-down through regulation. In emerging countries specifically, most of the net-zero agenda will be carried out by the state-owned enterprise (SOE) utilities and financial institutions, as well as privately sponsored corporations and projects with government contracts (a well-trodden risk-sharing framework better known in DM as “Public Private Partnership” or “PPP”). Thus, EM sovereigns wield tremendous influence on the overall EM energy transition.
Getting to net zero: The sovereign view
Exhibit 1: Global Energy Electricity Generation by Fuel Source 4
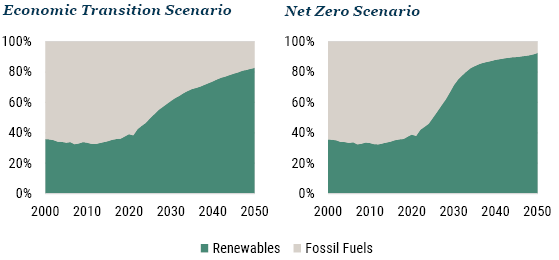
As of 2022 | Source: BloombergNEF
Exhibit 1 depicts the anticipated electricity generation across all EM sovereigns consistent with their net-zero plans. By 2050, an estimated 20% of the energy mix is still slated to originate from fossil fuel sources, reflecting the pragmatic nature of these transition strategies in a developing country context. Importantly, the current fossil fuel assets cannot be dismissed with regard to the dual objective of electrification and greening of the existing capacity, while also filling residual energy supply gaps left by renewable sources with intermittent generation profiles, thus ensuring grid stability. This is especially true considering the relatively low carbon footprint of these assets in practice, since by definition, “grid stability” assets are designated by the government and will operate on the basis of an availability-based power purchase agreement (PPA), turning on infrequently to burn their carbon-heavy fuel sources and essentially being paid for being on standby 80-90% of the time. Thus, an EM energy transition strategy should mimic the sovereign plan in adopting an "all-of-the-above" approach to investment universe inclusion, rather than eliminating fossil fuel assets altogether.
However, not all sectors possess equal potential for transition and impact. Sectors such as electric utilities stand a formidable chance of reshaping their enterprises into renewable entities. Conversely, entities like oil explorers, while they may enhance sustainable oil extraction practices, face greater challenges ahead. Fortunately, utilities, 40% of GHG in EM currently, can be transformed to hit their carbon neutral targets in the next three decades, 5 making them an ideal foundation for an investment universe. Our ongoing discussions with clients reveal that some investors favor sector-level diversification, while others are comfortable with sector-level concentration given the country-level diversification, a gift EM debt markets offer to us. An expanded universe would look at other sectors that have a heavy consumption carbon footprint and can plausibly transition in an economic way: transportation, infrastructure, and select commodities (e.g., metals and mining). We exclude oil and gas and coal mining because we find the technological viability of a meaningful transition to be low and the operations themselves contribute a relatively modest amount of GHG emissions (we believe that it is the consumption of their product by other sectors that generates the emissions). Financial institutions also play a role, providing investors with access to energy transition asset exposure in jurisdictions with limited availability of public or private investment opportunities.
Currently we estimate that there are just shy of $300 billion in investable public securities outstanding (see Exhibit 3), of which nearly 80% is investment grade. BB-rated issuers account for most of the rest and, as we will detail later, may see upward ratings bias. Further, private market exposure (direct lending) expands this opportunity set by at least a factor of 2x, by our rough estimates. With the $7 trillion funding gap cited earlier, it's clear to see how this is going to be a growing investment universe.
Exhibit 2: Assessing sectors for maximum energy transition impact
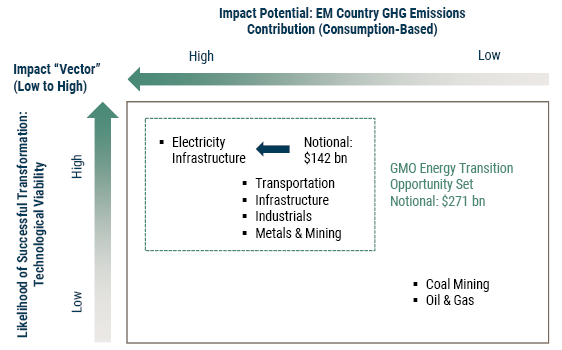
As of 2023 | Source: Moody’s
Measuring an EM energy transition strategy’s transition success
Given that we believe sovereign governments drive the investment universe, we also believe they are the correct “unit” to measure transition success (albeit not the optimum level at which to finance the transition from an impact lens). To illustrate, consider the following two SOEs:
- A state-contracted coal company, Mong Duong in Vietnam, that will forever be a coal company until it is phased out as part of the sovereign’s overall plan; and
- A state-owned oil and gas company, Ecopetrol in Colombia, that acquires ISA (Interconexion Electrica), an electricity transmission company, diversifying its business mix in a “green” direction.
Both SOEs ultimately report to the sovereign shareholder, and both play a role in their respective sovereign’s plan. All else equal, Mong Duong over time will contribute to the Vietnam’s net-zero plan as it is phased out, consistent with Exhibit 1. By contrast, Ecopetrol has not yet contributed to the sovereign’s net-zero plan; it has simply changed the corporate ownership of two SOEs.
Note that other investment strategies may take an entirely different view about these two companies. A coal generation plant would likely be considered uninvestable, either because of ESG restrictions or because it could be considered a “stranded asset” (an asset whose residual cash flows are insufficient to pay back capital providers in full). An SOE, on the other hand, given its government ownership or contracts and place in the overall net-zero plan, can be a good investment right up until the moment the lights are turned off with no stranded asset risk – this is an empirically proven phenomenon which underpins our investment thesis in these entities across many different sectors and countries in EM. 6
Ecopetrol, on the other hand, may see an improved ESG score given its new business mix, even though nothing relevant to the country’s net-zero plan has occurred. Measuring overall sovereign net-zero transition progress is misplaced, therefore, when judged at the company level and should therefore be done at the sovereign level.
The investment case (and the case for GMO’s proposed investment solution)
The EM debt energy transition investment universe is both a growing one and one with attractive investment attributes. We cite three:
- A net-of-loss spread pickup relative to developed market corporate alternatives across the credit spectrum, reflective of liquidity, complexity, and EM-specific exposures.
- The potential for active managers within the universe to harvest additional credit spread compression returns by identifying entities with unpriced energy transition plans. This requires thorough fundamental analysis and cannot be achieved using ESG or other scoring.
- A high credit quality, diversified opportunity set (investment grade on average) that allows asset owners to fund from their DM credit allocations with contained tracking error implications and a higher Sharpe ratio.
First, it's important to understand that EM corporates, including quasi-sovereigns and project finance/infrastructure, historically have displayed a lower default intensity and loss relative to DM corporates across the credit spectrum. Exhibit 3 walks through a comparison of the EM debt energy transition opportunity set vs. U.S. corporates across the credit spectrum, from AA to B rated. The table shows current spreads by ratings bucket, then an expected credit loss for each bucket. This expected credit loss uses historical credit transition experience and average recovery values from the rating agencies for the two universes (EM infrastructure vs. U.S. corporates). 7 Notice that across the ratings spectrum, spreads are higher in EM and expected losses are lower, resulting in the higher net-of-loss spreads seen in the last column. These range from 23-25 bps for AA/A rated, to 123 bps for BBB rated, to substantially higher for junk rated. Why is this? We note (1) structural and contractual enhancements of infrastructure credits (e.g., covenants, collateral, minimum revenue guarantees and contract termination compensation, etc.); and (2) contingent government support, mostly from IG-rated sovereigns, that over time has prevented idiosyncratic default incidence.
Exhibit 3: GMO Energy Transition Opportunity Set Properties vs. DM Alternatives
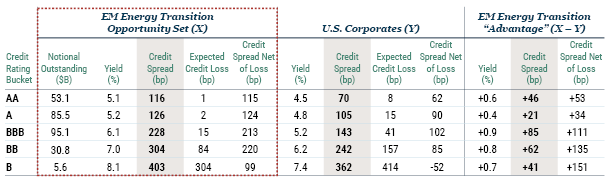
As of 1/31/2024 | Source: Bloomberg, S&P Ratings
Expected credit losses computed using S&P’s 2023 credit transition matrices. Cumulative default probabilities are annualized. 25% constant recovery assumption.
Second – the part we’re most excited about – is the opportunity to apply our time-tested investment process for quasi-sovereigns to generate excess returns in this arena. Our existing strategies in hard and local currency use quasi-sovereign exposures extensively for alpha. With significant assets, a deep understanding of these markets, and a 30-year track record, we are frequently advantaged in accessing the kinds of deals we prefer, which becomes even more important for bespoke private asset-level exposure which we routinely structure for our portfolios. Further, our quasi-sovereign corporate credit research integrates our sovereign team’s views, an important element given the need to understand SOEs in the context of their sovereign energy transition plans. For example, we recently met with an arm of the Indonesian government responsible for the country’s energy transition plans as part of their private sector outreach initiative and discussed the treatment of creditors in their fossil fuel phase-out process.
Finally, from an asset allocation perspective, tracking error for taking ratings-matched EM credit spread risk versus DM alternatives is manageable for traditional fixed income investors. To be clear, liquidity panics generally result in wider EM spreads relative to DM and can be meaningful sources of tracking error, but the impact is relatively small for traditionally oriented (i.e., 60/40-type) portfolios. Exhibit 4 shows the historical spread differential between the BBB-rated segments of J.P. Morgan’s CEMBI Broad Diversified (EM corporate and quasi-sovereign) and the Bloomberg U.S. Corporate indices. Outside of extreme, temporary events like the Global Financial Crisis or Covid-19 pandemic, a typical range is around 50 bps of relative spread movement. At a 5-year duration, this translates to a maximum mark-to-market underperformance of less than 2.5%. Historical Sharpe ratios of EM vs. DM IG corporate credit are 0.73 vs. 0.69, respectively. 8
Exhibit 4: EM vs. DM BBB-rated corporate credit spread
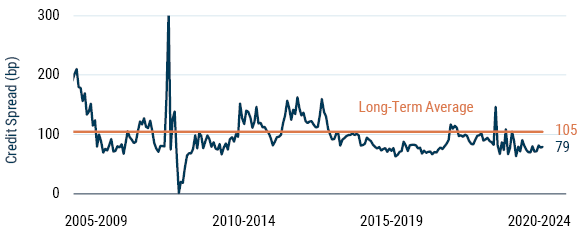
As of 1/31/2024 | Source: J.P. Morgan CEMBI Broad Diversified BBB Sub-Index, Bloomberg US Corporate BBB Sub-Index
The GMO edge
Our quasi-sovereign investment process evaluates issuers' stand-alone credit quality as well as the specific issue-level characteristics of each bond. As EM quasi-sovereign specialists, we also have extensive experience in evaluating the question of contingent sovereign support, which is crucial to understanding sovereign-linked energy transition credit.
Exhibit 5: GMO Quasi-Sovereign Investment Process
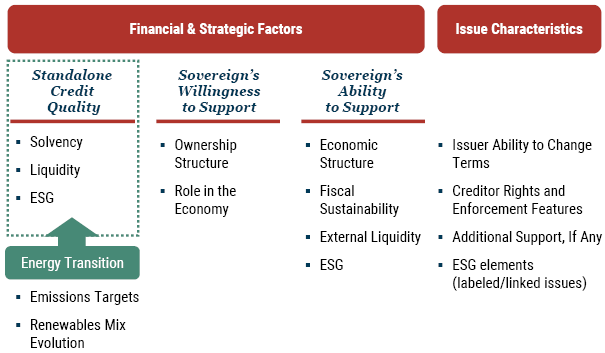
Source: GMO
For energy transition, the investment innovation is digging into the fundamentals of the energy transition plans of each issuer (which we have), then pricing those plans with respect to the market with the goal of outperforming the base energy transition investment universe (illustrated in Exhibit 7, where the red dot shows the average energy transition universe credit quality and spread). Our goal is to find issuers like CFE (Comisión Federal de Electricidad, a Mexican state-owned electricity utility) with underpriced energy transition plans, or even issuers like Paiton (an Indonesian thermal power plant with offtake agreements to the state), which has no plans at all given the nature of the asset, but has a persistently wide "fossil fuel discount" spread (something we estimate using our proprietary energy transition scoring process). Again, as a quasi-sovereign entity, 9 it can still be part of the overall sovereign plan.
Using our process, we can estimate how much transition potential could lead to credit quality improvement via the lowering of a company’s financial volatility. We can then compare this to the return expectations for the two companies. Clearly, from an investment point of view, a coal-fired asset with no transition plans shouldn’t benefit from the potential improvement upside relative to entities that have credible transition plans. Still, our process will guide us to finance such an asset if its expected total return potential (credit spread return in excess of expected credit losses) is attractive relative to the total return potential of a “greener” asset, after adjusting for the upside potential of its transition plans.
Exhibit 6: Energy transition impact on credit quality and valuations
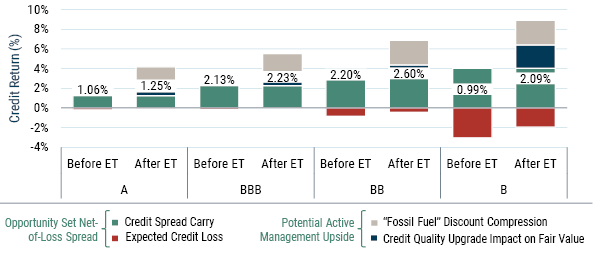
As of 1/31/2024 | Source: GMO, EM Corporate Credit Investment Proces
ET = Energy Transition. Credit return impact calculated by adjusting the average lives of each of the credit rating buckets to 5 years. Three-notch upgrade constrained by country ceilings. “Fossil Fuel” asset spread discount compression derived using GMO’s quasi-sovereign investment process and proprietary energy transition scores. Impact on expected credit losses based on S&P 2023 credit transition matrices.
Through our fundamental research over the years, we’ve cataloged the transition plans of ~150 issuers, identifying those that can traverse a similar credit uplift path and whose bonds don’t currently price this. It is through this additional fundamental work that we believe we can generate return beyond what's implied by the red dot universe characteristics (which once again is itself offering a pickup to DM alternatives).
Exhibit 7: Energy transition impact on credit quality and valuations
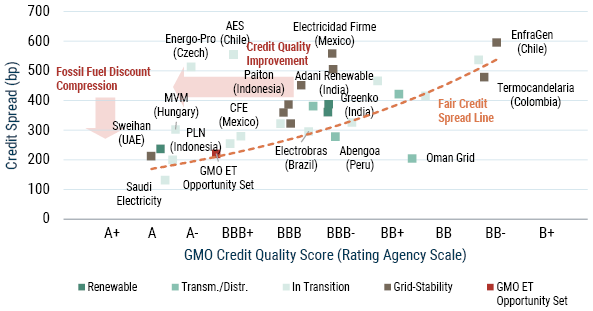
As of 1/31/2024 | Source: GMO, EM Corporate Credit Investment Process
Selected issuers from GMO’s energy transition opportunity set. Fair credit spread line is informed by GMO’s quasi-sovereign investment process. Vertical axis represents 5-year average life credit spreads, derived from the observed credit spreads of the closest maturity instrument for each issuer and adjusted using average observed credit curve extensions for a given credit quality bucket. Horizontal axis represents the aggregation of fundamental scores from GMO’s quasi-sovereign process, translated into the rating agency letter grade scale.
We believe our process offers clear advantages to ESG investing, where investors frequently construct portfolios based on ESG ratings and off-the-shelf scores produced by varying (and frequently inconsistent) data providers (e.g., Sustainalytics, MSCI, Reprisk, Trucost, etc.). For example, J.P. Morgan’s JESG CEMBI Broad Diversified Utilities Sub-Index is a good proxy for the mainstream approach to impact investing. The sub-index covers only half as many issuers as GMO’s energy transition opportunity set. Our observations, drawn from rich experience in emerging market debt investing, highlight the broad and often unclear remit of ESG ratings. ESG ratings aim to achieve (or measure) too many, sometimes incompatible goals simultaneously. The diverse interpretations of ESG can lead to conflicting perspectives on where the focus should be as it relates to the environment. Consequently, ESG ratings play a limited role in facilitating energy transition. And, where they do play a role, ESG ratings lead to diluted outcomes. 10
Conclusion
Funding energy transition in emerging countries is imperative for reducing global GHG emissions and we believe meaningful global progress is impossible without the participation of private capital. The investment needs are enormous, and the market is growing. The energy transition theme offers a broad public and private debt investment universe and therefore the ability to tailor to ratings, liquidity and diversification constraints. The investment universe exhibits attractive investment properties on its own merit and relative to a traditional fixed income allocation. To outperform in this universe, we believe investors will need to seek active EM debt managers with a strong track record and a skillset that integrates fundamental corporate and sovereign credit analysis.
Download article here.
IEA, "Financing Clean Energy Transitions in Emerging and Developing Economies" (June 2021); The World Bank, "Scaling Up to Phase Down: Financing Energy Transitions in the Power Sector" (April 2023).
This estimate excludes the cost of decommissioning legacy fossil fuel assets and the construction of supporting infrastructure, such as transmission lines and storage.
IFC, "Private Credit in Emerging Markets," EM Compass (January 2021).
BloombergNEF, New Energy Outlook 2022. Economic Transition scenario is BloombergNEF's proprietary forecast, which captures a less aggressive decarbonization glidepath relative to net zero: “The Economic Transition Scenario is our baseline assessment of how the energy transition might evolve from today as a result of cost-based technology changes.”
BloombergNEF, New Energy Outlook 2022; Moody's, Carbon Transition Assessment (September 2023); Moody's, "Carbon Transition – Global: Utilities improve positioning for rapid transition; other high-risk sectors have not," Sector In-Depth (November 2023).
For more detail on our EM SOE credit investment thesis, see The Mystery of SOE Debt: A Unique and Growing Opportunity (Sobolev and Ulukan 2020).
This is the same method we use to generate an expected credit loss for the EMBIG Diversified, published regularly in our EMD Quarterly Valuation Update, the technical appendix of which is available upon request.
Source: J.P. Morgan, Bloomberg. 22-year history, annualized total return divided by annualized standard deviation of total return. J.P. Morgan EMBI Global Diversified IG Sub-Index, Bloomberg IG-rated US Corporate Sub-Index.
As our regular readers and investors will recognize, we consider private companies with substantial government contracts “SOEs” in our alpha programs.
For GMO’s work on integrating ESG factors into the investment process, see EM Corporate Debt ESG Integration: An Alpha-Oriented Approach (Sobolev and Ulukan 2022) and Sovereign ESG Integration: An Alpha-Oriented Approach for Emerging Debt (Aghdasi 2021).
Disclaimer: The views expressed are the views of Sergey Sobolev and Mustafa Ulukan through the period ending March 2024, and are subject to change at any time based on market and other conditions. This is not an offer or solicitation for the purchase or sale of any security and should not be construed as such. References to specific securities and issuers are for illustrative purposes only and are not intended to be, and should not be interpreted as, recommendations to purchase or sell such securities.
Copyright © 2024 by GMO LLC. All rights reserved.
IEA, "Financing Clean Energy Transitions in Emerging and Developing Economies" (June 2021); The World Bank, "Scaling Up to Phase Down: Financing Energy Transitions in the Power Sector" (April 2023).
This estimate excludes the cost of decommissioning legacy fossil fuel assets and the construction of supporting infrastructure, such as transmission lines and storage.
IFC, "Private Credit in Emerging Markets," EM Compass (January 2021).
BloombergNEF, New Energy Outlook 2022. Economic Transition scenario is BloombergNEF's proprietary forecast, which captures a less aggressive decarbonization glidepath relative to net zero: “The Economic Transition Scenario is our baseline assessment of how the energy transition might evolve from today as a result of cost-based technology changes.”
BloombergNEF, New Energy Outlook 2022; Moody's, Carbon Transition Assessment (September 2023); Moody's, "Carbon Transition – Global: Utilities improve positioning for rapid transition; other high-risk sectors have not," Sector In-Depth (November 2023).
For more detail on our EM SOE credit investment thesis, see The Mystery of SOE Debt: A Unique and Growing Opportunity (Sobolev and Ulukan 2020).
This is the same method we use to generate an expected credit loss for the EMBIG Diversified, published regularly in our EMD Quarterly Valuation Update, the technical appendix of which is available upon request.
Source: J.P. Morgan, Bloomberg. 22-year history, annualized total return divided by annualized standard deviation of total return. J.P. Morgan EMBI Global Diversified IG Sub-Index, Bloomberg IG-rated US Corporate Sub-Index.
As our regular readers and investors will recognize, we consider private companies with substantial government contracts “SOEs” in our alpha programs.
For GMO’s work on integrating ESG factors into the investment process, see EM Corporate Debt ESG Integration: An Alpha-Oriented Approach (Sobolev and Ulukan 2022) and Sovereign ESG Integration: An Alpha-Oriented Approach for Emerging Debt (Aghdasi 2021).