Executive Summary
Ever since our first corporate bond purchase in 1996, the GMO Emerging Country Debt team has taken some ESG-related factors into account in our risk assessment process. We follow a systematic investment process generally focused on quasi-sovereigns – state-owned enterprises and other government-owned or controlled enterprises – which holistically syncs with our team’s sovereign debt research and security selection efforts. Last year, the team integrated a comprehensive set of ESG factors into our sovereign risk assessment framework. 1 Since then, we have turned our attention to quasi-sovereigns and corporates. After much analysis, we have concluded that integrating a proprietary set of ESG risk factors can improve the predictive power of our corporate credit investment process, and therefore should be more explicitly considered in assessing default risk rather than simply serving as signals of our normative values and priorities.
In this paper, we review the implicit role that ESG has traditionally played in our process and then discuss how we have more formally integrated it. We recognize that incorporating ESG metrics into our investment process will evolve with ongoing research and deepening insight. At this point, however, we believe we have taken an important step in validating ESG as part of our quality assessment.
Introduction
The term ESG (for Environmental, Social, and Governance) refers to a broad range of qualitative and quantitative considerations that relate to the sustainability of an organization. While this broad definition is straightforward on its surface, it implies different things to different people. To us as emerging market debt investors, it means extending the quality factor in our risk framework to assess the quasi-sovereign and corporate default risk of emerging market credits. Over the past two years, we have endeavored to determine if and how we should expand our use of ESG in our process. What we have concluded is that an ESG-enhanced framework continues to be statistically significant in gauging credit risk and that the overall goodness of fit of our model and the individual Standalone Credit Quality pillar within our investment process have both moderately improved after integrating ESG more explicitly.
Accounting for ESG before It Was Called “ESG”
The aim of the GMO Emerging Country Debt team’s risk assessment process has always been to identify which credits appear “expensive” or “cheap” relative to both their respective sovereigns and to other companies in our opportunity set. We have traditionally approached this task by distilling carefully chosen fundamental variables into four main “pillar” scores – Standalone Credit Quality, Sovereign’s Willingness to Support, Sovereign’s Ability to Support, and Issue Characteristics – each of which is used as a final input toward establishing a single score for credit quality.
We then translate our quasi-sovereign and emerging market corporate research output into an analogous format to that of our sovereign team, as shown in Exhibit 1. Each dot represents a company. The dots above the line imply they are cheap given their fundamentals, and the dots below the line imply they are expensive.
EXHIBIT 1: COMPARING SPREADS TO OUR OWN ESTIMATES OF CORPORATE RISK VIA OUR TRADITIONAL APPROACH
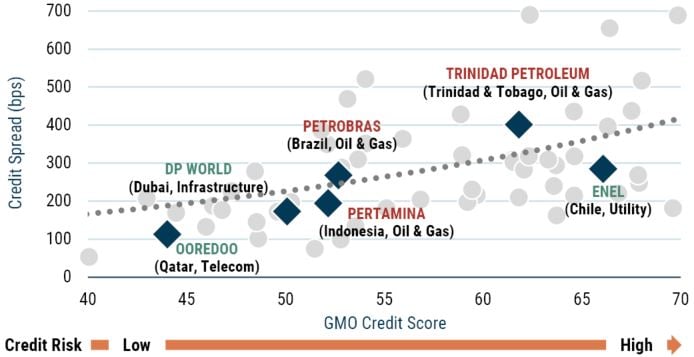
Data as of June 30, 2022 | Source: GMO
Illustrative example of a corporate fair value regression using 5-year average life points on the respective credit curves.
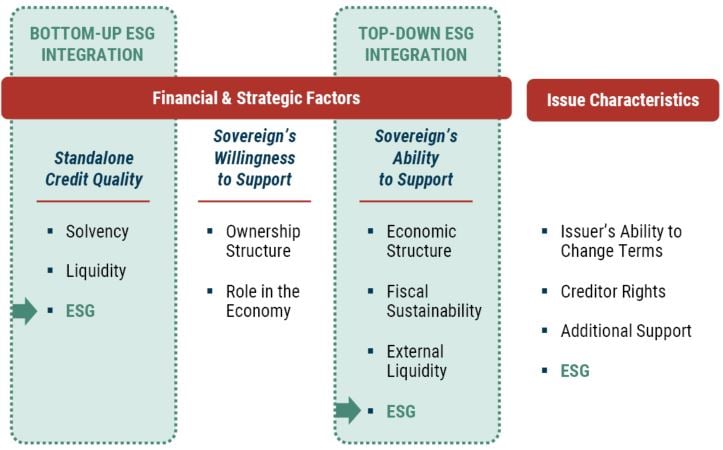
Up to this point, we have systematically embedded some factors that today are associated with ESG in three of the four pillars of our process, as shown in Exhibit 2.
EXHIBIT 2: OUR CORPORATE CREDIT INVESTMENT PROCESS BEFORE THE ESG INTEGRATION
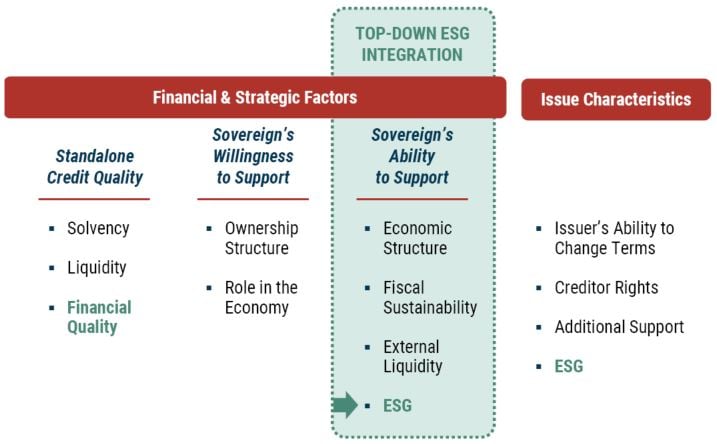
Source: GMO
The green box highlights that our process already accounted for the top-down impact of a country’s ESG risk factors on the credit quality of corporates within that country by incorporating our sovereign team’s ESG-integrated analysis in our Sovereign’s Ability to Support pillar.
- Standalone Credit Quality pillar: Our quasi-sovereign and corporate credit risk assessment process employs two key measures under the Standalone Credit Quality pillar – industry benchmarking and the issuer’s track record – that have significant overlap with Environmental and Governance risks (see Exhibit 7). Industry benchmarking against global peers assesses a business’s cyclicality, which in turn helps us determine a borrower’s financial limit. Typically, a company engaged in extractive industries has less borrowing capacity than a utility-like business with more predictable cash flows. The issuer’s track record, on the other hand, can help us identify well-managed companies with stable empirical credit ratios that correlate well with timely fulfillment of debt obligations. This measure has been a good proxy for the Governance category. Of course, all businesses are affected by external factors that they cannot control, so our track record analysis aims to parse external sources of volatility from more idiosyncratic internal factors.
- Sovereign’s Ability to Support pillar: Because our corporate and ESG-integrated sovereign research is fully in sync, our quasi-sovereign and corporate process benefits from our sovereign-related ESG risk assessment. Broadly speaking, the higher the ESG-related risks in a given country, the higher we set our hurdle rate for the residing corporates.
- Issue Characteristics pillar: Within the Issue Characteristics pillar, our documentation review to assess our rights as creditors has implications for the Governance category as well.
These factors have had varying degrees of impact on our views on the fundamental quality of a business.
ESG-related Challenges to Quasi-Sovereign and Corporate Risk Analysis
As we have conducted research into expanding ESG in our process, we have drawn many insights. Before we turn to our results, we would like to highlight three challenges we have discovered that we believe are notable.
- Link to Credit Returns. ESG risks have been material, but not overwhelming. We find that so far, Governance factors have proven to carry the highest level of capital impairment risk, followed by Environmental and Social factors. In our analysis to this point, however, none have shown conclusive predictive power for standalone credit quality or credit return in a buy-and-hold setting. Nor has there been repeatable excess return for positive ESG factors. For example, J.P. Morgan’s ESG-flavored indices have not performed better than their flagship sovereign and corporate peers with similar asset quality, as Exhibit 3 demonstrates.
2
Altogether, we find that Governance and Social factors are loosely correlated with sovereign spreads and Environmental factors are loosely correlated with sector spreads.
EXHIBIT 3: HISTORICAL TOTAL RETURNS OF J.P. MORGAN’S “ESG-AWARE” AND CONVENTIONAL EM DEBT INDICES
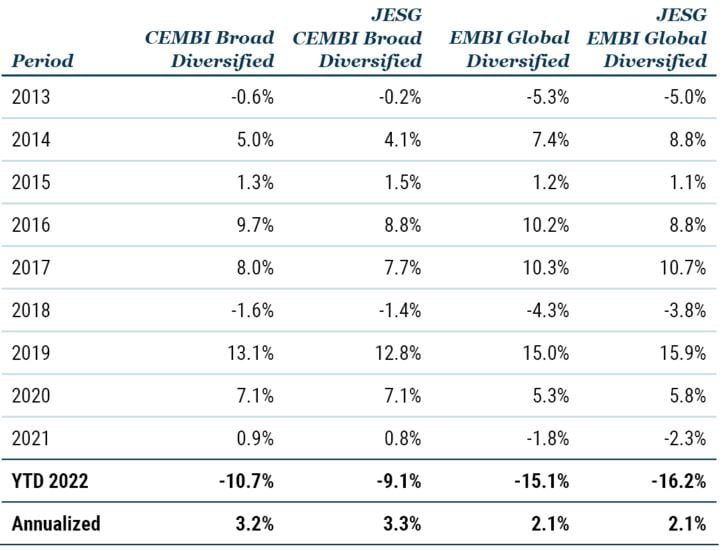
Data as of June 30, 2022 | Source: J.P. Morgan
- Data Quality. EM corporate ESG reporting, where available, is incomplete and not standardized, and data often needs to be inferred from multiple sources. 3 Certain ESG risks are hard to accurately measure as they rely on adaptive and dynamic behavior as firms and sovereigns respond to shifting technology and regulatory environments in real time.
- Asymmetry of ESG Risks. ESG risks, like crises, can exhibit low frequency but high severity outcomes. On balance, not accounting for ESG risks worsens one’s winning odds on the margin because the cost of underestimating ESG risks will cause more harm to investor portfolios than overestimating ESG risks. By way of example, emerging countries are in the very early stages of decommissioning fossil fuel-based energy generation and transitioning their energy mix toward greener, more sustainable forms. This is reflected in green and sustainability-linked bond issuance (Exhibit 4). 4 Social and Governance factors, which can similarly exhibit low frequency but high severity outcomes, have also caught some wind in investors’ processes.
EXHIBIT 4: EM CORPORATE GREEN AND SUSTAINABILITY-LINKED BOND ISSUANCE*
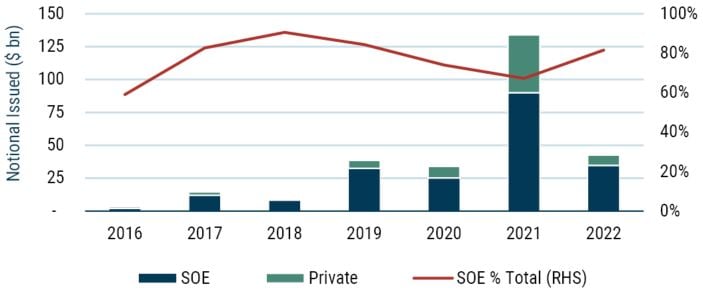
Data as of June 30, 2022 | Source: Bloomberg
*SOE bar represents directly state-owned or otherwise state-linked enterprises
Our Approach to Integrating ESG as a Factor in Our Risk Assessment Process
To incorporate systematic ESG risk factors in our investment process with the aim of alpha generation while overcoming the challenges mentioned above, we have adopted the same three core principles developed by our sovereign debt colleagues:
- Continuity. Our strong preference has been to keep the infrastructure of our existing process intact, enhancing it with more granular ESG analysis. Until now, we have drawn top-down ESG insights from the Sovereign’s Ability to Support pillar. This project has enabled us to achieve a more holistic assessment of ESG risks in corporate credit by measuring the bottom-up impact of a fully fledged set of E, S, and G factors within an expanded “Financial Quality” module in our Standalone Credit Quality pillar.
- Relevance. While there is no shortage of ESG metrics and data vendors in the marketplace, our list of factors is rather modest, which is the outcome of a deliberate and strict selection process grounded in seeking factors with quantifiable and predictable transmission channels into a credit’s standalone ability to pay back its debt. One of our priorities has been to establish our own framework for rolling up ESG-related data into proprietary aggregated scores rather than relying on pre-packaged third-party metrics. This strategy allows us to focus on what is knowable and trackable and leverages our bottom-up fundamental and empirical research insights in this space.
- Performance. We view ESG factors within a cost-of-capital construct. Our approach penalizes bad actors while rewarding the good, relative to our opportunity set. We emphasize improving the goodness of the fit between our fundamental inputs and market spreads to determine factor weights and the overall impact of ESG, which was capped at the equivalent of three rating agency notches.
Overall, the three principles – continuity, relevance, and performance – have increased the ESG-related factor assessment in our quality score to inform our Standalone Credit Quality pillar. 5 Our bottom-up, company-specific ESG score teases out complementary but non-overlapping credit risk factors already captured in the top-down Sovereign’s Ability to Support pillar (Exhibit 5), reducing already low top-down/bottom-up correlations still further and moderately reinforcing the explanatory power and forecasting utility of our Standalone Credit Quality pillar. This allows us to incorporate ESG-driven credit risks for all the credits in our opportunity set, running the gamut of companies that are fully government-owned to companies with no government ownership or influence.
EXHIBIT 5: FUNDAMENTAL FACTOR CORRELATIONS*
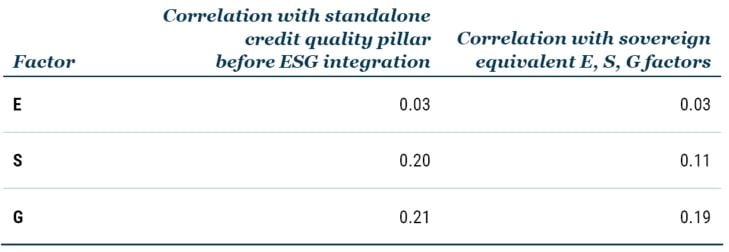
Data as of June 30, 2022 | Source: GMO
*Comparison of the rank correlations between sovereign E, S and G scores and the respective country weighted-averages of corporate E, S and G scores, where the weights are based on the principal value of the corporate bond stock outstanding.
EXHIBIT 6: OUR CORPORATE CREDIT INVESTMENT PROCESS AFTER THE ESG INTEGRATION
Source: GMO
Applying ESG to Credit Analysis
A review of one of the elements of our Standalone Credit Quality pillar – financial quality – shows how incorporating ESG factors can enrich our analysis (Exhibit 7).
EXHIBIT 7: EXTENDING FINANCIAL QUALITY TO A FULL SUITE OF CORPORATE ESG RISK METRICS
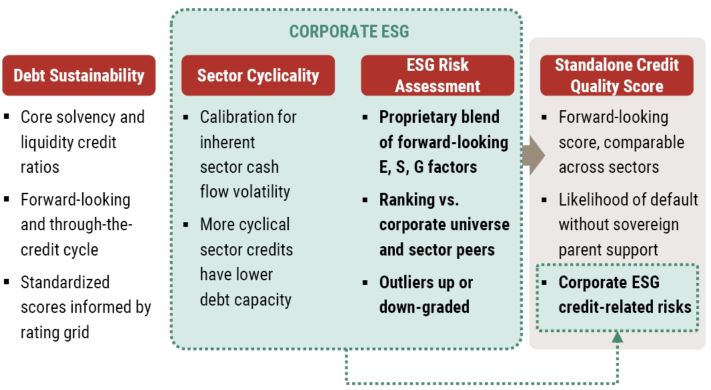
Source: GMO
For intuition behind our proprietary scores, see exhibit 8. Environmental risks refer to risks arising from the Energy Transition, the Physical Climate, and what we term “Bad Actor” Behavior. The Energy Transition subfactor broadly evaluates a company’s exposure to obsolescence as we migrate to a cleaner energy future and how effective the company’s efforts are mitigating that threat. The Physical Climate Change subfactor explores the extent to which a company’s assets or its future cash generation capabilities are at risk due to the effects of a changing climate. Bad Actor Behavior captures actions that have quantifiable repercussions for a company in the form of fines, taxes, and/or capital expenditures to penalize or remediate substandard practice.
Under the Social category, with the help of a few broad inputs, we aim to tease out how well a company treats its employees as poor treatment can be disruptive to the business (for example, revenue lost due to a labor union strike).
Under Governance, we measure a company through the financial prism of our time-tested quality score, the same way as before.
As the final step, we aggregate the separate Environmental, Social, and Governance scores to generate a comprehensive ESG score.
EXHIBIT 8: DISTILLING A LARGE UNIVERSE OF ESG METRICS BASED ON TANGIBLE LINKS TO CAPITAL IMPAIRMENT RISK
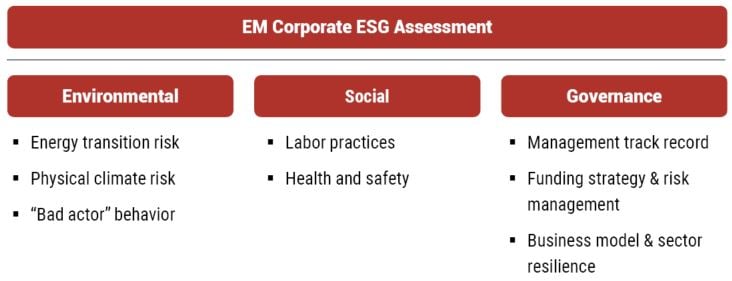
Source: GMO
Results of Our Bolstered ESG-Integrated Approach
We measure the effectiveness of our ESG-enhanced approach by comparing it to our legacy process both statistically and fundamentally. This is important, particularly given the data limitations and the asymmetric nature of ESG risk that we have discussed, and as a measure of our ability to leverage proprietary and forward-looking assessments of those risks.
In the ESG-enhanced framework, all four pillars continue to have statistical significance – that is, the market places material importance on each pillar in its pricing of credit risk. In addition, both the overall goodness of fit of our model and the statistical significance of the Standalone Credit Quality pillar have moderately improved where we have integrated ESG. For companies with fewer government links (and therefore a lower likelihood of government bailout), the incremental improvements in the goodness of fit grew stronger (Exhibit 9). This may be because the market recognizes that these companies rely more on their own ability to service debt while newly measured ESG factors help to identify the risks of non-payment.
EXHIBIT 9: INTEGRATION OF ESG FACTORS IMPROVED THE EXPLANATORY POWER OF OUR CORPORATE CREDIT PROCESS
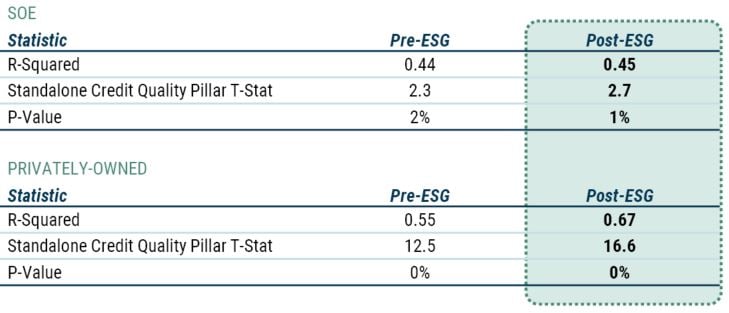
Data as of June 30, 2022 | Source: GMO
SOE regression number of observations is 84. Privately-owned corporates regression number of observations is 181.
Exhibit 10 offers a more intuitive depiction of the improvement in the goodness of fit of our model which is manifested in the tightening of the residuals across most of the observations in the data set (i.e., the integration of ESG risk factors in the Standalone Credit Quality pillar moved the dots closer to the fair value line). This result means we have been successful in capturing incremental credit risks we weren’t systematically looking at before, thus helping us to avoid "value traps" and become better alpha managers in this space.
Environmental factors, largely explained by the operating environment or the sector, display some significant differentiation. For example, oil & gas companies are at a much higher risk of business model obsolescence than agricultural producers. 6 Within the broadly defined oil & gas sector, nuances remain. The risks increase with a higher carbon footprint (e.g., extracting natural gas is less risky than extracting oil from oil sands). Companies with lower lifting costs are more resilient to lower crude prices in the future and can more easily afford stronger mitigation efforts in the form of business resilience and diversification. On the other hand, Social and Governance factors tend to correlate with local and regional economic development.
While ESG factors will have a bigger impact on our active portfolio decisions going forward, we expect negligible portfolio turnover to result. Our portfolio credits have been impacted by the equivalent of one to three rating agency notches across the board. Exhibit 10 shows what that translates into in terms of Standalone Credit Quality and our assessment of the impact on the fair value credit spread for selected corporates. Depending on the starting Standalone Credit Quality, some of the fundamental changes may jump out as rather large, however we would note two points: First, estimate changes pertain to a single pillar, Standalone Credit Quality. Ultimately, the all-in estimate of corporate credit quality takes all four pillars into account so that the impact of any single pillar is muted. Second, our investment process places a strong security selection emphasis on alpha generation, which means that we may (or may not) buy an issue even if we receive an opposing signal from our credit research.
EXHIBIT 10: IMPACT OF ESG INTEGRATION ON CREDIT FUNDAMENTALS AND ESTIMATES OF FAIR VALUE CREDIT SPREAD FOR SELECTED CREDITS
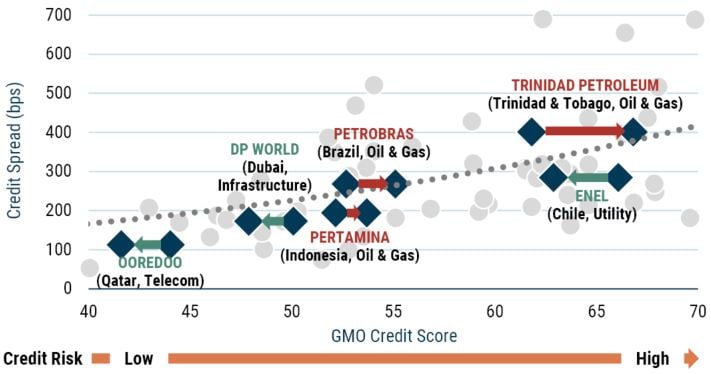
Data as of June 30, 2022 | Source: GMO
Illustrative example of a corporate fair value regression using 5-year average life points on the respective credit curves.
The Way Forward
We view our newly enhanced ESG methodology as an important step in incorporating ESG more explicitly as a systematic risk factor in our emerging market corporate investment process, even as we recognize that quantifying ESG risks is a new and rapidly evolving area of research. Clearly these risks will evolve over time and in response to unknowable technological and regulatory innovations. By building a process that is flexible and focuses on the materiality of subfactors, we believe our process can adapt to these changes as they occur. Take carbon intensity under the “Energy Transition Risk” subfactor, for example. If a global carbon tax regime is introduced and enforced in the future, we can quickly home in on the emissions metrics and raise the hurdle rate for portfolio inclusion. Our work here has just begun!
Download article here.
Our sovereign team integrated ESG into their process in 2021, as detailed in “Sovereign ESG Integration: An Alpha-Oriented Approach for Emerging Debt,” by Eamon Aghdasi (March 2021).
Indistinguishable “top-line” returns are only part of the story. Portfolio turnover is another. J.P. Morgan’s ESG indices on average turned over their portfolios 44 and 71 percent more frequently than their flagship sovereign and corporate indices, respectively. This means an unreported capital impairment of 13 bps and 31 bps in the form of transaction costs for those following the sovereign and corporate ESG indices, respectively. We say unreported because indices do not charge themselves these real-world costs when reporting their “top-line” returns.
Take the Guiding Principles on Business and Human Rights set by the United Nationals as an example. These commendable principles are clearly laid out, but there is little agreement in how the qualified ESG data providers interpret them. For example, of the 25 companies with UNGC violation interpretation, there is only a staggering sum of one company that all three mainstream providers agree is a violator. It appears that barring a catastrophic dam collapse leading to tragic human loss, vendors disagree with each other.
We look at the volume of these instruments as a good proxy for the capital investments deployed toward energy transition and sustainability goals since they have clearly earmarked and audited uses of proceeds.
We recognize that transitioning to a more sustainable energy future may shift a sovereign parent’s strategic and commercial priorities with respect to its quasi-sovereigns over time. In other words, ESG factors may have a material impact on which companies are provided with extraordinary government support. For now, however, we have an insufficient set of observations for a rigorous analytical conclusion.
With real estate, we are assuming that there will continue to be plenty of us in the world and new homes will continue to be built under all actionable states of the world.
Disclaimer: The views expressed are the views of Sergey Sobolev and Mustafa Ulukan hrough the period ending December 2022, and are subject to change at any time based on market and other conditions. This is not an offer or solicitation for the purchase or sale of any security and should not be construed as such. References to specific securities and issuers are for illustrative purposes only and are not intended to be, and should not be interpreted as, recommendations to purchase or sell such securities.
Copyright © 2022 by GMO LLC. All rights reserved.
Our sovereign team integrated ESG into their process in 2021, as detailed in “Sovereign ESG Integration: An Alpha-Oriented Approach for Emerging Debt,” by Eamon Aghdasi (March 2021).
Indistinguishable “top-line” returns are only part of the story. Portfolio turnover is another. J.P. Morgan’s ESG indices on average turned over their portfolios 44 and 71 percent more frequently than their flagship sovereign and corporate indices, respectively. This means an unreported capital impairment of 13 bps and 31 bps in the form of transaction costs for those following the sovereign and corporate ESG indices, respectively. We say unreported because indices do not charge themselves these real-world costs when reporting their “top-line” returns.
Take the Guiding Principles on Business and Human Rights set by the United Nationals as an example. These commendable principles are clearly laid out, but there is little agreement in how the qualified ESG data providers interpret them. For example, of the 25 companies with UNGC violation interpretation, there is only a staggering sum of one company that all three mainstream providers agree is a violator. It appears that barring a catastrophic dam collapse leading to tragic human loss, vendors disagree with each other.
We look at the volume of these instruments as a good proxy for the capital investments deployed toward energy transition and sustainability goals since they have clearly earmarked and audited uses of proceeds.
We recognize that transitioning to a more sustainable energy future may shift a sovereign parent’s strategic and commercial priorities with respect to its quasi-sovereigns over time. In other words, ESG factors may have a material impact on which companies are provided with extraordinary government support. For now, however, we have an insufficient set of observations for a rigorous analytical conclusion.
With real estate, we are assuming that there will continue to be plenty of us in the world and new homes will continue to be built under all actionable states of the world.