
Listen to this Insight
While the traditional 60/40 stock–bond portfolio has delivered strong long‑term results, its success has been highly valuation‑dependent and has included multiple “lost decades” following periods of elevated asset prices.
Thanks to strong gains in markets over recent years, the 60/40 default portfolio has quietly morphed into a bundle of expensive U.S. growth equities and credit exposures offering narrow spreads over Treasuries.
In our view, such a portfolio is likely to disappoint investors by delivering low single-digit real returns. A valuation‑sensitive, dynamic, and more globally diversified approach is likely a better way to manage risk and improve outcomes going forward.
More Than Two Decades of Dynamic Asset Allocation Experience at Work
GMO’s Benchmark-Free Allocation Strategy is a valuation-sensitive strategy that dynamically allocates across and within multiple asset classes. It aims to deliver positive returns over inflation and better risk-adjusted returns relative to a traditional 60/40 portfolio in the long run. By avoiding expensive assets and capitalizing on undervalued opportunities, Benchmark-Free has helped investors enhance risk-adjusted returns and navigate various market cycles with greater resilience since its inception in 2001.
Valuation-Sensitive Investing Has Delivered Attractive Long-Term Results
Benchmark-Free Allocation Strategy Since Inception*
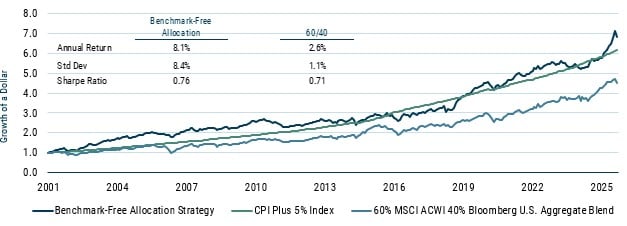
Performance as of March 31, 2026 (Net of Fees)

As of 3/31/26 | Source: GMO
*Inception date: 7/31/2001
Echoes of the Past as We Look Ahead
In many ways, the investment landscape today looks eerily similar to 1999, when we first began talking to clients about the portfolio concept that became the Benchmark-Free Allocation Strategy. At that time, the 60/40 portfolio had just come off 14 years of making 11.4% nominal (8% over inflation) per annum, the S&P 500 was trouncing both small caps and international indices, and valuations for growth stocks were higher than ever.
At the time, we believed that a traditional 60/40 portfolio was priced to deliver about 2% real return over the next decade, far below the level investors seek for the long run. We did, however, note that not everything was overpriced and there were ways to earn decent returns. Indeed, there were a lot of attractively priced assets back then, but to have an overall portfolio with a decent expected return, what you needed to be willing to own didn't look much like the traditional 60/40. Back in 1999, we thought that if you were willing to take the risk of looking different, the return for doing so would be incredibly high.
We’re seeing that again today. It's another time when the 60/40 has done very well for a long period. It's another time when the S&P 500 and particularly growth stocks have been the assets to beat for many years. The outperformance of U.S. over non-U.S. stocks (despite some reversal in 2025) and growth over value within the U.S., as well as the narrowing of credit spreads, has left us in a position where we still find many assets worth owning. And once again, taking advantage of those opportunities requires a willingness to look quite different than a standard, capitalization-weighted 60/40 portfolio.
Today, we believe that leaning away from expensive U.S. growth stocks and very tight credit assets and into attractively priced non-U.S. stocks and value will help generate higher compounded returns than a traditional passive portfolio. The current environment is marked by high valuations and significant change across many dimensions: economic policies (tariffs create business uncertainty and cloud the inflation outlook), geopolitical evolution (realignment of the post-WWII neoliberal order, hot wars, etc.), and a technological platform shift (AI). U.S. equities, and growth stocks in particular, are expensive and not priced for change. They’re priced for extrapolation: the extrapolation of recently strong fundamental returns far into the future. There are two things we know about fast-growing expensive stocks: 1) at some point, growth slows down (due to the law of large numbers, competition, etc.), and 2) when growth fails to meet aggressive expectations, premium valuation multiples get hit.
How Does GMO Benchmark-Free Fit in a Portfolio?
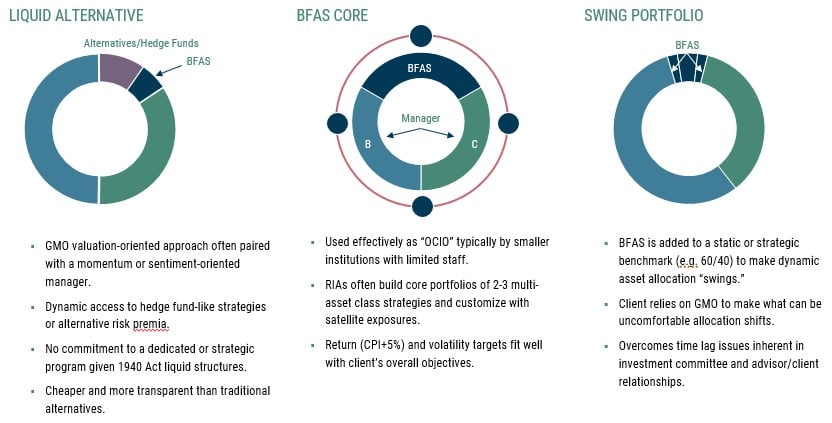
Through its valuation-sensitive approach, the GMO Benchmark-Free Allocation Strategy has historically acted as a helpful diversifier to traditional portfolios with risk concentrated primarily in market-cap-based equity exposures. Benchmark-Free is utilized by clients in three primary ways:
- as part of a dedicated alternatives program (often within a global tactical allocation sub-allocation) providing dynamic access to hedge-fund-like strategies without a fixed allocation;
- as a "core" holding managing a significant portion of an overall portfolio, aligning with the core mission of generating real returns within a specific volatility band; or
- in a "swing" or "opportunistic" manner, allowing clients to make dynamic asset allocation shifts indirectly, which is particularly valuable in volatile markets.
Regardless of how it is used, Benchmark-Free provides flexibility, dynamic management, and defensive characteristics, making it an effective diversifier and valuable component of client portfolios.
GMO Benchmark-Free's Fit within a Portfolio
Benchmark-Free (BF) is used in a variety of ways in client portfolios and investment processes
Source: GMO
We invite you to take a deeper dive into this topic and read the full paper, "A Second Opinion on the 60/40 Default, Just What the Doctor Ordered" in its entirety.