Listen to Part 1 of the Quarterly Letter
Executive Summary
While most institutional investors recognize that private equity and public equity share similar economic risks, they often seem to ignore how their aggregate equity portfolio is affected by their substantial allocation to private equity. Analyzing 700 private equity leveraged buyouts over the last 45 years allowed us to compare a meaningful proportion of private equity portfolios to their public equity counterparts.
Relative to public equities, private equity skews small and lower quality, and has a massive bet on software—all of which make a portfolio with a significant private equity allocation riskier and less well diversified from an industry- and factor-perspective versus the overall equity universe. Investors committed to substantial private equity portfolios should consider mitigating those biases in their public equity allocation with both long and short positions.
Those positions could be in passive index form, but we believe a more effective and higher-returning approach would be a levered long position in large-cap, high-quality public equities paired with a short position in smaller-cap, low-quality public equities. This takes advantage of the fact that within public equities, low-quality small caps tend to perform poorly over time, particularly in difficult economic circumstances.
Read Part 2 of the Quarterly Letter, Letter to the Investment Committee on Private Equity: The Persistent Dream of Performance Persistence, in which Ben Inker addresses the erosion of private equity performance persistence and its implications for institutions with meaningful private equity exposure.
Introduction
When the economy suffers, so too do stocks. This is both obvious—it would be bizarre for even a diversified set of companies to thrive at a time when people and businesses are demanding and consuming less—and somehow, easy to forget. This fugue is particularly prevalent in the private corners of the U.S. equity market, where years of strong performance, coupled with occasionally stale marks, have erased the idea of “true downside.”
Concerns about private equity today center on illiquidity: the inability of many sponsors to offer distributions at the same rate as they have in the past. But the true downside for private stocks—much as with their public counterparts—is insolvency. With private equity portfolios looking ever more concentrated on a small set of risks, investors in these portfolios look more vulnerable to certain types of economic shocks than they ever have.
We say this reasonably confidently because over the past few months we have collected, cleaned, and analyzed data—God bless LLMs 1 —for roughly 700 formerly listed developed-market companies that were taken private via a leveraged buyout from 1981 to 2025, including the likes of RJR Nabisco, Hospital Corporation of America (twice!), and TXU. Given that LBOs represent roughly 80% of the capital deployed by private equity funds, 2 this data helps us understand what the companies in PE portfolios look like.
Our sample is not entirely representative of the buyout space (the average public-to-private LBO is much larger than its private-to-private counterpart), but it is a substantial portion of it, covering 10–30% of the dollar value in global buyout activity over most years (Exhibit 1). Arguably, our sample should also be similar on other traits, like profitability and valuation, assuming sponsors choose rationally between the companies they can possibly purchase and considering that a company’s listed status is irrelevant for how much it can add in value to stakeholders. 3
Exhibit 1: Public-to-Private LBO Share of Total LBO Deal Value
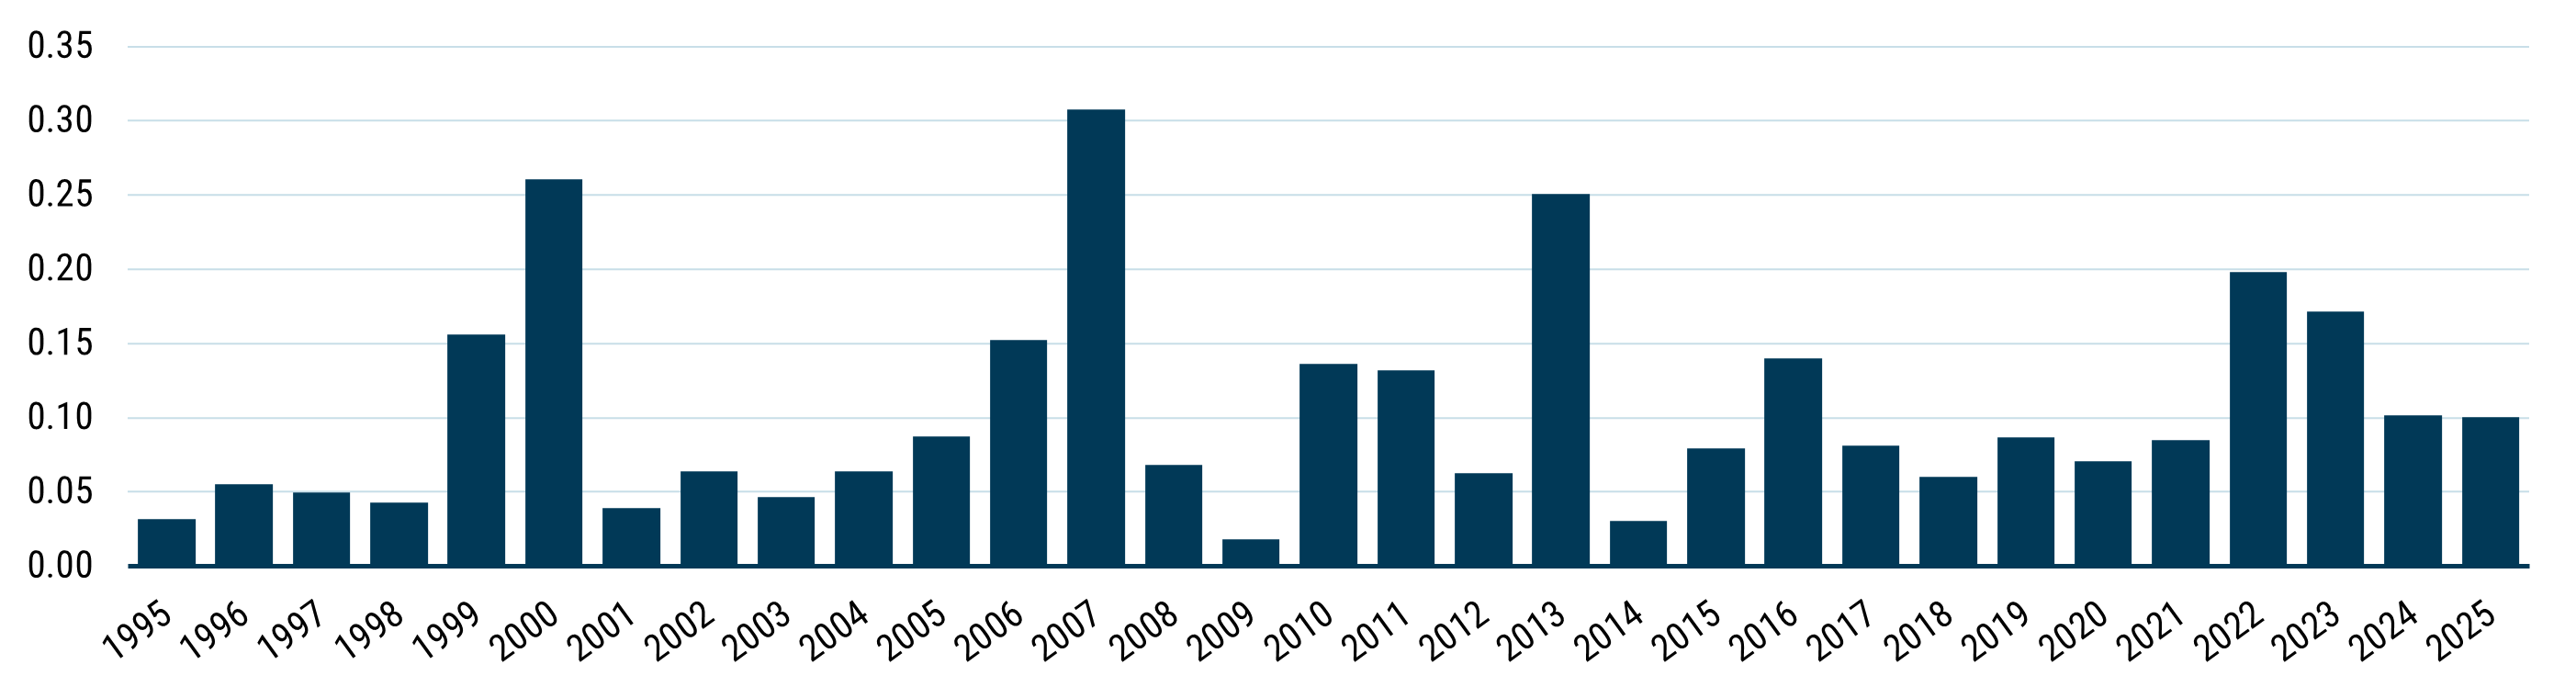
As of 12/31/2025 | Source: GMO, Bain/Dealogic
Our initial goal for this letter was to use this data to explain how private equity portfolios have changed over time. The story the data tells is more interesting than we expected, however, so we will therefore cover three things: first, as originally intended, we show how PE companies have evolved from a fundamental point of view; second, we describe how PE portfolios have become more concentrated from a risk perspective; and third, we discuss what allocators with a meaningful slug of private equity in their portfolios can do to mitigate the higher concentration of risks therein.
What’s in the Box?
It is odd that the standard depiction of buyout targets is of small, unleveraged, profitable, and cheap companies with a secular growth tailwind. While such companies do exist, they are far from the typical players that come to mind when LBOs are mentioned. RJR Nabisco was an expensive purchase when contrasted with its peers; Toys"R"Us was leveraged to the hilt even before its leveraged purchase in 2005; Hilton was running razor-thin net margins when it was acquired despite being contrasted against its low-margin industry. In fact, these companies were all over the map on leverage, profitability, and valuations versus comparable 4 businesses at the same point in time (Exhibit 2).
Exhibit 2: Selected LBO Characteristics Relative to Matched Peers
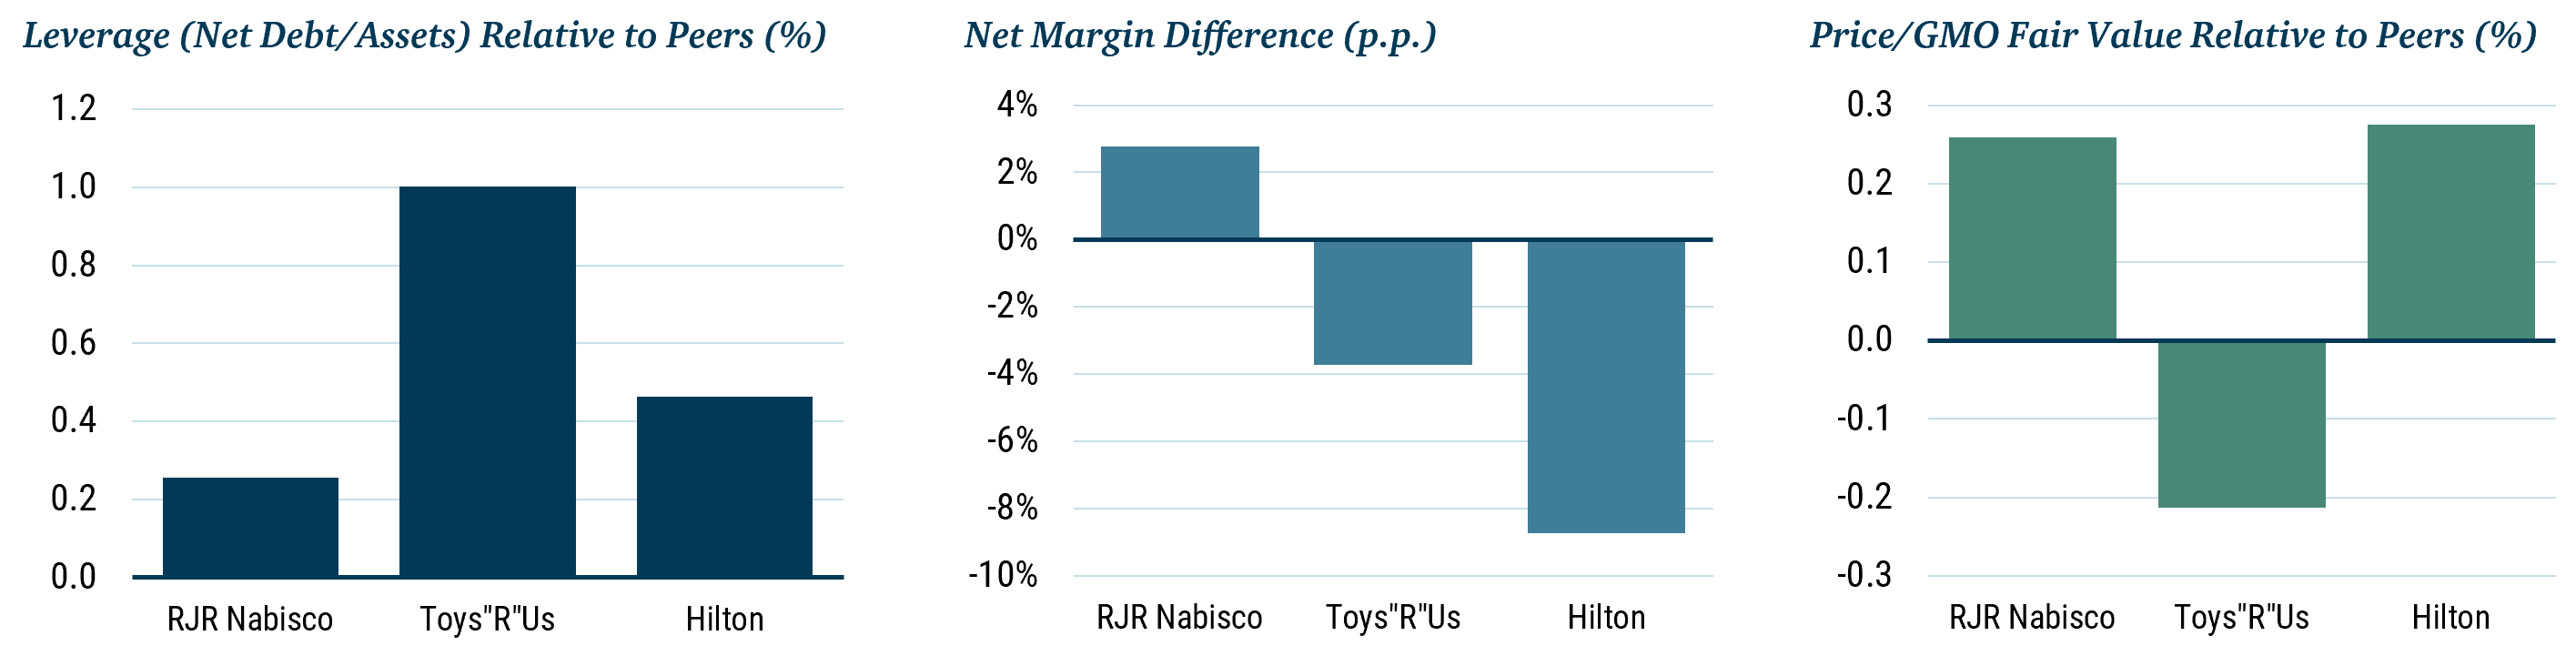
As of 12/31/2025 | Source: GMO, MSCI, Bloomberg, Compustat, Worldscope
Looking through a wider lens, the only thing about the buyout industry that is consistent over time is its focus on small caps. In our entire dataset, only RJR Nabisco was among the top 100 companies by size at the time of its purchase. Indeed, only about 5% of the companies were among the top 500 by market cap, and fewer than 15% were within the top 1,000. The remaining 85% were either small caps or, smaller still, veritable microcaps. If anything, our data overstates the size of LBOs (Exhibit 3), given it is easier to capture data on larger buyouts, especially pre-2000, and public-to-private transactions skew larger than private-to-private ones.
Exhibit 3: Public-to-private LBO Rolling 5-Year Size Category Composition
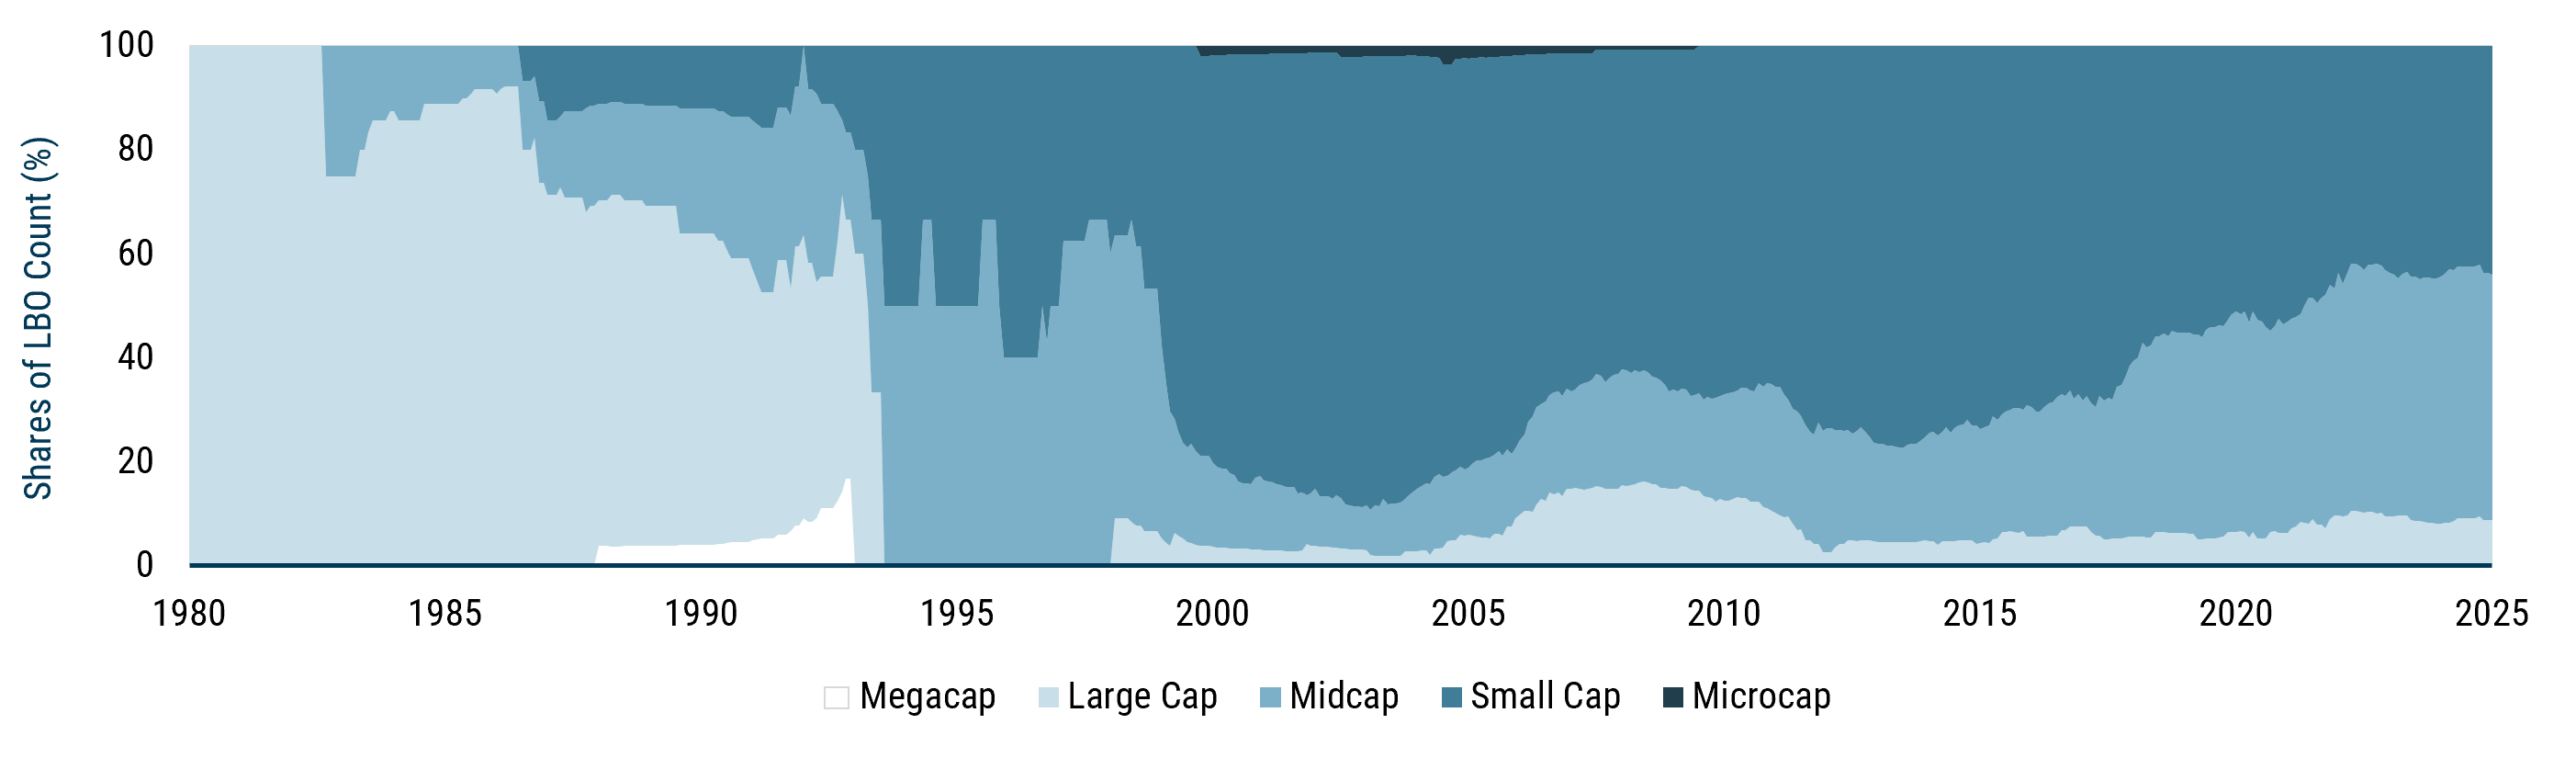
As of 12/31/2025 | Source: GMO, MSCI, Bloomberg
It is not uncommon to read commentary from buyout sponsors arguing that this small bias makes private equity a diversifier, especially when considering that 85% of investable companies 5 are private. 6 Their reasoning is two-fold: public markets skew larger and are therefore more concentrated, while private markets skew smaller and thus have a broader opportunity set. 7 While these two statements are factual, the implication that they make private equity a diversifier is wrong.
Consider a simplified model of reality in which each company is exposed to only two risks: the business cycle, which we’ll assume affects every company, and management, which we’ll declare to be a firm-specific risk. Even if, for any individual company, management contributes twice as much to overall risk as the business cycle, a portfolio of companies exposed to different management teams quickly ceases to have any meaningful risk beyond their exposure to the economy. By the time the portfolio has 100 companies at roughly equal weight, “specific” risk becomes a rounding error.
The reason behind this is that the idiosyncratic gains and losses that befall a specific business are, by definition, not shared. If you have one company, such idiosyncrasies have nothing to cancel them out; if you have 100, the lucky and unlucky will mostly cancel, and the experience of the portfolio will simply be that of owning an average business. Expanding a portfolio from 100 to 10,000 companies, in this simplified world, gives you negligible diversification gains (Exhibit 4). 8
Exhibit 4: Specific Risk Vanishes with Diversification
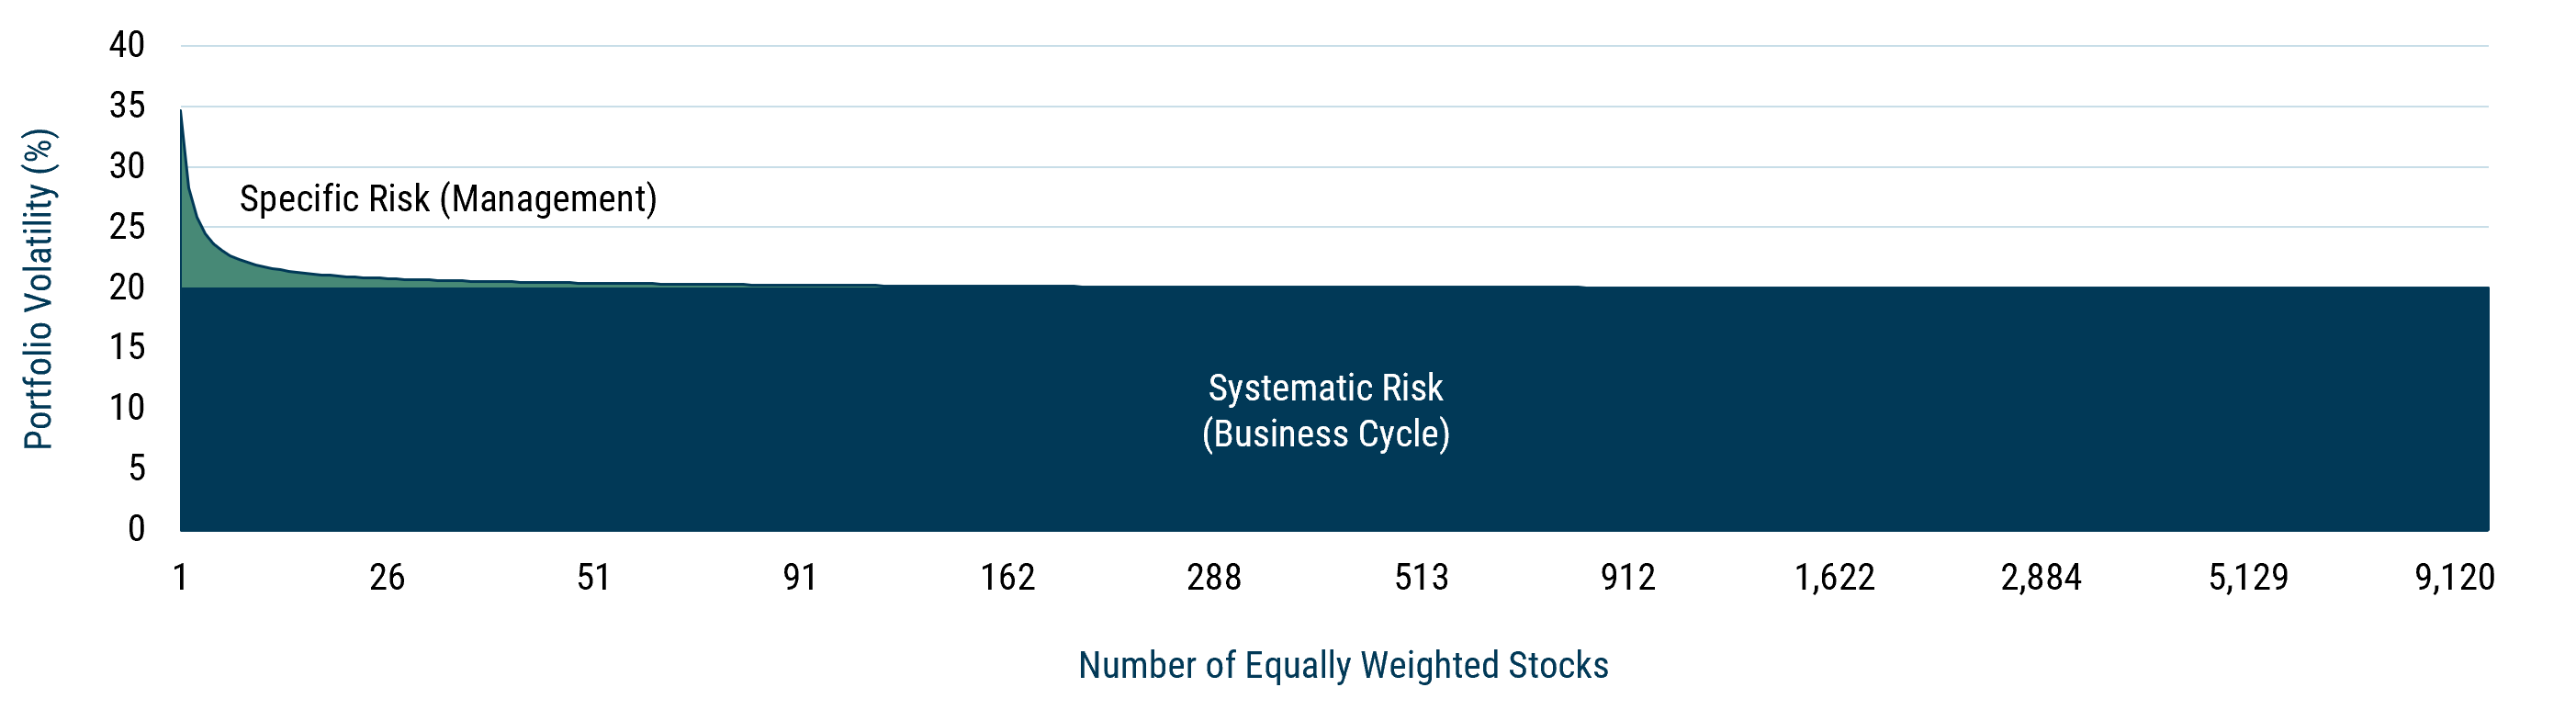
Source: GMO
The real world is, of course, messier than our simplified model. Businesses that share certain characteristics—leverage, low profitability, a similar industry makeup—have outcomes that are fundamentally more correlated than what is implied by a “business-cycle-only” model. And this is where the argument for private equity as a diversifier is at its weakest. If you owned the entire PE complex to be maximally diversified, you would just end up holding a big basket of small caps.
Not only have small caps seldom been a lower-quality group of businesses than they are today, but the buyout space is lower-quality still. If we rank companies from 0–10 on a composite of profitability, the stability of profitability, and leverage (what we call “Quality”), public-to-private LBOs rank a full quality decile below small caps, who in turn are almost four deciles junkier than the S&P 500 (Exhibit 5).
Exhibit 5: GMO Quality Score
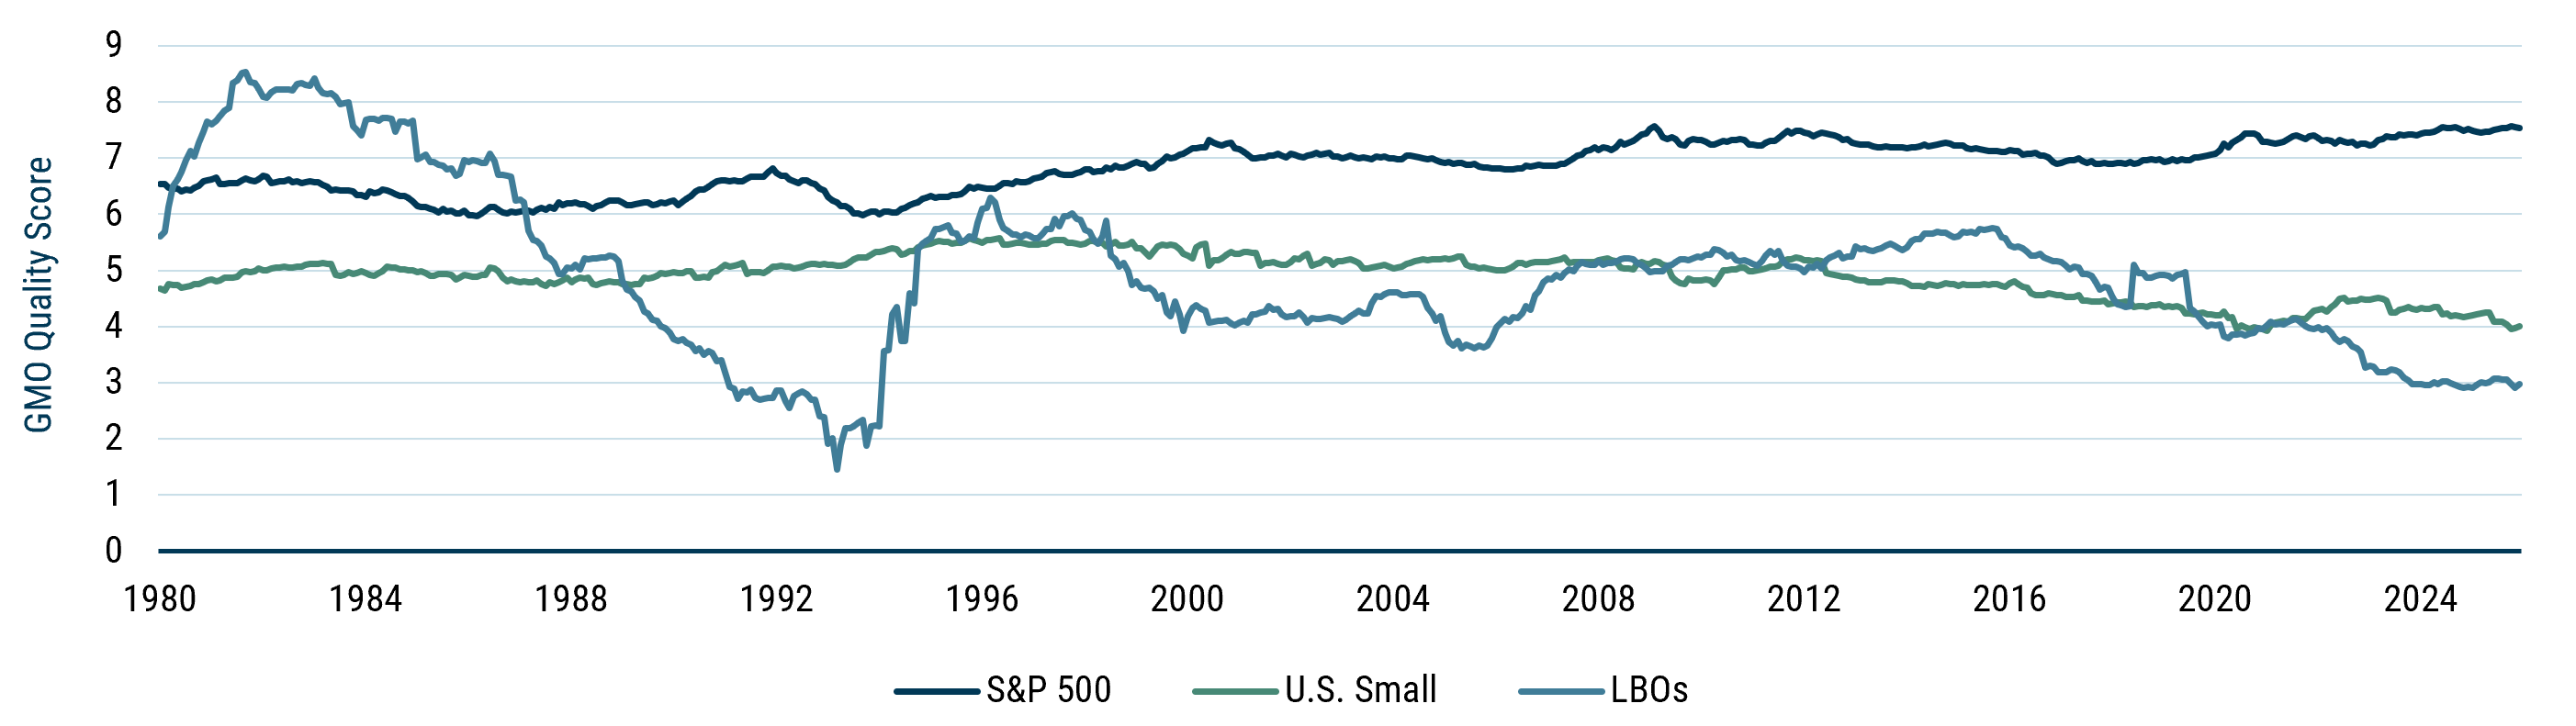
As of 12/31/2025 | Source: GMO, MSCI, Bloomberg, Compustat, Worldscope
The problem with low-quality stocks is that they are more susceptible to adverse economic shocks. A company that is unprofitable and leveraged requires external financing—equity or debt issuance—to pay the bills in normal times. In periods of economic distress, raising capital can be significantly more expensive (or even impossible), and low-quality companies can be forced to write down large parts of their businesses to stave off bankruptcy.
If we rank companies by their quality score right before two nasty economic events—the GFC and Covid—and look at their subsequent five-year performance, we can see that low-quality businesses are far less likely to generate positive returns versus their high-quality counterparts.
Exhibit 6: Share of U.S. Stocks with Positive 5-Year Returns
After December 2007
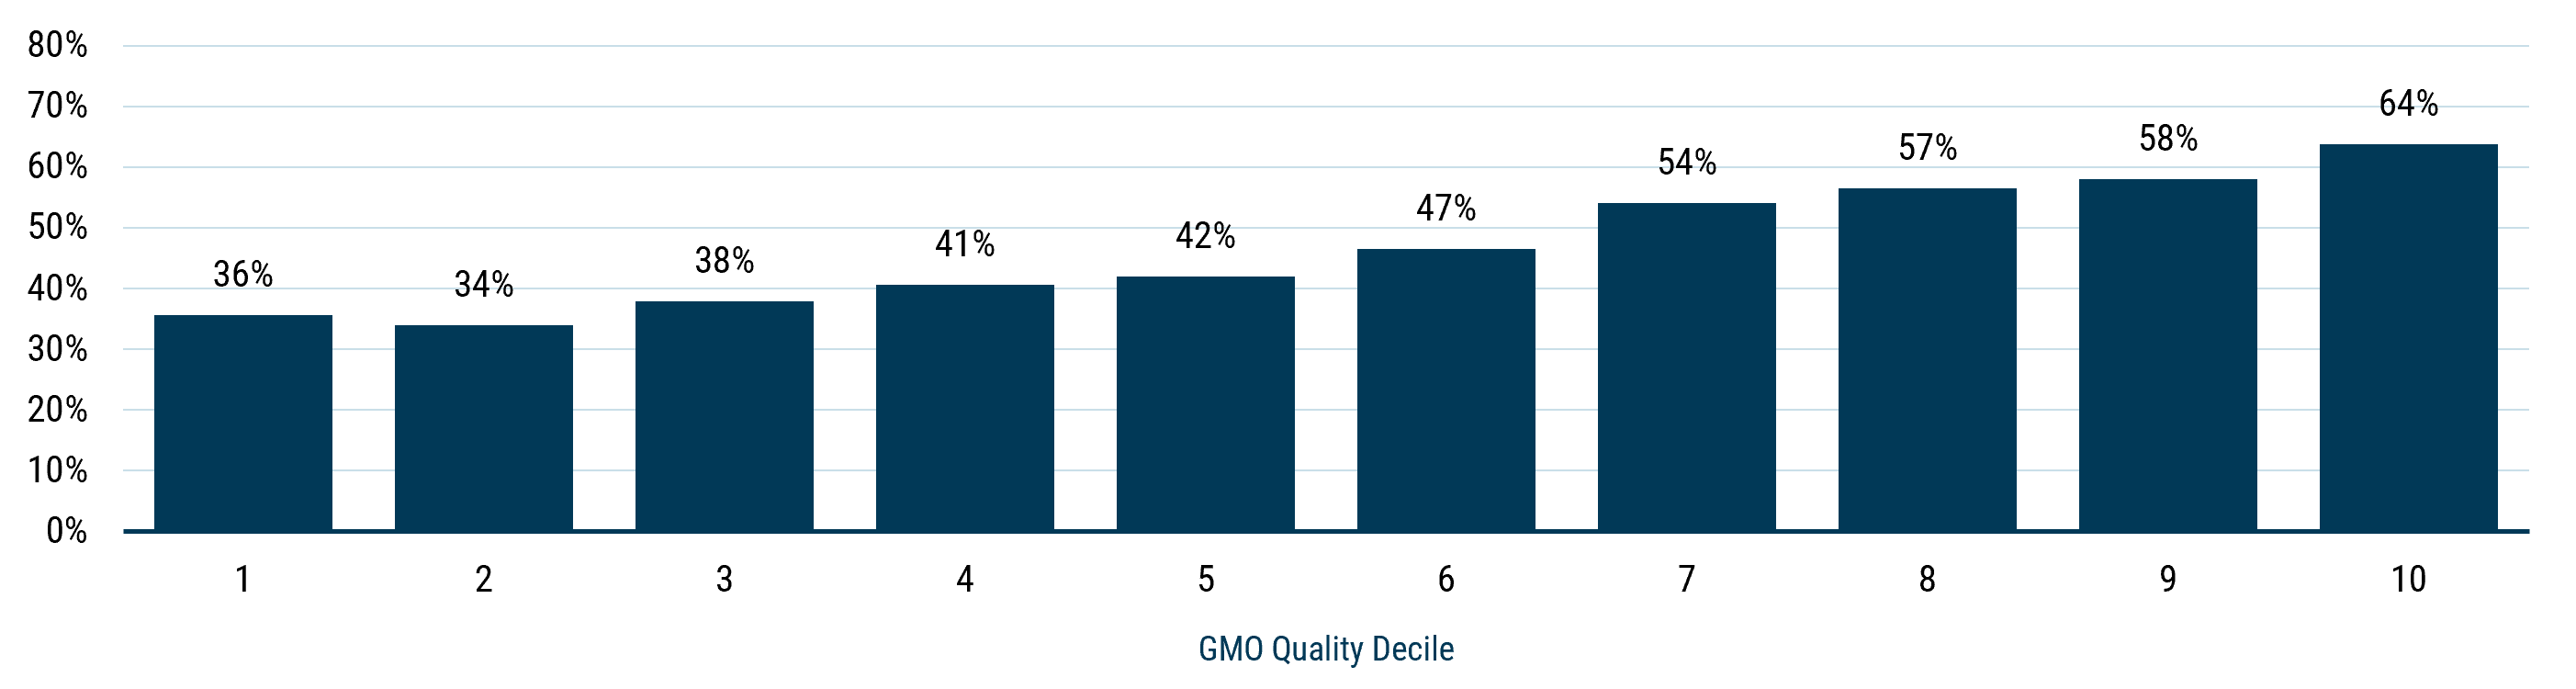
After December 2019
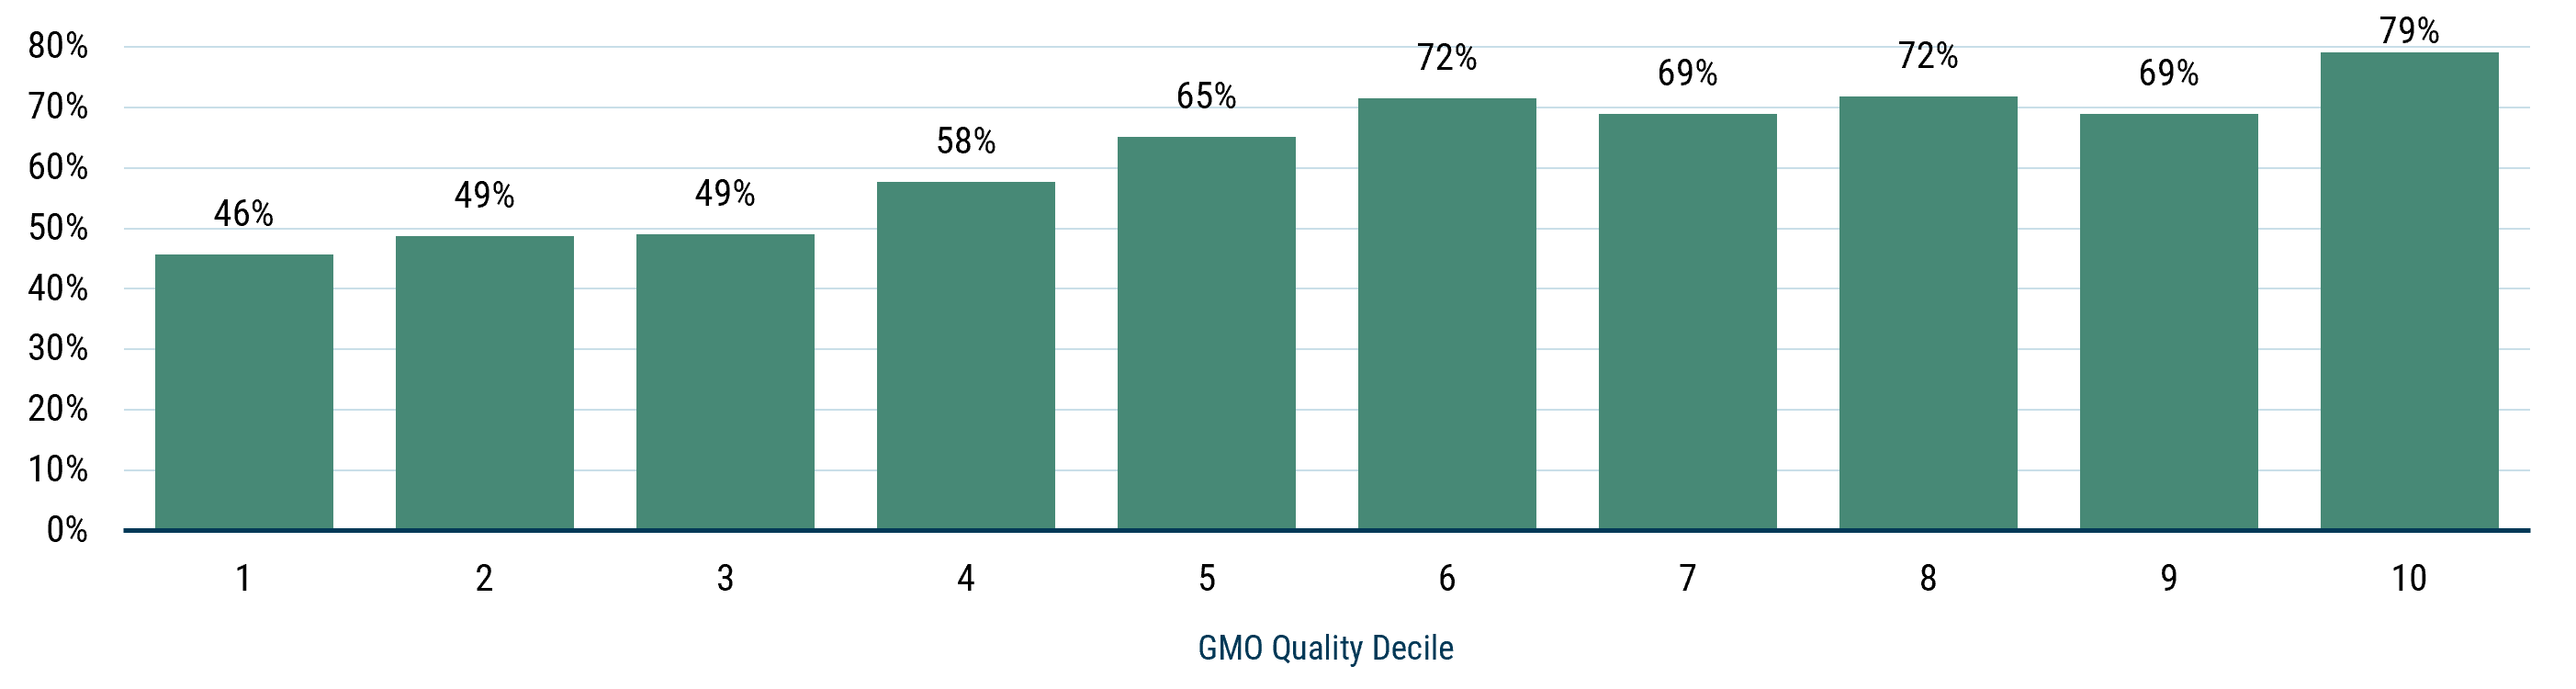
As of 12/31/2025 | Source: GMO, MSCI, Bloomberg, Compustat, Worldscope
It is not good news, then, that over the past 10 years, private equity has focused on taking companies private that are both more levered and less profitable than similarly-sized businesses (which we have already established are junky to begin with), all while paying a higher price for them than their size-peers (Exhibit 7).
These companies bank on the same set of factors—that interest rates will remain sufficiently low and the economy sufficiently robust—for them to be able to generate enough cash flow to pay down their debts. Different types of shocks—an economic slowdown, a further pickup in real interest rates if inflation proves sticky, a widening of credit spreads if private credit continues to sour—can all be enough to meaningfully hamper the profitability of these businesses, and to do so in a correlated manner.
Exhibit 7: Recent LBO Characteristics vs. Peers
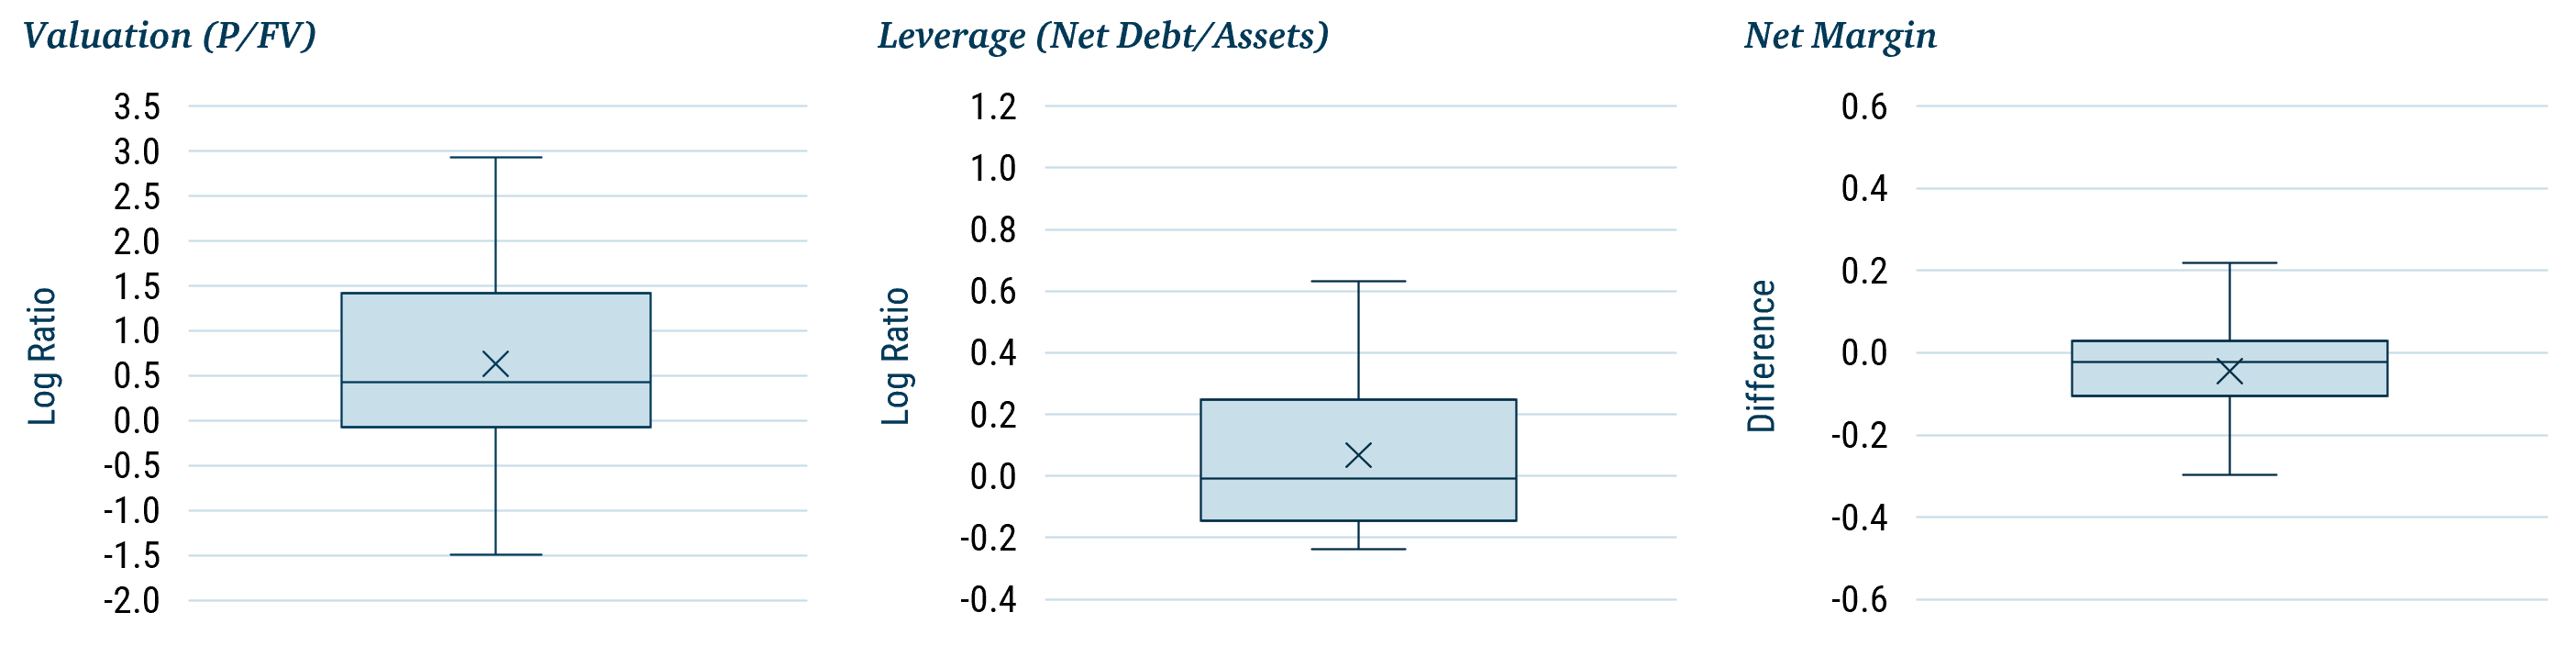
As of 12/31/2025 | Source: GMO, MSCI, Bloomberg, Compustat, Worldscope
It defies belief that a highly compensated, profit-maximizing subset of the equity market would be paying up for crappy businesses until we line up three facts. The first is that the value proposition of a good PE manager is to turn a business around. While net margins for companies taken private are low, gross margins tend to be high, and LBO managers operate under the premise that they can bring them closer together. 9
Indeed, the fact that PE has managed to outperform public equities while investing in low-quality businesses (which tend to underperform) is a sign that they probably can, to some extent, turn companies around. 10 The second fact is that private equity has grown a lot; there is no dearth of managers or capital in the space, and competition has driven up prices.
Finally, and most worrisome: the makeup of the private equity industry has changed dramatically. Buyouts are often thought of (by the authors of this piece, at least) as being focused on industrials and food companies. However, over the past 10 years, public-to-private LBOs have been heavily skewed toward software, which accounts for 40% of the recent deals closed (Exhibit 8).
Exhibit 8: Public-to-Private LBO Rolling 5-Year Industry Group Composition
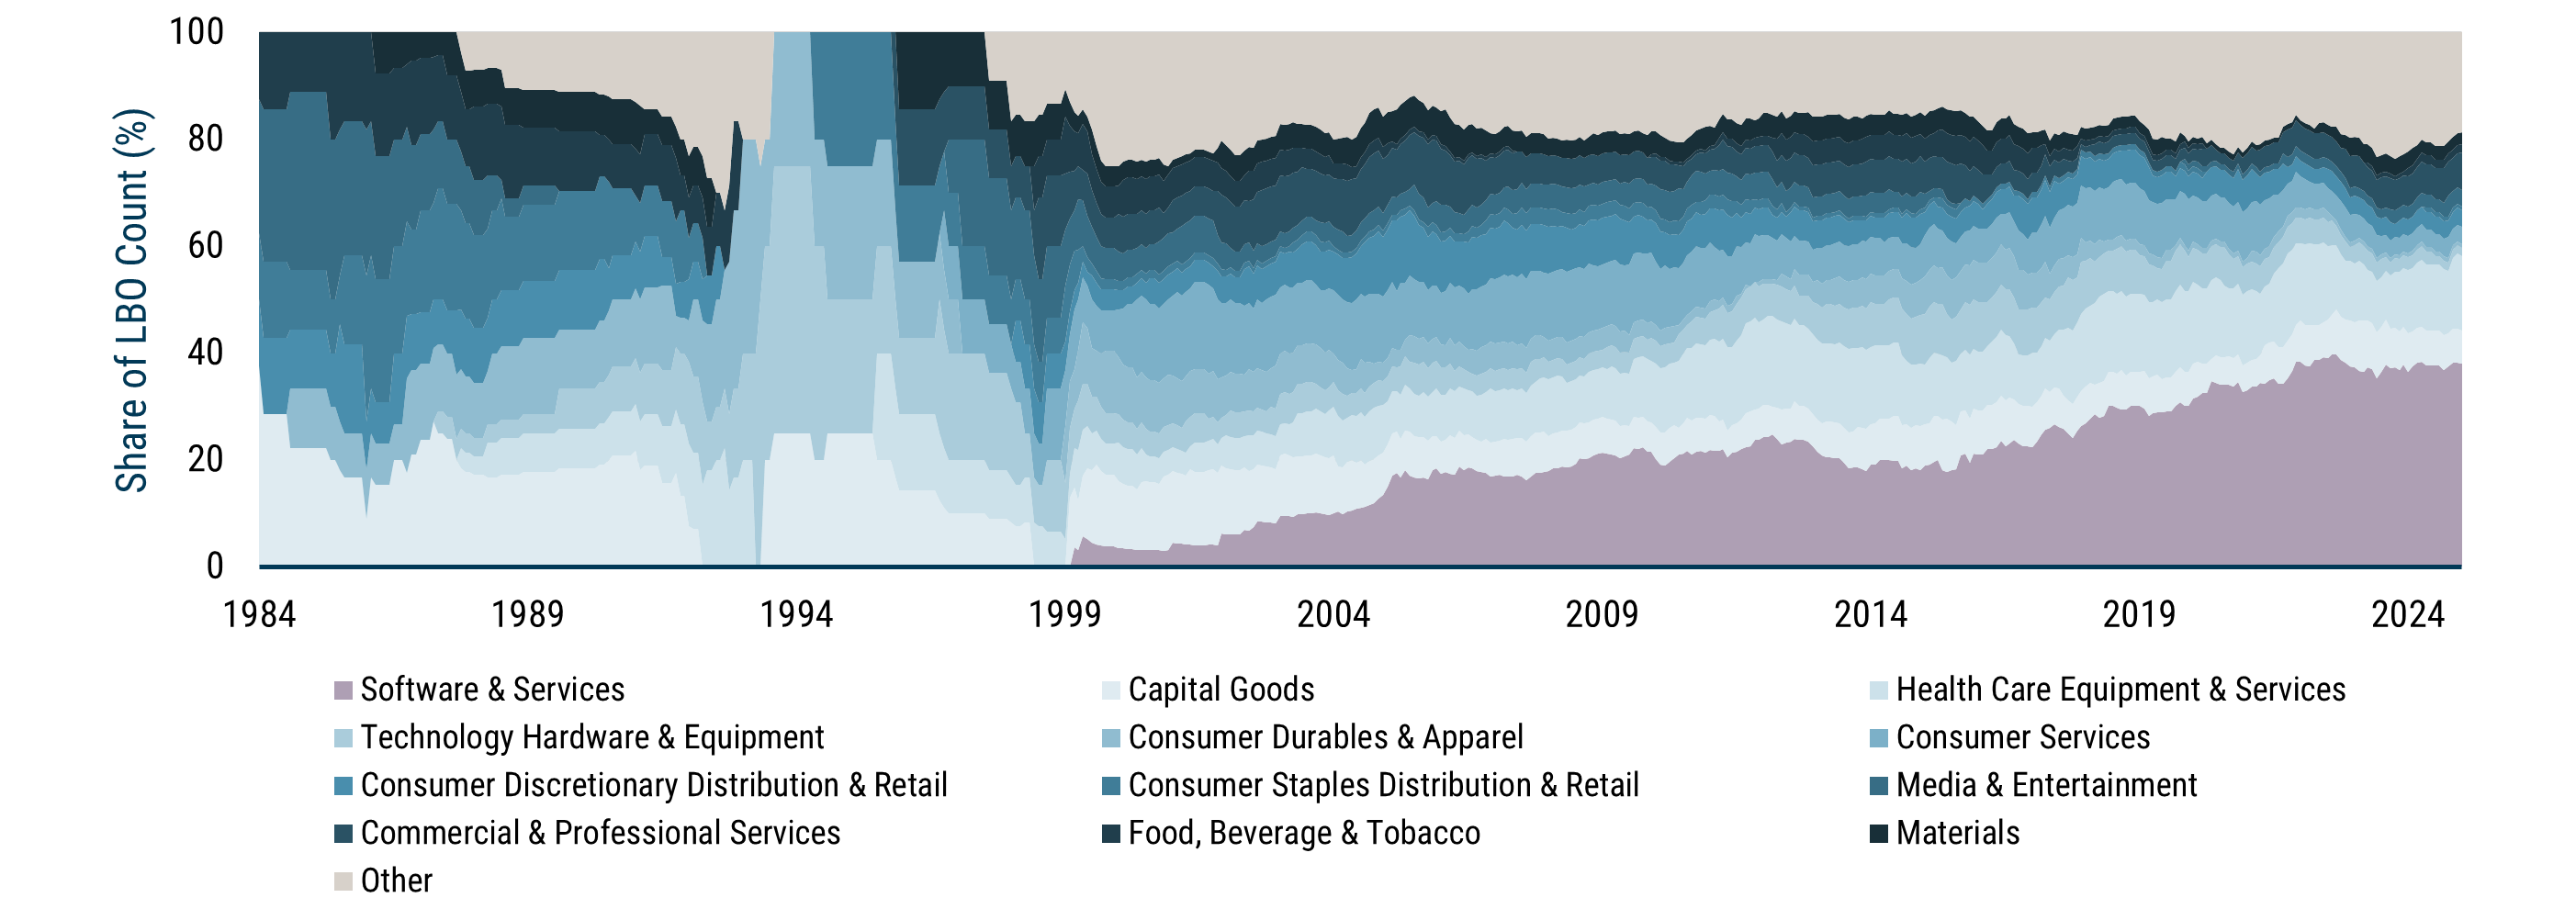
As of 12/31/2025 | Source: GMO, MSCI, Bloomberg, Compustat, Worldscope
This industry bet is, by far, the most concentrated we’ve seen in the history of buyouts. It is a consequence, as one buyout manager mentioned to us, of the multiple expansion of software companies, and an acknowledgement that asset-light businesses often have higher operational leverage and are therefore particularly good targets should they be able to grow. Whether a “good” bet or not, the scenario isn’t mimicked in public equities. Small-cap indices, like the Russell 2000 11 and the MSCI U.S. Small Cap Index, 12 have 5% or less in Software and Services as of March 2026.
Large-cap indices are likewise light on pure software: the S&P 500 only holds 10% in the group, while MSCI ACWI ex-U.S. holds a measly 5%. The buyout industry is therefore taking a massive relative bet that software will continue to eat the world. But the story in 2026, as you are well aware, is that the AI world will eat software. If investments in small software businesses in the public equity markets (Exhibit 9) are any indication of the broader impact, recent LBO fund vintages are likely in a tough spot.
Exhibit 9: YTD Cumulative Return
Software vs. Benchmarks

As of 5/8/2026 | Source: GMO, S&P Global, MSCI, Bloomberg
Our base case, to be fair, is not that these private businesses will go to zero. Private equity sponsors have plenty of smart people working hard to understand how to integrate AI into their companies to boost productivity and reduce the risk of disruption. Arguably, given they manage portfolios of businesses, private equity managers are better equipped to learn and adapt than the management teams of individual companies, which have less information about which process changes have proved successful elsewhere.
But being smarter and working harder does not insulate PE portfolio companies from exposure to a technological shift that could radically undercut their value proposition. If AI allows competitors to sprout with meaningfully lower launch costs, or enables clients to build their own customized software at a fraction of the cost, some value erosion to the software industry is inevitable. Moreover, given the generally high valuations at which these software companies were bought, a derating of the terminal multiple for such firms will be quite painful—even if the other financial assumptions buyers made at the time of purchase hold true.
A concentrated bet on software is therefore a genuine risk, and one allocators should think very seriously about today, especially in the context of venture capital and private credit (the other major private assets investors with significant PE allocations tend to hold). While investors are suddenly shocked (shocked!) to find a large software concentration in their private credit portfolios, venture capital portfolios have an even higher concentration in the software space—meaning that overall, the risk to endowment-style portfolios is substantially higher than our pure-buyout findings may suggest.
Hedging the Downside
Most private equity investors understand the economic downside risk of their portfolios, even if they value the lower measured volatility that comes with the leisurely pace of appraised value changes. When thinking of their overall equity allocation, PE investors account for the existence of their private assets and reduce their public equity allocations accordingly. What they generally fail to do is bake in the characteristics of the companies owned by private equity funds when considering how to manage the public equity (or liquid alternative) parts of their portfolio.
Pairing private equity with passive index exposure in the public markets, as some large investors are increasingly doing, mitigates this risk a bit, but it only stops the public equity book from piling into the same risks as the private equity portfolio. We’d argue that investors may be better served by running their public equity book to actively counter the risks of their private equity holdings.
As an example, let’s consider an institution that gets half of its U.S. equity exposure from private equity and the other half from a passive portfolio mirroring the overall U.S. public equity market. Relative to the overall U.S. equity market (public and private equities combined) the resulting portfolio is hugely overweight small-cap and lower-quality stocks. Correspondingly, it has a huge underweight to both large-cap and high-quality companies. If we were to cuff the aggregate PE holdings of U.S. companies at ~$5 trillion, their size would be approximately half the ~$10 trillion of non-S&P 500 U.S. companies, and only 7% of the ~$69 trillion market cap of the S&P 500 itself.
This leaves the aggregate U.S. equity portfolio for our institution with a 57% weight in companies smaller than the S&P 500 and a 43% weight in S&P 500 constituents. "Indexing” the aggregate of public and private equity owned companies would assign an 82% weight to the S&P 500 and a 6% weight to private equity. While the institution presumably believes its private equity holdings will generate substantial alpha relative to public equities, the aggregate small and low-quality bias of the resulting portfolio is not necessarily something one would want given the return and risk characteristics of small caps and low-quality stocks.
To approximately neutralize this bias on an index basis would involve taking a long position in the S&P 500 or S&P 100 equal to 38% of the total U.S. equity exposure inclusive of public and private holdings, and shorting a small-cap index, such as the Russell 2000, by the same amount. While this could be collateralized by the public equity holdings, the mark-to-market movements and consequent swings in posted collateral created by such a position would be massive.
And while periods when the Russell 2000 outperforms the S&P 500 should be economically correlated to those in which private equity does particularly well relative to public equity, the private equity portfolio will certainly not be spinning off cash in a manner that helps mitigate the collateral funding problem. It is also worth noting that while this hedge should reduce the downside economic risk of the aggregate U.S. equity portfolio, it neither has a positive expected long-term return nor does it mitigate the AI disruption risk from the software concentration in PE.
We believe a superior way to counter the small and low-quality bias of such a portfolio would be to replace the passive public equity exposure with an equity portfolio that takes advantage of one of the more persistent inefficiencies of the public equity market: the fact that high-quality stocks tend to mildly outperform over time and low-quality stocks tend to substantially underperform. Exhibit 10 shows the performance of high-quality, low-quality, large-cap, and small-cap stocks in the U.S. equity market since 1981.
Exhibit 10: Real Return Since 1981
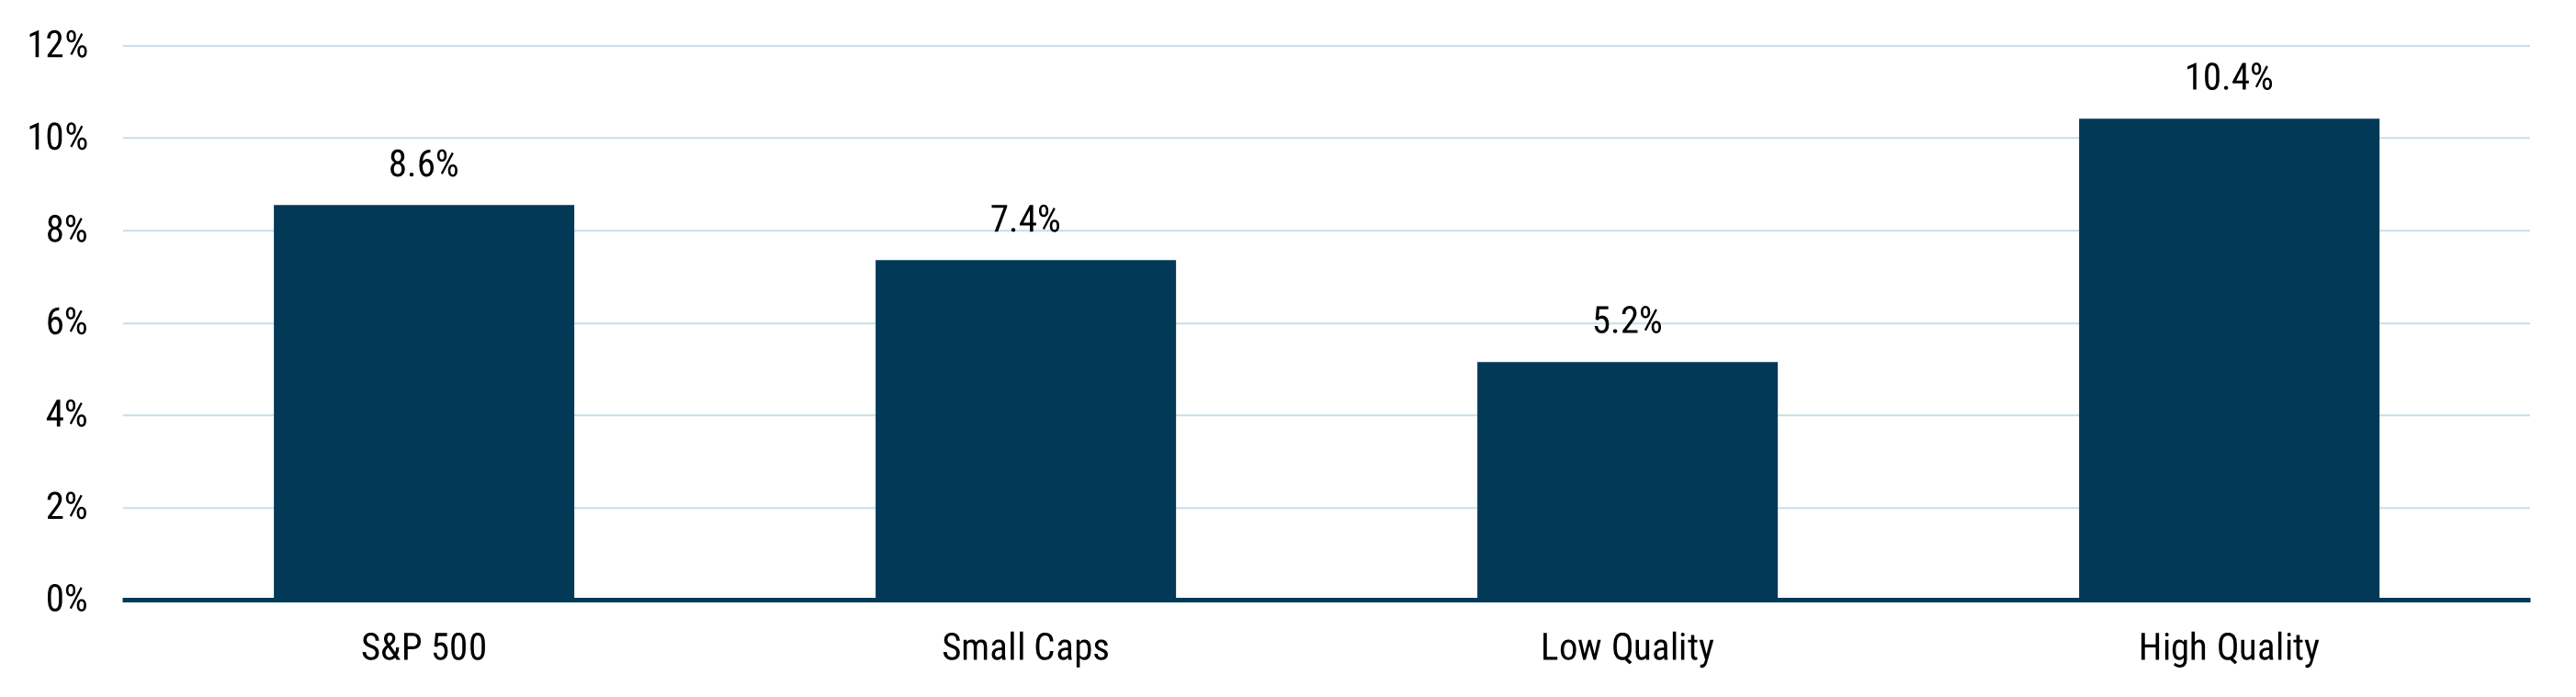
Data from 1981 to 2026 | Source: Worldscope, GMO, S&P Global
Small Caps are the 2,000 smallest stocks within the largest 3,000 U.S. stocks by market cap. High Quality is the top 25% of high-quality companies by market cap within the 3,000 largest U.S. stocks, measured by GMO’s quality factor. Low Quality is the bottom 25% of low-quality companies by market cap within the 3,000 largest U.S. stocks, measured by GMO's Quality Score.
The underperformance of small caps relative to the S&P 500 is a relatively recent phenomenon that depends on start and end dates. Low-quality stocks, on the other hand, have consistently underperformed both the broader market and high-quality stocks despite having a consistently high beta. Another benefit of shorting the low-quality group instead of small caps is the fact that software has more than twice the weight in the low-quality group than it does in broad small-cap indices. We believe a hedge of this sort offers three important benefits relative to its index-based counterpart:
- It is expected to outperform, given that junky stocks are consistently overpriced due to investors’ propensity to pay up for moonshots.
- It offers downside protection due to the large beta discrepancy between high-quality companies (who navigate drawdowns well and have low downside beta) and their low-quality cousins (who tend to implode spectacularly during corrections as they are often in need of external capital precisely when it is most expensive to obtain).
- It wastes no capital. Unlike an index-based hedge, you are not purchasing any high-quality small caps or low-quality large caps in the process.
At GMO, we have run such portfolios on and off since 2004, learning many a lesson on how to manage them over the years. 13 Our most recent offering, the Quality Spectrum Strategy, is 175% long large, high-quality stocks and 75% short smaller, junkier stocks. Since our Focused Equity team launched the strategy in 2019, it has delivered on its promise to keep up with equity markets over time while protecting capital during particularly stressful equity periods, as shown in Exhibit 11. At the risk of sounding a little shameless, this is exactly the type of portfolio we believe allocators with private equity and venture capital exposure should be seeking. 14
Exhibit 11: Quality Spectrum Performance in Distinct Scenarios
S&P 500 Worst 10 Months Since 2019
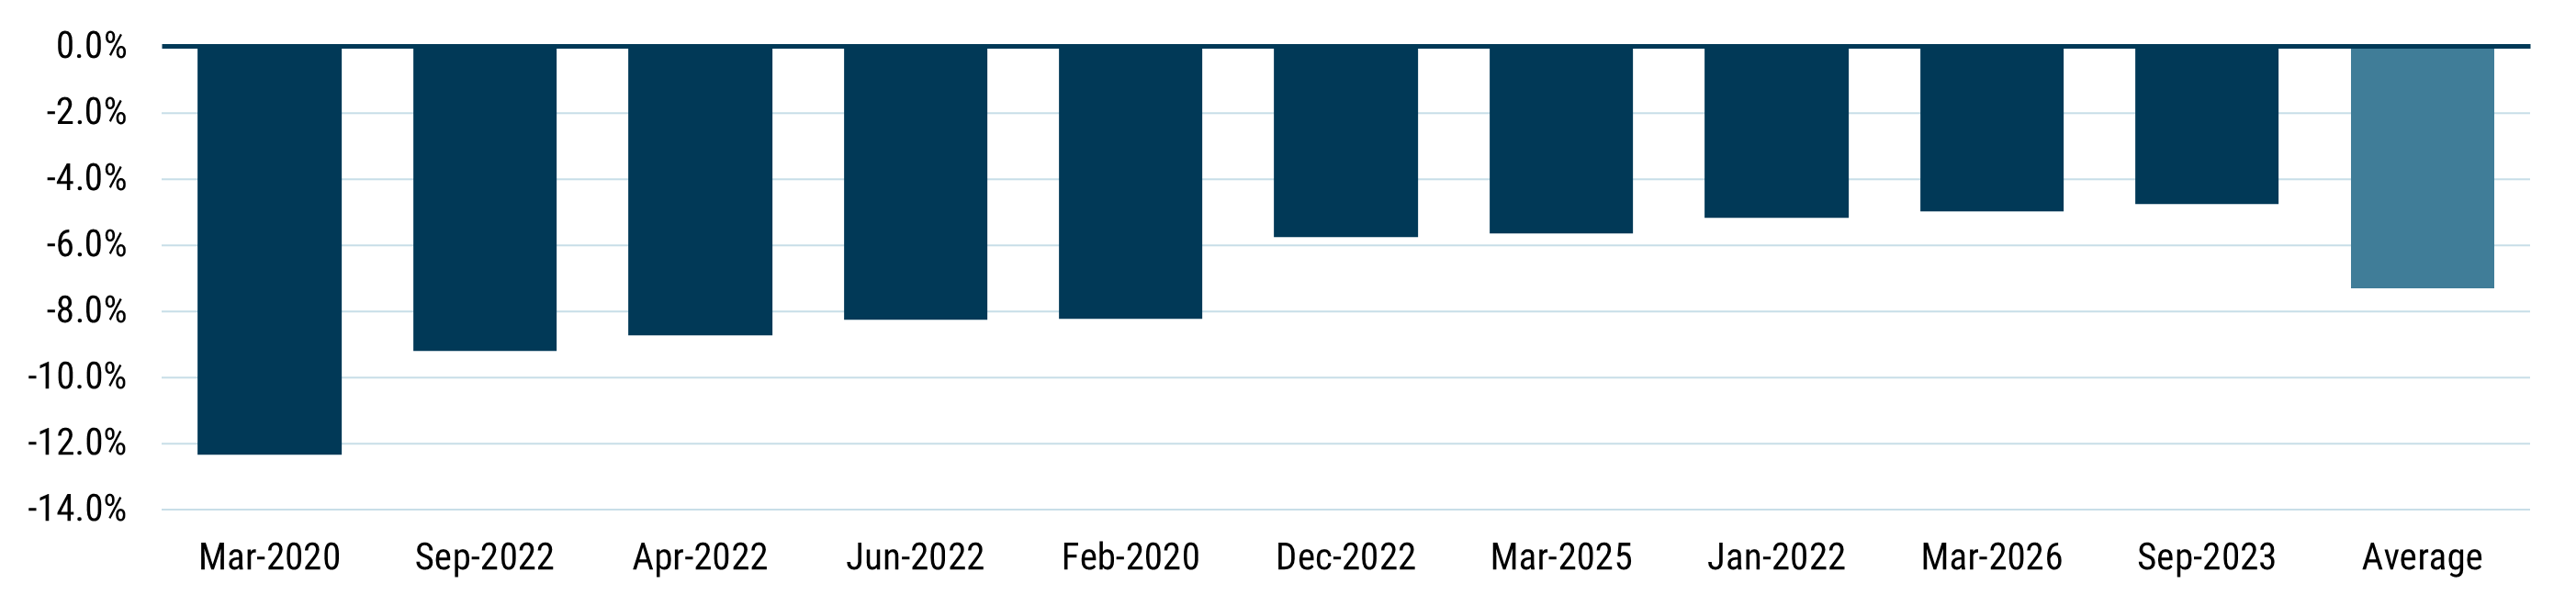
Quality Spectrum Relative Returns to S&P 500 on Same 10 Months
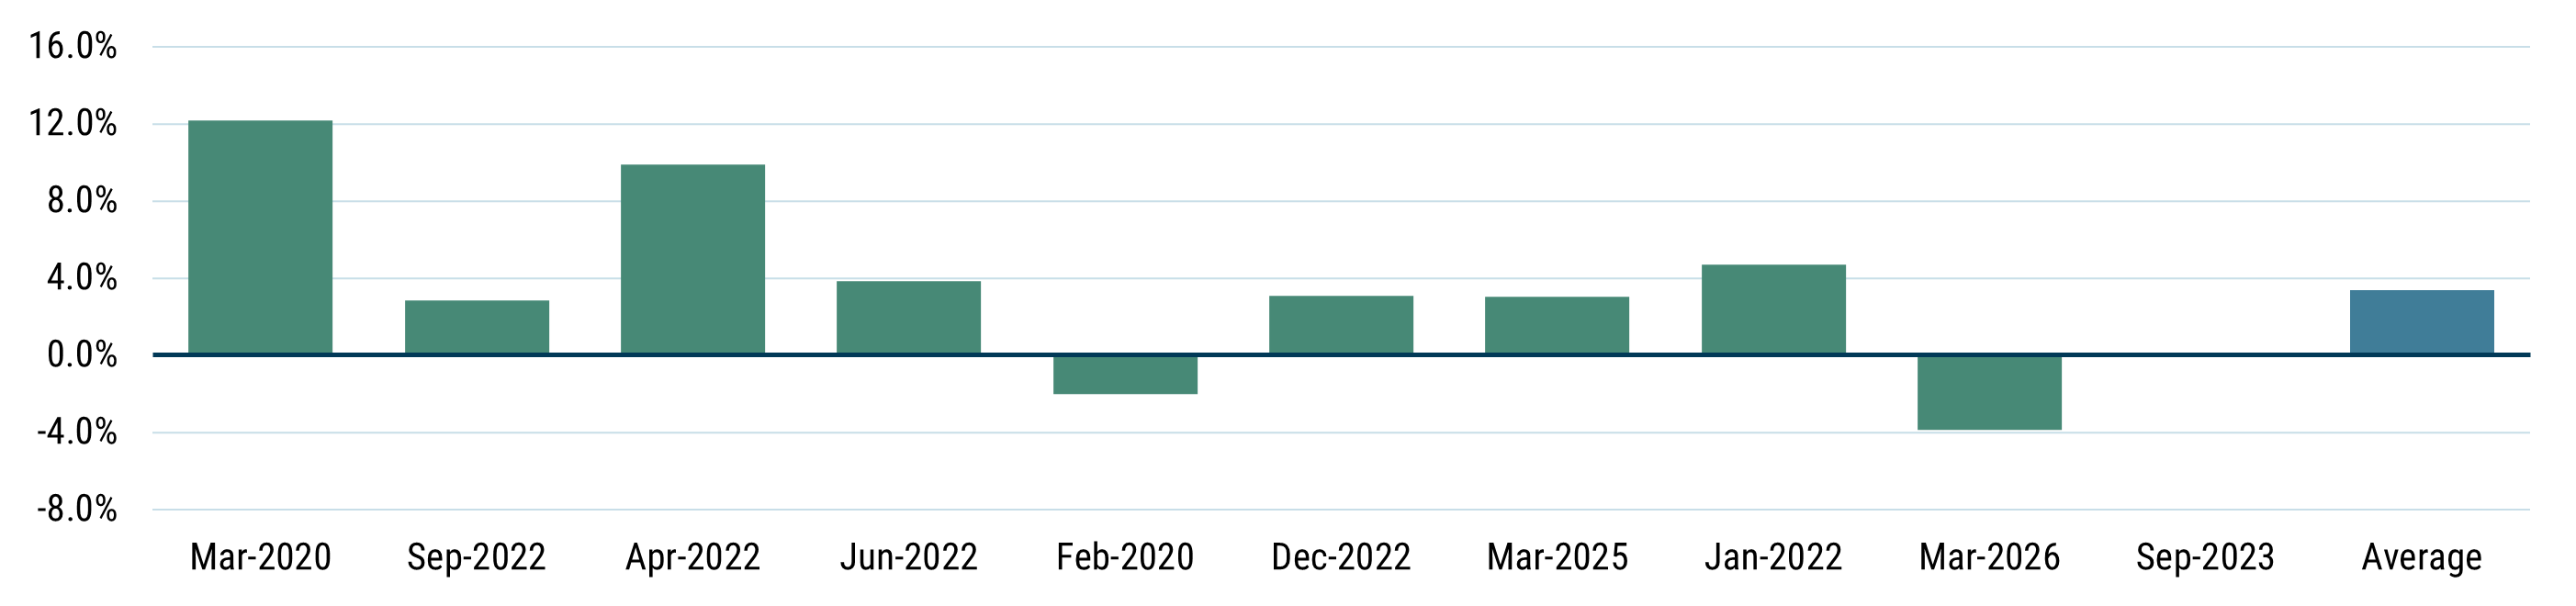
Source: GMO
Conclusion
It can be tempting to treat private equity as a separate animal from stocks and confine your worries to liquidity considerations rather than true economic exposures. Given the reality of stale marks and generally short or shallow recessions in most of its history, it can seem as though private equity’s downside is not losses but occasional inconvenience. But while the true downside of risk assets doesn’t bite that often, the art of building a good long-term portfolio requires an honest look at what risks that portfolio really takes.
Our analysis of 45 years of LBO data tells us in part what most investors should already know (that private equity portfolios skew massively smaller than public equity indices), as well as some things that we, at least, were not yet aware of: that private-equity-held companies skew less profitable than public equivalents, that their industry concentration in software today is much higher than any concentration they have held in any industry in the past, and that their leverage is high even before layering on the extra debt from a buyout.
This means portfolios with significant private equity exposure face a large downside economic risk that is not obviously compensated by the market. While private equity managers have historically delivered significant alpha relative to the small-cap and low-quality company universes they select from, that’s no reason to passively accept a substantial bias toward a riskier universe of companies.
Owning a purely large cap public equity portfolio may mitigate private equity risk to some extent, but PE’s massive, small-cap bias cannot simply be diversified away. To reduce the small-cap bias of a portfolio with significant private equity exposure, it is necessary to actively short small caps. Such a hedge could be built out of long megacap, short small-cap passive exposures, but it would likely be inconvenient to manage.
We believe that inefficiencies in the public markets when it comes to high- and low-quality stocks suggest an active hedge could be achieved that has better risk characteristics, more capital efficiency, and a positive expected return. Either way, allocators would do well to manage the large factor bets they are taking in their equity portfolios.
Read Part 2 of the Quarterly Letter: Letter to the Investment Committee on Private Equity
...which have no role in writing this letter. You still get artisanal human text when you read GMO! Or, at least, the large language model summarizing this letter for you does.
The other 20% are in the “growth” category. See, for instance: Alternative Investments: Private Equity & Venture Annual Report (Bloomberg 2025).
Though this is an argument that holds true controlling for size, our sample might still be quite different from what you would get in smaller private-to-private buyout funds.
We find peers by matching names on date, size, and industry group.
Companies with more than USD 100 million in revenues.
See, for instance: Why Private Equity? Why Now? Reasons to Invest in Private Equity in 2026 (KKR 2026).
Both are a consequence of Zipf’s Law (as applied to firm size).
For the mathematically curious, we are setting ![]() for all i, where
for all i, where ![]() and
and ![]() Changing the parameters, introducing heterogeneous market betas, or adding other factors doesn’t change the underlying results unless you believe private companies are significantly more idiosyncratic than public companies.
Changing the parameters, introducing heterogeneous market betas, or adding other factors doesn’t change the underlying results unless you believe private companies are significantly more idiosyncratic than public companies.
And presumably not by tanking gross margins.
Comparing the performance of private equity and public equity is tricky. The IRRs often quoted by PE firms are not directly comparable to returns in public equity markets, and even capturing all private equity funds and determining which are appropriately aggregated is a difficult task. Cambridge Associates does as good a job as any. On their data (US Private Equity: Index and Selected Benchmark Statistics), U.S. private equity broke even against the Russell 3000 over the decade-ending September 2025, with some modest alpha over longer periods. This arguably understates PE's alpha relative to its selection universe. Smaller-cap and junkier companies have substantially underperformed the Russell 3000 over the last 20 years, which makes the alpha of PE against the universe of stocks they were selecting from better to the tune of several percentage points. PE relative performance since the peak of the 2021 bubble (and the sustained rise in interest rates), on the other hand, has been poor against pretty much any U.S. public equity index.
The trickiest problem of managing a long high-quality/short low-quality portfolio is the fact that the short book is massively more volatile and higher-beta than the long book. The rebalancing drag of a long/short portfolio rises as a function of the volatility of the short book relative to the long book in dollar terms, so a dollar-neutral quality vs. junk portfolio suffers much higher rebalancing drag than one where the high-quality long book is larger than the junk short.
Or a version of it that targets a beta of zero (which we are also happy to run).
Disclaimer: The views expressed are the views of Ben Inker and John Pease through the period ending May 2026 and are subject to change at any time based on market and other conditions. This is not an offer or solicitation for the purchase or sale of any security and should not be construed as such. References to specific securities and issuers are for illustrative purposes only and are not intended to be, and should not be interpreted as, recommendations to purchase or sell such securities.
Copyright © 2026 by GMO LLC. All rights reserved.
...which have no role in writing this letter. You still get artisanal human text when you read GMO! Or, at least, the large language model summarizing this letter for you does.
The other 20% are in the “growth” category. See, for instance: Alternative Investments: Private Equity & Venture Annual Report (Bloomberg 2025).
Though this is an argument that holds true controlling for size, our sample might still be quite different from what you would get in smaller private-to-private buyout funds.
We find peers by matching names on date, size, and industry group.
Companies with more than USD 100 million in revenues.
See, for instance: Why Private Equity? Why Now? Reasons to Invest in Private Equity in 2026 (KKR 2026).
Both are a consequence of Zipf’s Law (as applied to firm size).
For the mathematically curious, we are setting ![]() for all i, where
for all i, where ![]() and
and ![]() Changing the parameters, introducing heterogeneous market betas, or adding other factors doesn’t change the underlying results unless you believe private companies are significantly more idiosyncratic than public companies.
Changing the parameters, introducing heterogeneous market betas, or adding other factors doesn’t change the underlying results unless you believe private companies are significantly more idiosyncratic than public companies.
And presumably not by tanking gross margins.
Comparing the performance of private equity and public equity is tricky. The IRRs often quoted by PE firms are not directly comparable to returns in public equity markets, and even capturing all private equity funds and determining which are appropriately aggregated is a difficult task. Cambridge Associates does as good a job as any. On their data (US Private Equity: Index and Selected Benchmark Statistics), U.S. private equity broke even against the Russell 3000 over the decade-ending September 2025, with some modest alpha over longer periods. This arguably understates PE's alpha relative to its selection universe. Smaller-cap and junkier companies have substantially underperformed the Russell 3000 over the last 20 years, which makes the alpha of PE against the universe of stocks they were selecting from better to the tune of several percentage points. PE relative performance since the peak of the 2021 bubble (and the sustained rise in interest rates), on the other hand, has been poor against pretty much any U.S. public equity index.
The trickiest problem of managing a long high-quality/short low-quality portfolio is the fact that the short book is massively more volatile and higher-beta than the long book. The rebalancing drag of a long/short portfolio rises as a function of the volatility of the short book relative to the long book in dollar terms, so a dollar-neutral quality vs. junk portfolio suffers much higher rebalancing drag than one where the high-quality long book is larger than the junk short.
Or a version of it that targets a beta of zero (which we are also happy to run).