Executive Summary
2022 was a painful year in financial markets with almost all traditional assets delivering significant losses. Just about the only strategies to deliver meaningful gains in the year were exactly those strategies that had been woefully out of favor not just in 2020 and 2021 but for most of the cycle prior to that. The losses in markets were not randomly distributed, and the extent of the pain lined up fairly well with how extreme valuations had become in the 2020-21 Covid “FOMO” bull market. The correlation of losses to previous silliness was not perfect – emerging equities and debt were hurt by the war in the Ukraine in a way that owed nothing to the previous bull market, and in the U.S. a strong year for value didn’t actually do as much for the cheapest value stocks as one would have expected. When bad things happen to relatively cheap assets it generally creates a good buying opportunity, and we believe emerging equity and debt and U.S. deep value stocks are well worth investing in today. But with bad things having happened to so many assets, the opportunity set has broadened out quite nicely and is far better than it was a year ago. Broad U.S. stocks and government bonds are still priced at high valuations relative to history and further difficulties in markets would not be at all surprising. But for the first time in several years, it is possible now to put together a well-diversified portfolio of assets and strategies that are either outright cheap or at least fair value, and even if more market trouble is on the horizon, it is far better being too early than too late when buying assets that are cheap in absolute terms. All of this makes for an excellent silver lining to a year most investors would like to forget.
I don’t mind admitting that the weird “everything” Covid bull market of 2020 and 2021 was the most disorienting market environment of my life. I’ve certainly lived through investment bubbles before, but as Jeremy Grantham had pointed out to me multiple times over the years, they almost always take place when investors assume a Goldilocks economy will continue indefinitely. In Covid, of course, things were fundamentally going anything but well, but you’d have never known it from the markets, which showed more signs of speculative frenzy than anything we have seen since the height of the 1999-2000 internet stock bubble. When the histories of this era are written, my guess is that the phenomena of meme stocks and crypto will wind up being the stars of the show and could well wind up replacing Dutch Tulips as history’s greatest examples of speculative insanity.
One thing meme stocks and crypto had in common was the fact that “fundamentals” simply weren’t a part of the discussion. Neither of them had fundamentals, at least in the form of meaningful cash flows one could plausibly expect to ever come out of them, and that seemed, remarkably, to have been viewed as somehow a feature rather than a bug. In a market driven by FOMO (Fear of Missing Out), the last thing you wanted to be doing was investing based on expected future cash flows. And then 2022 happened. In a year where pretty much every traditional asset fell pretty sharply it's hard to say it was precisely “fun” for me. I’ll admit to a certain amount of satisfaction watching some of the embodiments of the excesses of the bubble get their comeuppance, but our ability to shield our clients from some of the pain was very much driven by the extent to which we were able to move them out of traditional stocks and bonds and into the kind of liquid alternative strategies that had seemed woefully out of step over the last few years. In places where we had that freedom, results ranged from small losses to sizable gains, but where stocks or bonds were our only options, it was hard to avoid substantial losses, even if we could console ourselves that those losses were generally smaller than those in the clients’ benchmarks.
Making it through 2022 intact really required choosing to avoid traditional assets and moving to the exact type of strategies that had proved disappointing for the last decade. Far from being a FOMO market, 2022 was arguably the first JOMO (Joy of Missing Out) market in at least a half century. As we look ahead to 2023, the good news after last year’s sharp declines is that pretty much every traditional asset is meaningfully cheaper than it was a year ago, and it is suddenly possible to put together portfolios of assets that are fair value or better, even if taking maximum advantage of today’s opportunity set requires accepting some real career risk.
The Year of JOMO
If you looked at a ranking of asset performance in 2022, the pain lined up reasonably well with the craziness of the asset prices coming into the year. Table 1 shows the performance of assets and some selected investment strategies for the year colored by my ranking from profoundly FOMO to most outstandingly JOMO. JOMO assets and strategies are those that came into 2022 deeply out of favor with investors who had embraced the winners of the Covid bull market.
Table 1: 2022 ASSET CLASS RETURNS
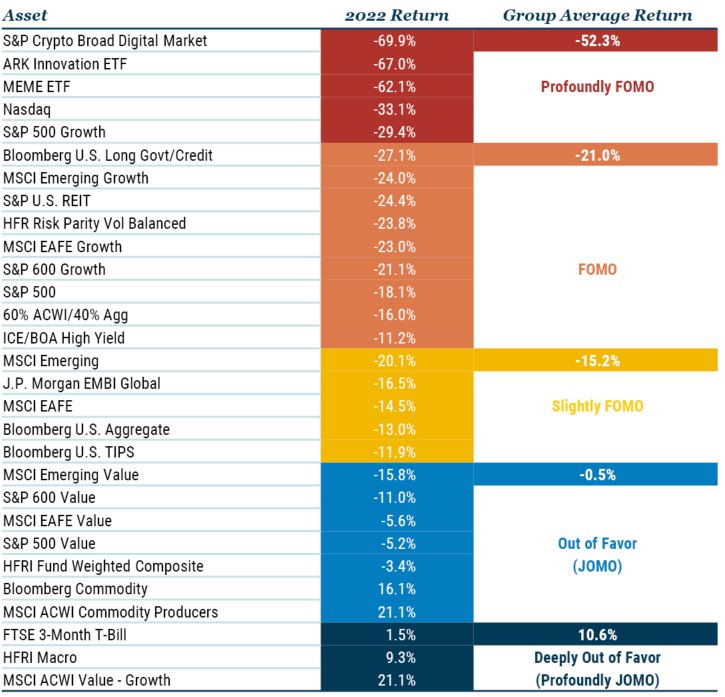
As of 12/31/2022 | Source: GMO, Standard & Poor’s, MSCI, FTSE, Bloomberg, Yahoo Finance,
ICE, J.P. Morgan
If there has been a worse relative year for FOMO assets in history, I’m not sure when it was, but assets didn’t have to be full-bore FOMO to lose money. The only assets and strategies that made money were ones that had become pretty deeply unpopular by the end of last year, and it wasn’t even a majority of those. A handful of hedge fund managers who leaned heavily into the JOMO trades did exceptionally well by their clients, and all congratulations are due to both them and the clients who stuck with them. But even a quick skim of the articles lauding those results will unearth the fact that pretty much all of those managers were starting from asset levels a fraction of what they had been before FOMO kicked in. If anyone has come up with a good solution to that problem, you might well be able to fix the investment industry.
Not everything lined up perfectly
Not every unloved asset managed to shine in 2022. Some bad things did happen to fairly cheap assets, and there were some odd undercurrents even in places that were shining pretty brightly. Emerging equities and debt were certainly not beloved by the average investor at the end of 2021. Their prices had been dragged higher by the seemingly unending tide of falling interest rates, tightening credit spreads, and rising equity valuations, but I do think “dragged” seems like the right term: neither had made much of any headway since the mind-boggling rally year of 2020. But despite having missed out on the party, they managed to get the hangover anyway. Much as I would love to somehow blame Russia’s invasion of the Ukraine on meme stocks or crypto, it certainly wasn’t their fault. And, honestly, even knowing that it was entirely Vladimir Putin’s fault doesn’t really help either.
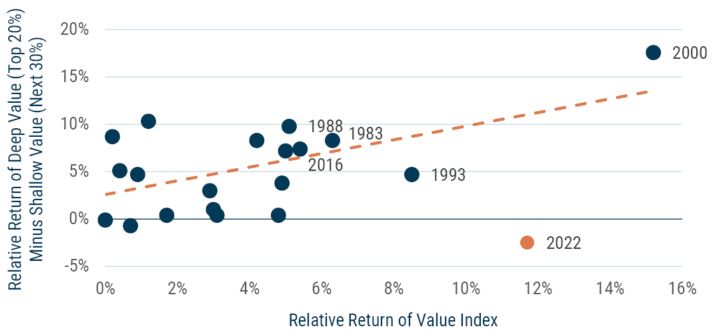
Even within at least one strategy that looks to have been perfectly JOMO – the value versus growth spread within U.S. large cap equities – slightly odd things happened under the surface. Within U.S. large caps, the value/growth spread was a stunning 24% in favor of value. Only 2000, where that spread was an even more amazing 28%, was a better year for value versus growth. Historically, good years for value are good years for value within value as well. In 2000, for example, the value half of the market beat the overall market by over 14%. And the cheapest 20% of the market (deep value) beat the next 30% of the market (shallow value) by 17%. Value within value absolutely crushed the rest of value. That was an exceptional performance for “value within value,” but in a way 2022 was even more exceptional, just not in a good way for fans of deep value. Exhibit 1 shows the performance of deep versus shallow value across all years since 1980 in which value beat growth.
EXHIBIT 1: DEEP VS. SHALLOW VALUE RETURNS DURING PERIODS WHEN VALUE WINS – U.S.
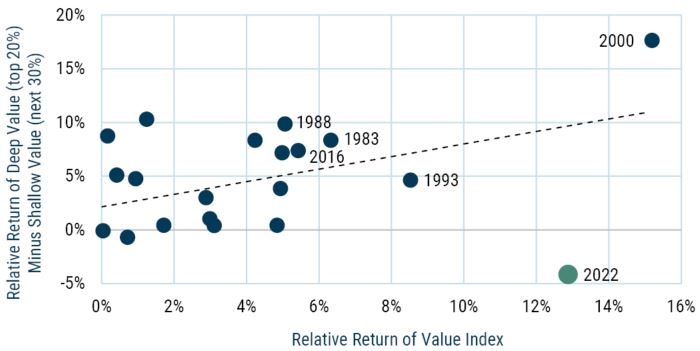
As of 12/31/2022 | Source: GMO
Relative to the general pattern, 2000 was an outlier to the upside – deep value beat shallow value by about 6% more than would have been expected. But in 2022, deep value lost to shallow value by almost 5%, against an expected win of 10%. It’s far and away the largest outlier on the chart, and we can’t find anything fundamental that would explain it. Deep value stocks were not particularly junky or cyclical at the time relative to the market, their underlying earnings and other fundamentals were pretty good, and they came into the year trading at one of their biggest discounts to the market and to shallow value that we’d ever seen. In keeping with the JOMO theme, I’d say that 2022 was not so much a year where it was a ton of fun as a value manager, rather a nightmare for high-priced growth. Unless you called the energy rally and bet heavily on that, value investing felt more like a matter of watching the stuff you’d never own fall sharply while still feeling a bit frustrated that the market still didn’t fully appreciate the charms of the stocks you held.
How the investment landscape changed across 2022
The end of 2021 was really a pretty odd time in the markets. We’ve seen bubbles in the past, but this one didn’t quite fit any of their molds. When Jeremy referred to 2007 as an “everything bubble” what he meant was that basically all risk assets were overpriced and investors were paying for the privilege of taking risk. Exhibit 2 shows what the risk/reward line looked like on our asset class forecasts as of the middle of 2007. The solid line is a risk/reward regression fit of the individual forecasts. Whether you owned a cap-weighted risk portfolio or were more equally allocated across risky assets, expected returns were pretty much the same, and the fit of the regression line was really pretty good, which meant moving your assets around within the various risk categories didn’t appear to matter much.
EXHIBIT 2: Asset Class Volatility/Return Trade-Off
June 2007: Biggest risk bubble in history
Source: GMO
The only way to save yourself in 2008 was to avoid risk assets entirely or, if you were truly brave, to go net short risk.
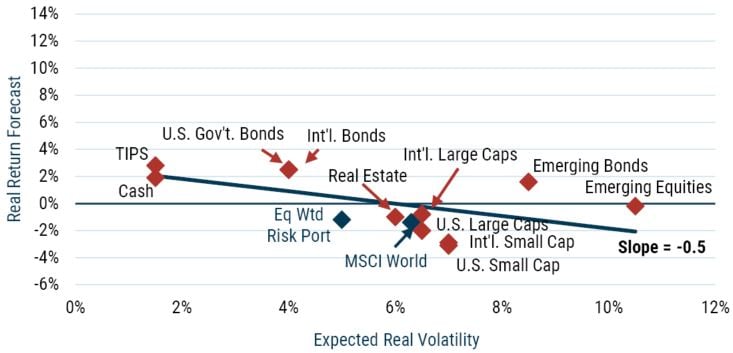
In 2000, by contrast, you could still get paid for taking risk. There was a massive bubble in growth stocks, but risk assets like REITs, small caps, and emerging equity and debt were quite cheap (see Exhibit 3).
EXHIBIT 3: Volatility/Return Trade-Off In June 2000
Source: GMO
You weren’t getting paid a ton for taking risk – the slope of the regression line was +0.4 and the equilibrium slope was about +0.7. But the problem was not risk assets. It was U.S. large caps and, in particular, growth stocks. An equal-weighted portfolio of risk assets had a giant expected return benefit over a cap-weighted one and the fit of the regression line for risk assets was horrible, implying a big potential return to taking asset allocation bets. The other striking thing about 2000 was just how high the expected return was of the assets not caught up in the bubble. TIPS yielded 4% real. REITs yielded 9%. Emerging equity and debt were priced at extremely attractive levels. Putting together a portfolio to generate a good real return wasn’t actually much of a challenge. The challenge was getting someone to buy it.
The end of 2021 was quite different from either of those events, as you can see in Exhibit 4.
EXHIBIT 4: Asset Class Volatility/Return Trade-Off
December 31, 2021
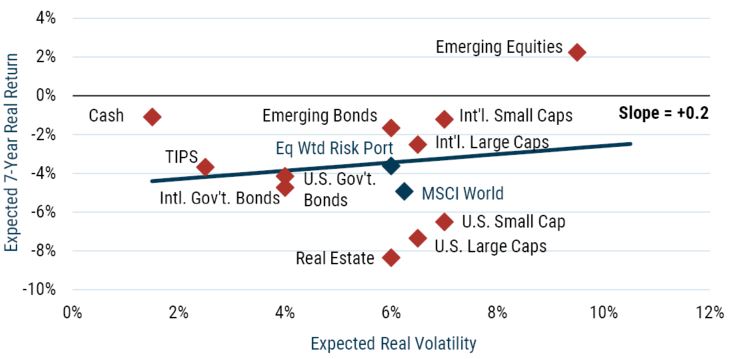
Source: GMO
There are a few points to note about this regression line. It is pretty flat but not downward sloping. Choosing to take less risk in traditional assets reduced your expected return, just not by as much as it normally would. The fit of the regression line is not a very good one – assets were quite mispriced against each other, which implies a strong potential return to asset allocation. But the truly shocking thing about this line was just how low it was on the chart. With the exception of emerging equity, every single asset looked priced to deliver a negative real return. It was the worst aggregate opportunity set for traditional assets we had ever seen, and the only thing there seemed to be to do about it was to get creative and find something to own outside of traditional assets.
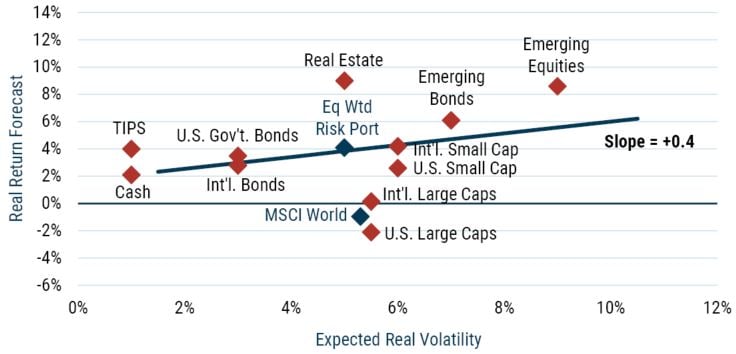
But 2022’s lousy year changed the outlook for many assets, and here is today’s version of the exhibit.
EXHIBIT 5: Asset Class Volatility/Return Trade-Off
December 31, 2022
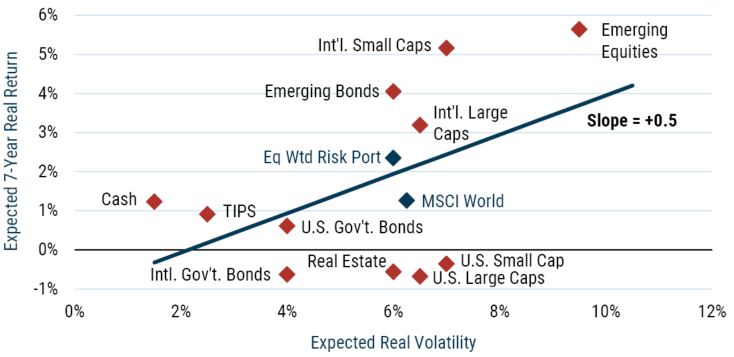
Source: GMO
It’s pretty meaningfully different. The slope of the risk/reward line is notably better. Now, +0.5 does not imply you should be running out to lever your risk asset positions, but it’s a good deal better than +0.2. The fit of the line is still pretty poor – the potential return to active asset allocation looks to be very good. But the truly striking change is how much higher on the page everything is. To be clear, 2023 is not the second coming of 1982 when more or less every asset around the world was screamingly cheap. But the midpoint of the regression line moved up from about -4% to +2% over the course of 12 months. Granted, +2% is not something on its own to crow about. If these forecasts are correct, a 60/40 portfolio will remain well short of the 5% real return most investors have as their long-term projections. But last year’s beat-down across all traditional assets has done a huge service to the expected return of pretty much everything. Life is a little more complex than these lines make it seem: in building our portfolios we now consider more scenarios than we did in 2000 or 2007 and in those other scenarios risk assets look to be a somewhat better buy. On the other hand, we have learned to our pain as value investors over the past 40 years that you are usually better off reacting more slowly than prices actually move. Using a moving average of our forecasts to mitigate the value manager’s curse of being too early counteracts some of the increased attractiveness of risk assets that comes from our friendlier scenarios, but if markets stay at today’s levels for the next several months, we will gradually find them more attractive. But abstracting a little away from these details, the world has made a rapid move from perhaps the worst aggregate investment environment in history to something approaching palatable. That seems worth celebrating.
What to actually own now?
Our favorite portfolios a year ago were the ones with the lowest amounts of traditional assets we could get away with. We still think those non-traditional assets look pretty compelling. In fact, one of them – our Equity Dislocation Strategy – remains our favorite investment idea, despite its double-digit returns last year. We believe our second largest holding in liquid alternatives, the Systematic Global Macro Strategy, also looks very well positioned to continue to exploit today’s large mispricings across asset classes after its own strong 2022. One notable plus for liquid alternative strategies is that cash saw a huge increase to its expected return across 2022, so a strategy with an underlying cash return – as liquid alternatives generally have – has seen its expected return leap higher almost as fast as the expected returns to other assets. Still, it’s a lot easier to own traditional assets today than it was last year. Exhibit 6 shows the allocations for our Benchmark-Free Allocation Strategy a year ago and where it stands today.
EXHIBIT 6: Allocations for GMO Benchmark-Free Allocation Strategy
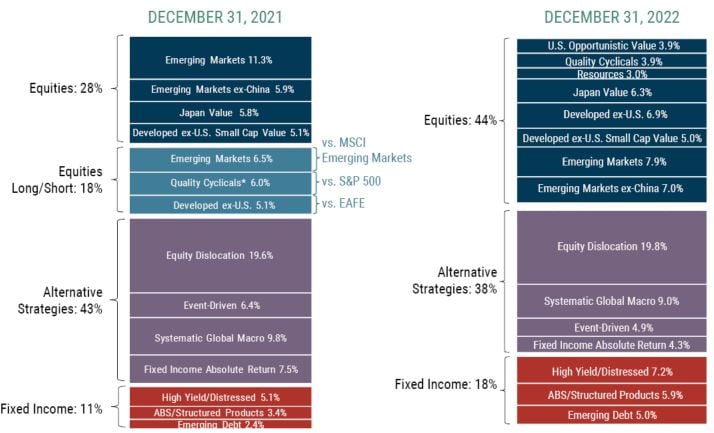
Source: GMO
The above information is based on a representative account in the Strategy selected because it has the fewest restrictions and best represents the implementation of the Strategy. Weightings are as of the date indicated and are subject to change. The groups indicated above represent exposures determined pursuant to proprietary methodologies and are subject to change over time.
Totals may vary due to rounding.
A year ago, we had 28% in equities, 11% in credit, and 61% in alternatives. Today, we have 44% in equities, 18% in credit, and 38% in alternatives. That’s still a lot in alternatives, but it’s a 23% increase in traditional assets – all risk assets of one kind or another – in a year. Looking into the equities we bought and own, the overarching theme is that value remains quite attractively priced everywhere around the world, and if a strong relative year for value has eaten a bit into its relative cheapness, in absolute terms value stocks got cheaper.
It’s still quite hard for us to evince enthusiasm for major markets that are trading at valuations much higher than historical norms – the S&P 500 and global government bonds are sadly both giant asset classes sitting in that camp – but there is an increasing number of assets around the world that really do look to be fair value or cheap even by pre-millennium standards. We certainly can’t sound an “all clear” that the markets have hit bottom. As Jeremy Grantham’s recent piece “After a Timeout – Back to the Meat Grinder” points out, there are plenty of reasons to believe that markets may well have significantly further to fall in order to fully excise the excesses of the Covid bubble. Global equity indices still trade expensive versus historical averages, particularly the U.S. large cap stocks that have come to dominate those indices. But lots of assets are cheaper than the broad aggregates, and we would suggest investors should be looking to start moving into those now rather than wait to try to time the market bottom. It is certainly true that relatively cheap assets are likely to face some losses if markets continue to fall, but when cheap assets fall in price their expected return rises quite rapidly, so a loss is not actually the worst thing in the world even if it’s painful in the moment. As bear markets age, valuation tends to become an increasingly important driver of defensiveness. In the bursting of the internet bubble of 2000 for example, emerging equities fell even harder than the S&P 500 in the beginning of the bear market. But in 2001 and 2002, when the S&P 500 fell by a further 31.4%, MSCI Emerging fell only 8.6%, as cheap valuations made the group increasingly resilient to the general selling pressure. And when markets did decisively turn in 2003 and the S&P 500 gained a gratifying 28.7%, Emerging rose a stunning 55.8%. Perfect timing would have seen investors hold their fire in emerging markets in 2001-02 to hit the very bottom. But being two years early made investors far more money than being one year late. Table 2 is a list of the assets/strategies we hold today in our Benchmark-Free Allocation Strategy and where they rank relative to fair value on our harshest “normal” 9 forecast scenario.
Table 2: Current asset valuations and weights in benchmark-free Allocation strategy
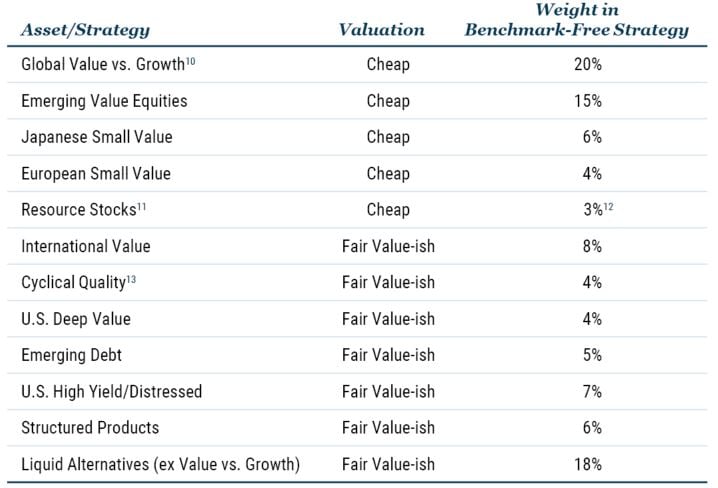
As of 12/31/2022 | Source: GMO
To summarize, we’ve been able to put together a diversified multi-asset portfolio where half of our money is in assets that really do look cheap to us in absolute terms and the other half in assets that look to be around fair value, and achieving a 5% real expected return has gone from close to impossible to doable.
 Given that a year ago there were no traditional assets that looked cheap and only one (emerging value) that even looked fairly priced, that’s a heck of a silver lining from a year most investors would prefer to forget. The legacy of a JOMO year seems a lot better for investors than the sugar high they got from a FOMO market.
Download article here.
Endnotes
For Exhibits 2-5, the expectations provided are based upon the reasonable beliefs of the Asset Allocation team and are not a guarantee. Expectations speak only as of the date they are made, and GMO assumes no duty to and does not undertake to update such expectations. Expectations are subject to numerous assumptions, risks, and uncertainties, which change over time. Actual results may differ materially from those anticipated in the expectations shown in each exhibit.
For Exhibit 6, MSCI data may not be reproduced or used for any other purpose. MSCI provides no warranties, has not prepared or approved this report, and has no liability hereunder. Please visit https://www.gmo.com/americas/benchmark-disclaimers/ to review the complete benchmark disclaimer notice. S&P does not guarantee the accuracy, adequacy, completeness or availability of any data or information and is not responsible for any errors or omissions from the use of such data or information. Reproduction of the data or information in any form is prohibited except with the prior written permission of S&P or its third-party licensors. Please visit https://www.gmo.com/americas/benchmark-disclaimers/ to review the complete benchmark disclaimer notice.
SPACs will probably deserve at least some attention, but they were largely a regulatory arbitrage play, albeit one with some of the most unconscionably egregious fees ever foisted on retail investors. Their existence didn’t require that investors view that fundamentals didn’t matter, just that they believe incredibly optimistic projections of what those future fundamentals might be.
I struggled a bit with these rankings at the margin. “Profoundly FOMO” were assets that were priced at levels that required aggressively rejecting the idea that fundamentals or price matters in investing. “FOMO” were assets where you really had to be so concerned about the risk of the asset going up without you that you ignored your discounted cash flow analysis, but you probably at least did one. “Slightly FOMO” assets were ones where you couldn’t possibly have been excited about the asset on valuation terms but bought it anyway. “Out of Favor (JOMO)” assets were assets/strategies where you had to be willing to ignore or appreciate their trailing underperformance to be willing to invest. “Deeply Out of Favor (Profoundly JOMO)” assets were ones where you needed to crawl over the dead bodies of your consultant and investment committee in order to invest.
The term was apparently invented in 2004 or 2000, depending on who you ask, so it’s perhaps unfair to suggest any year prior to the turn of the millennium might have been a bad year for FOMO. But however badly FOMO assets may have done in 1720 or 1929 or 1932, it’s damn clear you did NOT want to own FOMO assets last year.
All of the forecasts in this series of charts are the forecasts we published at the time. This is not an exercise of hindsight bias.
This is for the “normal” or “full mean reversion” scenario of forecasts. Things looked a bit less dire on the “low” and “ultra-low” scenarios that we now use, but for the purposes of comparing to the earlier periods when we only calculated single scenarios in building our forecasts, it was easier to just use the scenario that corresponded to what we did back then.
I’d love to show a scatterplot from 1982, but GMO’s asset class forecasts started in 1995, so it would just be a back-cast. To give Jeremy Grantham his due, however, he was on the record that year claiming it was a generational opportunity for investors.
At the risk of falling into the “my favorite child” problems, I should also call out our Event-Driven Strategy for having had a nice year as well as offer kudos to the portfolio managers who stuck to their knitting in merger arbitrage when competitors seem to have ventured into areas with a lot more market beta. I have no idea what kind of year 2023 will be in the merger world, but it does seem to be an area where hard work and disciplined portfolio construction generally pay off.
Some of the accelerating increase in expected return is due to the mean-reverting nature of most financial markets, but even ignoring that feature, when a stock market trading at 25x falls by 20%, the earnings yield rises 1%. A market trading at 12.5x falling the same amount gains 2% in earnings yield. The normalized earnings yield is an okay proxy for the market’s imbedded long-term return, so that cheaper asset has acquired about twice as much additional return from the fall as the more expensive one.
Normal doesn’t sound that harsh. In our case we are referring to the world we thought was normal before the turn of the millennium – bonds priced to deliver 2.5-3% real, cash 1-1.5% real, and stocks 5.5-6% real. I like to think of that as “normal,” but most markets have spent most of the last 15 years priced at less appealing levels than these.
If value versus growth were at fair value, there would be at best a small expected return to the trade and therefore it wouldn’t have any obvious place in an investment portfolio. Today’s value spreads are still much wider than normal, so we believe there is still plenty of return left to earn from this trade.
We don’t have an official forecast for resource companies, as so much of their return depends on what happens to commodity prices, and we don’t claim much ability to forecast those under most circumstances. But despite strong returns last year, the valuations of these stocks remain quite attractive both relative to markets and in absolute terms.
Direct allocation to resource stocks not included in other equity portfolios. Other equity groups such as emerging value have substantial holdings of resource companies as well. Our total exposure to the group is 8%, but much of that is double-counting holdings in other pieces of the overall portfolio.
Cyclical quality stocks are also a weird enough group that we haven’t managed to come up with a forecasting methodology for them. But they are a very interesting type of company that deserves a lot more love than investors give them. The very highest quality companies have the lovely feature that they simply don’t go bankrupt or even flirt with it in even the worse economic circumstances. Because that risk is the biggest reason for the equity risk premium in the first place, high quality “deserves” to underperform in the long run, and it doesn’t. Equity-like return for less than equity-like risk is pretty cool. Cyclical quality companies are not quite so bullet-proof. But while their cash flow suffers more in downturns, their higher quality versus their competitors means they can usually take advantage of the rest of their industry’s pain to wind up stronger on the other side of most downturns. Relative to their industries, cyclical quality stocks are both less risky and seem to have higher long-term returns.
It still requires a willingness to look very different from a traditional portfolio, but it no longer requires entirely avoiding traditional assets. A 60%/40% portfolio looks better than it did, but it’s still a long way from 5% real.
Disclaimer: The views expressed are the views of Ben Inker through the period ending January 2023, and are subject to change at any time based on market and other conditions. This is not an offer or solicitation for the purchase or sale of any security and should not be construed as such. References to specific securities and issuers are for illustrative purposes only and are not intended to be, and should not be interpreted as, recommendations to purchase or sell such securities.
Copyright © 2023 by GMO LLC. All rights reserved.
SPACs will probably deserve at least some attention, but they were largely a regulatory arbitrage play, albeit one with some of the most unconscionably egregious fees ever foisted on retail investors. Their existence didn’t require that investors view that fundamentals didn’t matter, just that they believe incredibly optimistic projections of what those future fundamentals might be.
I struggled a bit with these rankings at the margin. “Profoundly FOMO” were assets that were priced at levels that required aggressively rejecting the idea that fundamentals or price matters in investing. “FOMO” were assets where you really had to be so concerned about the risk of the asset going up without you that you ignored your discounted cash flow analysis, but you probably at least did one. “Slightly FOMO” assets were ones where you couldn’t possibly have been excited about the asset on valuation terms but bought it anyway. “Out of Favor (JOMO)” assets were assets/strategies where you had to be willing to ignore or appreciate their trailing underperformance to be willing to invest. “Deeply Out of Favor (Profoundly JOMO)” assets were ones where you needed to crawl over the dead bodies of your consultant and investment committee in order to invest.
The term was apparently invented in 2004 or 2000, depending on who you ask, so it’s perhaps unfair to suggest any year prior to the turn of the millennium might have been a bad year for FOMO. But however badly FOMO assets may have done in 1720 or 1929 or 1932, it’s damn clear you did NOT want to own FOMO assets last year.
All of the forecasts in this series of charts are the forecasts we published at the time. This is not an exercise of hindsight bias.
This is for the “normal” or “full mean reversion” scenario of forecasts. Things looked a bit less dire on the “low” and “ultra-low” scenarios that we now use, but for the purposes of comparing to the earlier periods when we only calculated single scenarios in building our forecasts, it was easier to just use the scenario that corresponded to what we did back then.
I’d love to show a scatterplot from 1982, but GMO’s asset class forecasts started in 1995, so it would just be a back-cast. To give Jeremy Grantham his due, however, he was on the record that year claiming it was a generational opportunity for investors.
At the risk of falling into the “my favorite child” problems, I should also call out our Event-Driven Strategy for having had a nice year as well as offer kudos to the portfolio managers who stuck to their knitting in merger arbitrage when competitors seem to have ventured into areas with a lot more market beta. I have no idea what kind of year 2023 will be in the merger world, but it does seem to be an area where hard work and disciplined portfolio construction generally pay off.
Some of the accelerating increase in expected return is due to the mean-reverting nature of most financial markets, but even ignoring that feature, when a stock market trading at 25x falls by 20%, the earnings yield rises 1%. A market trading at 12.5x falling the same amount gains 2% in earnings yield. The normalized earnings yield is an okay proxy for the market’s imbedded long-term return, so that cheaper asset has acquired about twice as much additional return from the fall as the more expensive one.
Normal doesn’t sound that harsh. In our case we are referring to the world we thought was normal before the turn of the millennium – bonds priced to deliver 2.5-3% real, cash 1-1.5% real, and stocks 5.5-6% real. I like to think of that as “normal,” but most markets have spent most of the last 15 years priced at less appealing levels than these.
If value versus growth were at fair value, there would be at best a small expected return to the trade and therefore it wouldn’t have any obvious place in an investment portfolio. Today’s value spreads are still much wider than normal, so we believe there is still plenty of return left to earn from this trade.
We don’t have an official forecast for resource companies, as so much of their return depends on what happens to commodity prices, and we don’t claim much ability to forecast those under most circumstances. But despite strong returns last year, the valuations of these stocks remain quite attractive both relative to markets and in absolute terms.
Direct allocation to resource stocks not included in other equity portfolios. Other equity groups such as emerging value have substantial holdings of resource companies as well. Our total exposure to the group is 8%, but much of that is double-counting holdings in other pieces of the overall portfolio.
Cyclical quality stocks are also a weird enough group that we haven’t managed to come up with a forecasting methodology for them. But they are a very interesting type of company that deserves a lot more love than investors give them. The very highest quality companies have the lovely feature that they simply don’t go bankrupt or even flirt with it in even the worse economic circumstances. Because that risk is the biggest reason for the equity risk premium in the first place, high quality “deserves” to underperform in the long run, and it doesn’t. Equity-like return for less than equity-like risk is pretty cool. Cyclical quality companies are not quite so bullet-proof. But while their cash flow suffers more in downturns, their higher quality versus their competitors means they can usually take advantage of the rest of their industry’s pain to wind up stronger on the other side of most downturns. Relative to their industries, cyclical quality stocks are both less risky and seem to have higher long-term returns.
It still requires a willingness to look very different from a traditional portfolio, but it no longer requires entirely avoiding traditional assets. A 60%/40% portfolio looks better than it did, but it’s still a long way from 5% real.