Asset Owners Will Need to Tackle Indirect Emissions to Reach Net Zero Targets
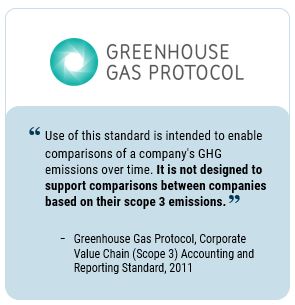
As we look back at the 28th Conference of Parties (COP28) and the global temperature records realized in 2023, it is clear global stakeholders need to do more to address the risk of global warming. To date, public equity owners have focused on scope 1 and scope 2 GHG emissions, a fraction of total emissions, because they are easier to measure and increasingly available. Reported scope 3 data tries to capture indirect emissions. However, since both data quality and reporting inconsistency make reported scope 3 unsuitable for portfolio measurement and management, public equity investors aiming to align with Net Zero face a significant challenge.
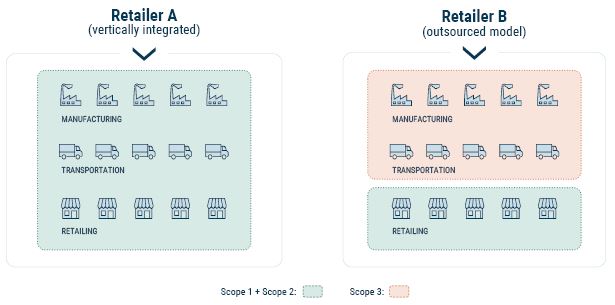
Indirect emissions make up 80%1 of total company emissions, but the bulk of these are missed when asset owners and investors only look at a company’s own activities (scope 1) and purchased power (scope 2). For example, a company like Retailer B in Exhibit 1 that completely outsources its production will have lower scope 1 and scope 2 emissions than a similar vertically integrated company, but may have greater total emissions or a bigger risk exposure that is largely unaccounted for. While Retailer A is accounting for its end-to-end emissions risk and can manage its exposure, Retailer B has merely shifted its risk to its value chain and is unlikely to be mitigating the risk. For asset owners focused on scope 1 and scope 2, Retailer B’s risks are effectively invisible.
Exhibit 1: Looking At Total Emissions Is Essential For Fair Company Comparisons
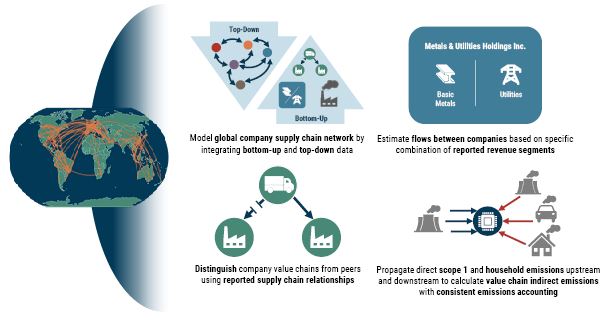
For a complete picture, asset owners and investors must assess end-to-end company value chains, including both upstream and downstream activities. The GMO Indirect Emissions Model integrates a mix of bottom-up and top-down data to address this very meaningful indirect emissions component, as illustrated in Exhibit 2.2
Exhibit 2: GMO Indirect Emissions Model Uses Consistent, Comparable Metrics To End-to-End Value Chains
The GMO Indirect Emissions model allows investors to properly compare companies across their entire value chains. The magnitude of the difference between looking only at scope 1 and scope 2 or total emissions can be tremendous, especially when you consider emissions in conjunction with a size metric like the market cap for sectors such as Resources, Infrastructure, and Transportation as illustrated in Exhibit 3.
Exhibit 3: The Scale Of The Net Zero Challenge Is Clearer When You Look At Total Emissions
Scope 1 + GMO Indirect Emissions vs. Scope 1 & 2
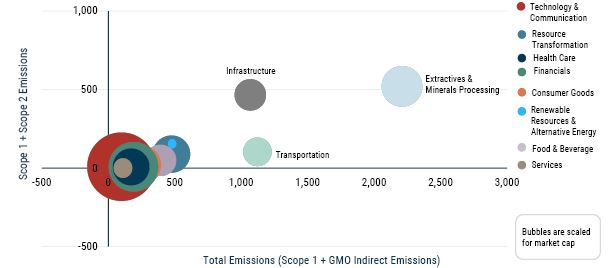
Source: GMO, MSCI, Trucost
GMO developed its Indirect Emissions Model to address the challenge of calculating total emissions and uses it to build the GMO Horizons Strategy,3 which seeks materially lower total emissions than its benchmark. When GMO Horizons targets total emissions, it reduces scope 1 and scope 2 emissions while also avoiding unintended exposures from emissions that would otherwise be hidden in a company’s upstream and downstream activities. When we compare GMO Horizons to MSCI ACWI, total emissions are much higher than scope 1 and scope 2 for both the portfolio and the benchmark, but the total emissions for GMO Horizons are only 50% of the benchmark total emissions.
Exhibit 4: Total Emissions Give A Vastly Different Picture Than Merely Focusing On Scope 1 and Scope 2
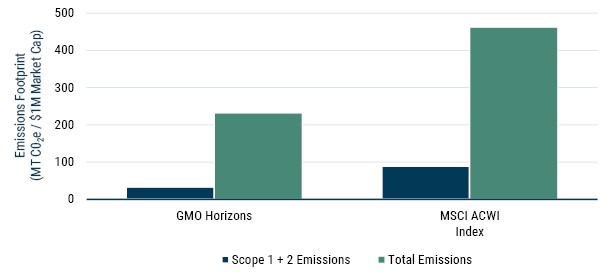
Source: GMO, MSCI, Trucost4
We believe the GMO Horizons Strategy, which leverages our proprietary Indirect Emissions model, is especially well suited for asset owners who want their core equity allocations to contribute positively toward Net Zero targets.
Download article here.
This paper is intended for institutional, accredited investors and qualified purchasers only.
1Source: GMO Indirect Emissions Model calculation as of January 2024.
2For additional details on the GMO Indirect Emissions Model, see Estimating Value Chain Emissions For Portfolio Construction: The GMO Indirect Emissions Model.
3For additional details go to the GMO Horizons Strategy on www.gmo.com or contact your GMO Relationship Manager.
4Emissions intensities computed as of 11/30/2023. Scope 1 and scope 2 emissions data are derived from MSCI and Trucost. Total Emissions is scope 1 and GMO Indirect Emissions combined. Portfolio emissions intensity is the portfolio-weighted average of each company’s emissions intensity, measured in MT CO2e / $1 million market cap. Exposures are based on GMO's hypothetical backtest. holdings. MSCI data may not be reproduced or used for any other purpose. MSCI provides no warranties, has not prepared or approved this report, and has no liability hereunder. Please visit https://www.gmo.com/americas/benchmark-disclaimers/ to review the complete benchmark disclaimer notice.
Disclaimer: The views expressed are the views of the Systematic Equity team through the period ending February 2024, and are subject to change at any time based on market and other conditions. This is not an offer or solicitation for the purchase or sale of any security and should not be construed as such. References to specific securities and issuers are for illustrative purposes only and are not intended to be, and should not be interpreted as, recommendations to purchase or sell such securities.
Copyright © 2024 by GMO LLC.All rights reserved.