Executive Summary
As we enter the first quarter of 2022, we note a striking improvement in Emerging Market local debt valuations supported by historically high levels of real yield differentials while our emerging external debt valuation levels continue to remain in neutral territory.
- External debt valuations continue to remain within the historical range that we consider broadly neutral.
- Within local debt, Emerging Market (EM) currencies continue to remain at attractive levels, having stayed through the quarter at the very top of the neutral range, while the U.S. dollar is approaching stretched territory against most other major Developed Market (DM) currencies. Meanwhile, real interest rate differentials between EM and DM have continued to widen and have reached a historic high as central banks in the EM world have raised rates in response to higher inflation while DM central banks remain behind the curve.
In this piece, we update our valuation charts and commentary, with additional detail on our methodology available upon request.1
External Debt Valuation
The EMBIG-D benchmark spread widened by 12 bps in Q4, ending the quarter at 369 bps. As seen in Exhibit 1, the fair market multiple is the benchmark’s credit spread to the spread that would be required to compensate for credit losses. This ratio rose over the course of the quarter. The multiple stood at 2.8 on December 31, 2021, up from 2.5 on September 30, 2021. We estimate the credit multiple threshold range by analyzing the relationship between the subsequent two-year EMBIG-D credit spread returns and the credit multiple historically. A level that is higher than the upper range of the threshold (currently 2.8) has historically been associated with positive credit returns, while a level below the lower range of the threshold (currently 2.0) is associated more with negative credit returns over the next two-year period. This threshold range estimate is recalibrated on an annual basis. A level within this range would be considered neutral, and the market valuation ended the quarter on the upper end of this neutral range.
Exhibit 1: Long-Term View of the "Fair Market Multiple" for Emerging External Debt
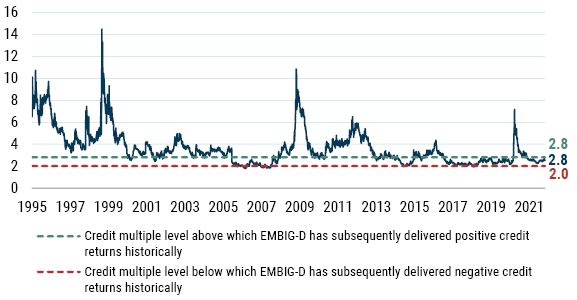
As of 12/31/2021 | Source: GMO calculations based on Bloomberg and J.P. Morgan data
Credit spread widening was part of the reason for the increase in the multiple over the quarter, as the multiple’s denominator – the fair value spread or expected credit loss – fell by 10 basis points to 132 at the end of December. Regular readers will recall that this fair value spread is a function of the weighted-average credit rating of the benchmark, along with historical sovereign credit transition data and an assumption about recovery values given default. In terms of the fourth quarter, the fair value spread was influenced by a downgrade in Ethiopia (CCC+ to CCC in November). Additionally, while Peru, El Salvador, and Turkey were placed on Negative Outlook, Jamaica, Bahrain, and Dominican Republic were placed on Stable Outlook, and Oman and Serbia were placed on Positive Outlook.
The preceding was a discussion of the level of spreads, or credit cushion. From a total return standpoint, the level and changes of the underlying risk-free rate also matters. In the fourth quarter, U.S. Treasury yields were basically unchanged, with the 10-year yield rising by 2 bps and having little impact on benchmark returns. We measure the “cushion” (which we proxy as the slope of the forward curve) in Treasuries by the slope of the forward curve of the 10-year swap rate, depicted by the light-font lines in Exhibit 2. While long-end U.S. Treasury yields were essentially unchanged during the quarter, the slope of the 10-year forward curve flattened, from 47 bps to 24 bps as of the end of December. This indicates the market is pricing in less of a cushion for rising rates, as the forward curve represents the path that would make an investor indifferent to holding Treasuries and cash. We view the decline slope as reducing the prospective valuation of risk-free rates relative to the previous quarter.
Exhibit 2: 10-Year U.S. Treasury Swap Curves at Quarterly Intervals
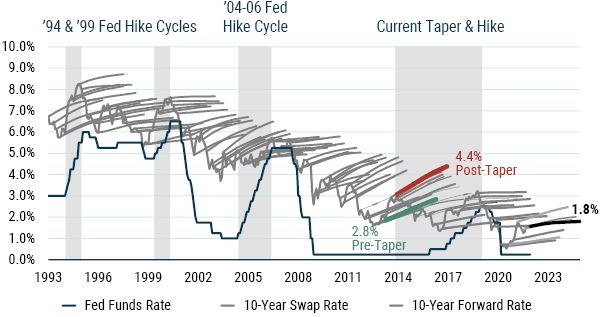
As of 12/31/2021 | Source: GMO
Local Debt Markets Valuation
In local EM markets, we use a similar valuation metric to consider the relative attractiveness of the asset class. While our overall GBI EM FX return barometer continues to show improvement approaching the top end of the neutral territory, a widening real yield differential and attractive USD valuations support a strong outlook for local EM FX more so now than in the past decade.
Exhibit 3 shows a time series of our EM FX model estimate of the GBI-EMGD benchmark’s spot FX valuation. Recall that our model analyzes trends in macroeconomic fundamentals such as balance of payments composition and flows, valuation of the currency, and the economic cycle. It uses regression analysis to produce an estimate of total expected FX returns for each country in the benchmark. These are then combined into a single value of a total expected FX return using a market cap weighted average of currencies in the benchmark. Next, we deduct the carry (interest-rate differential) from the estimated value of total FX expected return (both aggregated proportionally to market cap and index levels) to get to an expected EM FX spot return for GBI-EMGD. Finally, we estimate a neutral range based on the backtest of the overall model to assess whether EM currencies are cheap, rich, or fairly valued. A value that is higher (lower) than the upper (lower) value of the neutral range could potentially indicate “cheap” (“rich”) currencies. A value that is within the neutral range would be considered “fair.” EM currencies, though not outright cheap, ended December on the cheap end of the neutral range while remaining very attractive relative to the past 10-year average. When we decompose our EM FX valuation signal into proxies of its three components (long-term valuation, balance of payment, and economic cycle), we find that EM FX is cheap from a long-term valuation perspective and very cheap from a balance of payment perspective. What is holding EM FX back somewhat versus the pre-2008 period is the lower growth and higher inflation environment. But as growth recovers and inflation begins to come down, we are mindful that this pillar could also turn around.
Exhibit 3: GBI-EMGD Expected Spot FX Return Given the Fundamentals
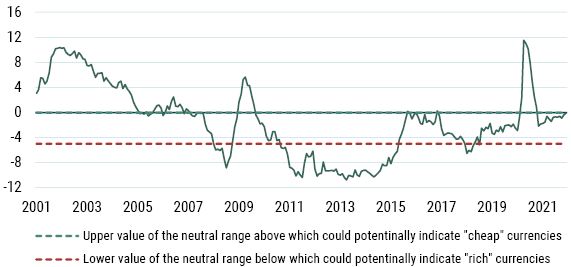
As of 12/31/2021 | Source: GMO
As for EM local interest rates, we consider differentials in real yields to gauge the relative attractiveness of EM against DM (see Exhibit 4). In this regard, the story that has been in place for many quarters (years, actually) remains as we can still see a substantial positive gap between EM and DM real yields. In fact, emerging real yields look even more attractive on a relative basis against DM as that gap even widened further in Q4, when emerging real yields rose by 14 bps to 2.47%. Specifically, the spread between EM and U.S. real yields widened by 89 bps during the quarter, to an all-time high of 507 bps, while the spread between EM and G3 widened by 68 bps to 442 bps. This gap widened substantially as EM central banks have hiked their main rates in response to higher inflation while DM central banks have stayed muted. Having been fairly stable for several years running, the 5-year average of the spread between EM and U.S. real yields rose in Q4, from 234 bps to 245 bps. By our calculations, the real yield in the U.S. fell to -2.6% in December from -1.8 % in September, while the European real yield and the Japanese real yield also remained in negative territory.
Exhibit 4: Inflation-Adjusted Bond Yields
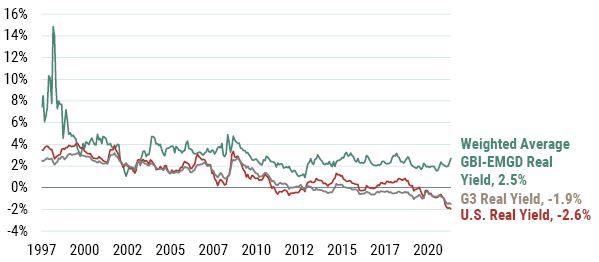
As of 12/31/2021 | Source: GMO
Liquidity
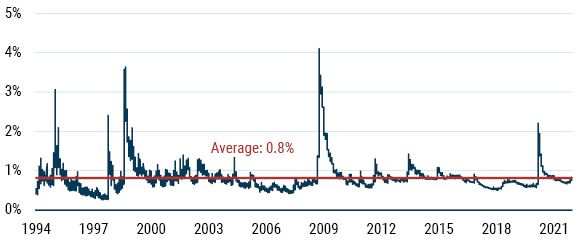
One key feature of EM is low baseline and occasionally very poor liquidity. We consider this a feature of EM and GMO’s portfolios seek to manage this risk while extracting well compensated illiquidity premia as appropriate. We note that despite the significant volatility in spreads around the initial Covid-19 shock, overall bid-ask spreads have normalized and continue to indicate stable liquidity conditions (see Exhibit 5).
We correctly anticipated in the Q1 2020 version of this missive that the stabilization of bid-ask spreads following the impact of the Covid-19 pandemic and oil shocks would be quicker relative to prior crises. Both our external debt and local currency debt strategies emphasize instrument selection and tend to own securities with a lower liquidity profile than the benchmark. We are long-term oriented investors and liquidity providers in this type of market, and our process is able to identify dislocations and opportunities to pick up attractively-priced securities. We believe this approach positions us well for alpha versus our benchmarks going forward.
Exhibit 5: EMBIG-D Bid-Ask Spread (% of price), Since December 1993
As of 12/31/2021 | Source: GMO
Investing from a Non-USD Perspective
The preceding discussion addresses asset class valuations from a USD-based investor’s perspective. For investors from other perspectives, below we discuss the valuation of the USD relative to the EUR, CAD, and AUD (Exhibit 6) as well as current hedging costs (Exhibit 7). We note that hedging costs have generally declined for all major base currencies and been generally quite stable through the extraordinary macro conditions of the past year. Currently, we view all three major non-USD base currencies as becoming increasingly cheap. This also points to the fact that the USD looks expensive pretty much against all other DM currencies. Our fixed income quantitative team sees this as a signal of a potential long-term downward trend of the USD based on its long-term PPP valuation model.
In summary, we view the overall outlook as continued neutral levels for EM external debt but call attention to a particularly stronger outlook relative to recent history for local EM FX. Our signals point to attractive valuation and balance of payments levels for EM supported by strong real yield differentials for EM relative to DM. Last, a stretched USD valuation suggests a secular downward trend with related expected stronger EM currency valuations.
Exhibit 6: Historical Currency Valuation since 2001
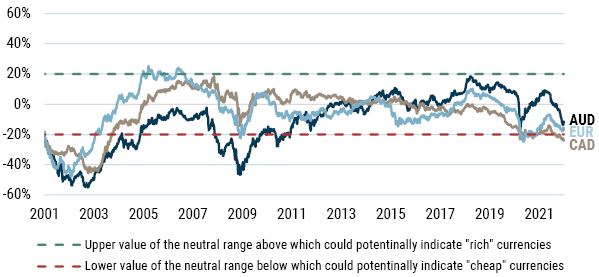
As of 12/31/2021 | Source: Bloomberg, J.P. Morgan, GMO
Exhibit 7: Annual Roll Yield Difference when Hedging USD to AUD, CAD, and EUR Base
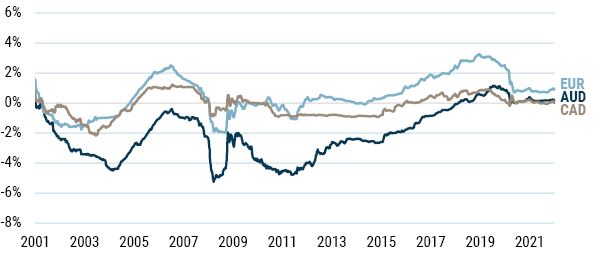
As of 12/31/2021 | Source: Bloomberg, J.P. Morgan, GMO
Download article here.