Executive Summary
Second quarter 2022 EMD returns reflected the continued deterioration of global economic and market conditions:
- Hard Currency Debt EMBIG-D index was down -11.4%; index losses were driven by widening credit spreads and the upward trend in U.S. Treasury yields
- Local Debt GBI-EMGD index was also down, by -8.6%, as both currency returns (-5.4%) and local rates (-3.2%) produced losses during the quarter
As we enter the third quarter of 2022 our valuation metrics for emerging debt are more compelling than they were at the beginning of the quarter:
- Hard currency debt valuations improved considerably and are at very attractive levels, though adjusting our assumptions with regard to current credit ratings implies moderately attractive to neutral valuations.
- Emerging Currencies are currently within the neutral range of fair value as growth and inflation forecasts muddy attractive long-term valuation signals.
- Real interest rate differentials between Emerging Markets (EM) and Developed Markets (DM) tightened marginally as both EM and DM rates sold off.
In this piece, we update our valuation charts and commentary, with additional details on our methodology available upon request. 1
External Debt Valuation
The EMBIG-D benchmark spread widened by 142 bps in Q2, ending the quarter at 542 bps. As seen in Exhibit 1, the fair market multiple is the benchmark’s credit spread to the spread that would be required to compensate for credit losses. This ratio rose over the course of the quarter. The multiple stood at 4.4 on June 30, 2022, up from 3.0 on March 31, 2022. We estimate the credit multiple threshold range by analyzing the relationship between the subsequent two-year EMBIG-D credit spread returns and the credit multiple historically. A level that is higher than the upper range of the threshold (currently 2.8) has historically been associated with positive credit returns, while a level below the lower range of the threshold (currently 2.0) is associated more with negative credit returns over the next two-year period. This threshold range estimate is recalibrated on an annual basis. A level within this range would be considered neutral, and the market valuation ended the quarter above the upper end of this neutral range.
Exhibit 1: Long-Term View of the "Fair Market Multiple" for Emerging External Debt
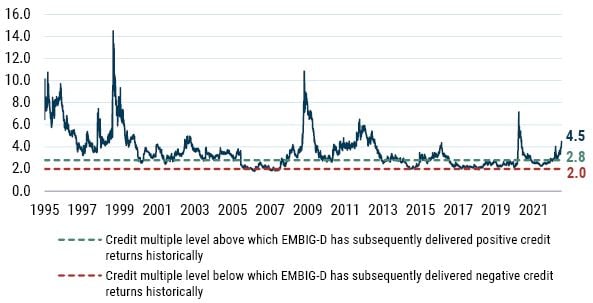
As of 6/30/2022 | Source: GMO calculations based on Bloomberg and J.P. Morgan data
Credit spread widening was the main driver for the increase in the multiple over the quarter, as the multiple’s denominator – the fair value spread or expected credit loss – fell by 16 bps to 122 at the end of June. Regular readers will recall that this fair value spread is a function of the weighted-average credit rating of the benchmark, along with historical sovereign credit transition data and an assumption about recovery values given default. 2 In terms of the second quarter, the sharp overall increase in market spreads this is an undesired and unintuitive result. The conditions when this happens are a combination of: 1) spreads selling off more in riskier countries, which reduces their relative duration weighted membership in the index and results in a lower aggregate expected default loss for the index; and 2) spreads increasing rapidly without any change in underlying credit ratings.
In case this latter issue was material, we performed an exercise similar to one we did in the initial stages of the pandemic. In 2020 following the sharp pandemic-related rise in emerging spreads, we asked the question: could it be that credit ratings have yet to adjust to the new macroeconomic reality? In that case we figured the denominator in our credit multiple might be temporarily depressed, thus inflating the credit multiple. In response we contemplated “moderate” and “extreme” shocks to credit ratings and examined their effects on our final calculation. This quarter we performed a similar exercise, imagining one- and two-notch downgrades across the board to each country in the index. In the first, more moderate case, the credit multiple declines from 4.5 to 3.5, still well into territory that has historically been associated with a high probability of positive future spread returns. In the second, more extreme case, the multiple falls to 2.5, situated between our two thresholds and suggesting neutral valuations. This implies well supported current valuation multiples, since unlike the pandemic ratings agencies should be less “surprised” by the current environment.
In rates, U.S. Treasury yields rose sharply, and the curve flattened during the quarter, with the 10-year yield rising by 67 bps and having a negative impact on benchmark returns. We measure the “cushion” (which we proxy as the slope of the forward curve) in Treasuries by the slope of the forward curve of the 10-year swap rate, depicted by the light-font lines in Exhibit 2. Long-end U.S. Treasury yields trended upward during the quarter, and the slope of the 10-year forward curve ended the quarter at 5 bps, 12 bps higher than the inverted -7 bps of the prior quarter (the entire curve shifted higher by about 70-80 bps). This indicates the market is pricing in less of a cushion for rising rates, as the forward curve represents the path that would make an investor indifferent to holding Treasuries and cash. We view the decline in slope as reducing the prospective relative valuation of 10-year risk-free rates versus cash relative to the previous quarter.
Exhibit 2: 10-Year U.S. Treasury Swap Curves at Quarterly Intervals
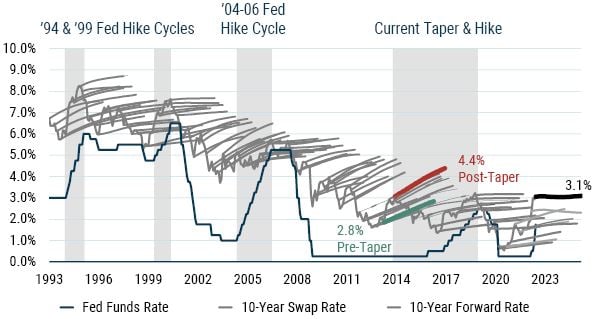
As of 6/30/2022 | Source: GMO
Local Debt Markets Valuation
In local EM markets, we use a similar valuation metric to consider the relative attractiveness of the asset class. Our overall GBI EM FX return barometer reversed course over the quarter and is improved toward the mid-point of the neutral range. The sharper depreciation of EM currencies in the second quarter as risk-off sentiment rose led to more attractive long-term valuation (first pillar of the model). On the other hand, the real yield differential with G3 rates, while lower than in previous quarters, remains wide, and USD valuations continue to be supportive for local EM FX.
Exhibit 3 shows a time series of our EM FX model estimate of the GBI-EMGD benchmark’s spot FX valuation. Recall that our model analyzes trends in macroeconomic fundamentals such as balance of payments composition and flows, valuation of the currency, and the economic cycle. It uses regression analysis to produce an estimate of total expected FX returns for each country in the benchmark. These are then combined into a single value of total expected FX return using a market cap-weighted average of currencies in the benchmark. Next, we deduct the carry (interest-rate differential) from the estimated value of total FX expected return (both aggregated proportionally to market cap and index levels) to get to an expected EM FX spot return for GBI-EMGD. Finally, we estimate a neutral range based on the backtest of the overall model to assess whether EM currencies are cheap, rich, or fairly valued. A value that is higher (lower) than the upper (lower) value of the neutral range could potentially indicate “cheap” (rich”) currencies. A value that is within the neutral range would be considered “fair.” EM currencies ended June in the middle of the neutral range. When we decompose our EM FX valuation signal into proxies of its three components (long-term valuation, balance of payment, and economic cycle), we still find that EM FX is cheap from a long-term valuation perspective and slightly cheap from a balance of payment perspective. What continues to hold EM FX back somewhat versus the pre-2008 period is the lower growth and higher inflation environment, as mentioned above (economic cycle pillar of the model). But as growth recovers and inflation begins to come down, we are mindful that this pillar could also turn around.
Exhibit 3: GBI-EMGD Expected Spot FX Return Given the Fundamentals
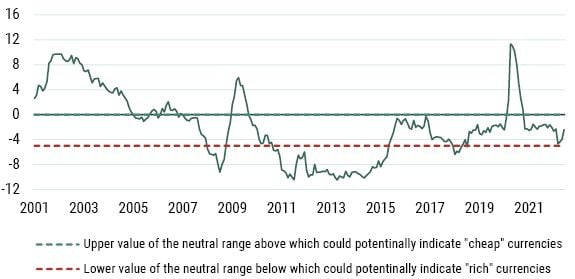
As of 6/30/2022 | Source: GMO
As for EM local interest rates, we consider differentials in real yields to gauge the relative attractiveness of EM against DM (see Exhibit 4). In this regard, the story that has been in place for many quarters (years, actually) remains as we can still see a substantial positive gap between EM and DM real yields. However, that gap tightened during the quarter as emerging real yields rose by 32 bps to 2.04%. Specifically, the spread between EM and U.S. real yields tightened by 46 bps during the quarter to 449 bps, while the spread between EM and G3 tightened by only 1 bp to 339 bps. Having been stable for several years, the 5-year average of the spread between EM and U.S. real yields rose in Q2, from 259 bps to 271 bps. By our calculations, the real yield in the U.S. rose by 79 bps to -2.5% in June from -3.2% in March, while the European real yield and the Japanese real yield also remained in negative territory.
Exhibit 4: Inflation-Adjusted Bond Yields
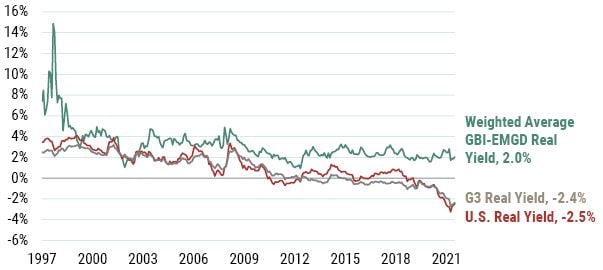
As of 6/30/2022 | Source: GMO
Liquidity
One key feature of EM debt is low baseline and occasionally very poor liquidity. We consider this a feature of EM and GMO’s portfolios seeking to manage this risk while extracting well-compensated illiquidity premia as appropriate. We note that while significant volatility in spreads occurred around the initial shock of Russia’s invasion of Ukraine in February, overall bid-ask spreads have since normalized and continue to indicate elevated transactions costs conditions (see Exhibit 5).
Exhibit 5: EMBIG-D Bid-Ask Spread (% of price), Since December 1993
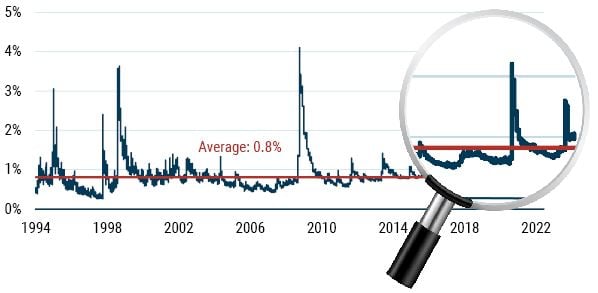
As of 6/30/2022 | Source: GMO
Investing from a Non-USD Perspective
The preceding discussion addresses asset class valuations from a USD-based investor’s perspective. For investors from other home currencies, we discuss the valuation of the USD relative to the EUR, CAD, and AUD (Exhibit 6) and current hedging costs (Exhibit 7). We note that while hedging costs for EUR have risen, hedging costs for AUD and CAD have been generally quite stable through the extraordinary macro conditions of the past year. Currently, we view all three major non-USD base currencies as becoming increasingly cheap. This also points to the fact that the USD looks expensive against largely all other DM currencies. Our fixed income quantitative team sees this as a signal of a potential long-term downward trend of the USD based on its long-term PPP valuation model.
In summary, we note the favorable credit environment for external debt but emphasize the uncertainty of current events and rate movements on this outlook. The EM FX valuation outlook offers a mixed picture, given EM FX looks cheap from a pure valuation (Pillar 1) and still slightly cheap from a balance of payment (Pillar 2) perspective but expensive from an economic cycle’s perspective (Pillar 3). Lastly, a stretched USD valuation could suggest a secular downward trend with the related medium-term expectations of stronger EM currency valuations down the road. Finally, real yield differentials for EM relative to DM, while lower remain wide versus history, making EM local debt relatively attractive from that perspective.
Exhibit 6: Historical Currency Valuation since 2001
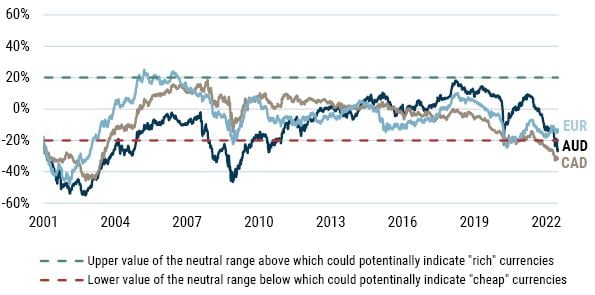
As of 6/30/2022 | Source: Bloomberg, J.P. Morgan, GMO
Exhibit 7: Annual Roll Yield Difference when Hedging USD to AUD, CAD, and EUR Base
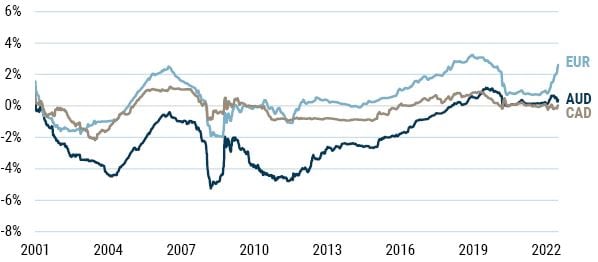
As of 6/30/2022 | Source: Bloomberg, J.P. Morgan, GMO
Download article here.
Subscribe to GMO Research
For more detail on the methodologies referred to throughout this piece, please contact your GMO representative.
We are assuming a 25% recovery rate in a default state, which is the same for both sovereigns and quasi-sovereigns. We’ve recently enhanced this process to accurately reflect the ratings of quasi-sovereign issuers instead of assuming sovereign ratings for all benchmark constituents. The overall effect is minor given the small percentage of quasi-issuers that have a different rating than the sovereign. Specifically, to calculate the weighted-average credit ratings of the benchmark, the bonds for each country are first divided into sovereign and quasi-sovereign categories. For each quasi-sovereign issuer, we use the S&P credit ratings specific to that entity if available; otherwise, its corresponding sovereign credit ratings are used. The weighted average is a market-value weighted average of these individual ratings corresponding to each bond.