Long Cheap Value/Short Expensive Growth Opportunities Remain Compelling Across Countries 1
Ratio of Price/Fair Value for Cheap Stocks Relative to Expensive Stocks
As of 5/31/2022 | Source: MSCI, GMO
The market has spent much of 2022 worrying about inflation and associated interest rate rises, and Growth stocks have certainly borne the brunt of this. With MSCI ACWI Growth down an ugly 21% for the first five months of the year and MSCI ACWI Value having only fallen 4%, we are increasingly being asked whether it is too late to invest in GMO’s Equity Dislocation Strategy.
Although it appears that the long cheap Value/short expensive Growth train has indeed left the station, we believe that there is still plenty of track remaining before it reaches its destination. At least until very recently, the insatiable desire for Growth equities had pushed valuation disparities to levels not seen since the peak of the Internet bubble. Unlike that period, however, this one has permeated much more widely, touching all sectors (as we wrote about in April) and all countries.
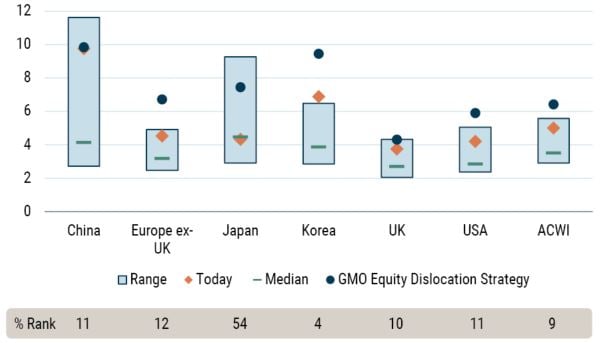
The chart above shows the opportunity set at the end of May using GMO’s “Price to Fair Value” (P/FV) ratio, the valuation metric underlying the Equity Dislocation Strategy. We have simply divided the average P/FV of the most expensive fifth of stocks by the average P/FV of the cheapest fifth of stocks within each country/region, showing where we are today compared to the median value (and an indication of the range of values) through history.
Looking at MSCI ACWI as a whole, the ratio of Price to Fair Value for cheap stocks relative to expensive stocks sits at the 9th percentile since 1990. This indicates that there is still a tremendous amount of scope for cheap to outperform expensive in order to return to a more normal valuation differential.
Although there are a couple of exceptions, it is heartening to see that the opportunity remains broad based across the globe, with the majority of the world exhibiting a spread of valuations around the 10th percentile. Our Equity Dislocation Strategy focuses on the extremes of valuation and so, in most cases, the blue dot, which represents the shorts/longs in the Strategy, is meaningfully higher than the more broad-based country or region metric.
Growth has meaningfully underperformed Value since we launched the Equity Dislocation Strategy in late 2020, but, while the bubble has deflated somewhat, it has yet to fully burst. The starting spread was so extreme that we believe there is considerable reversion still required to get close to a reasonable level, and that is why Equity Dislocation remains the largest and highest-conviction position in our unconstrained Multi-Asset portfolio.
Download article here.
A few specific points of interest on the chart:
- The extremely wide spread in Korea is being driven by a handful of egregiously expensive stocks, including the stock with the highest P/FV ratio in the whole ACWI index.
- The expensive/cheap spread in Japan looks about normal relative to history, but this is somewhat distorted by very high spreads in the 1990s in the wake of the Great Bubble.
- In China, the wide spread is primarily being driven by very cheap stocks and not that many outrageously expensive names, so the holdings in Equity Dislocation are more representative of the broad opportunity set.
Chart note: The P/FV ratio is the average P/FV of the most expensive quintile of each country in the ACWI index divided by the P/FV of the cheapest quintile, with P/FV weighted by the square root of market cap and using harmonic mean. The range of each country captures the 5th percentile to 95th percentile of outcomes through history. The data runs from January 1990 to May 2022 (except for Korea which starts in January 1992 and China which starts in September 1996). For the GMO Equity Dislocation Strategy, we are showing the ratio of the average P/FV of the short side of the Equity Dislocation Strategy over the long side of the Equity Dislocation Strategy. Averages are calculated using harmonic means based on the optimized portfolio at the start of June 2022.
MSCI data may not be reproduced or used for any other purpose. MSCI provides no warranties, has not prepared or approved this report, and has no liability hereunder. Please visit https://www.gmo.com/americas/benchmark-disclaimers/ to review the complete benchmark disclaimer notice.
Disclaimer: The views expressed are the views of the GMO Asset Allocation team through the period ending June 2022, and are subject to change at any time based on market and other conditions. This is not an offer or solicitation for the purchase or sale of any security and should not be construed as such. References to specific securities and issuers are for illustrative purposes only and are not intended to be, and should not be interpreted as, recommendations to purchase or sell such securities.
Copyright © 2022 by GMO LLC. All rights reserved.
A few specific points of interest on the chart:
- The extremely wide spread in Korea is being driven by a handful of egregiously expensive stocks, including the stock with the highest P/FV ratio in the whole ACWI index.
- The expensive/cheap spread in Japan looks about normal relative to history, but this is somewhat distorted by very high spreads in the 1990s in the wake of the Great Bubble.
- In China, the wide spread is primarily being driven by very cheap stocks and not that many outrageously expensive names, so the holdings in Equity Dislocation are more representative of the broad opportunity set.