We Believe Value Remains Priced for Continued Outperformance
Over the past decade it has seemed like Value investors have been very much left on the sidelines, bemoaning rampant speculation and valuations untethered from fundamental reality, while Growth investors have, quite frankly, been living it up in some style.
There was a meaningful reversal in Q1 2022, when the MSCI ACWI Value index beat its Growth counterpart by an impressive 8.8%. Amazingly, after this one (admittedly strong) quarter, we have started to get the odd question as to whether the Value versus Growth reversal has played out. Despite a late-quarter surge in Growth aided by the return of retail investor enthusiasm, the answer is an emphatic “No!”
From the beginning of 2009 through the end of 2021, the MSCI ACWI Value index returned a commendable 9.2% per annum. However, MSCI ACWI Growth left Value trailing in the dust over the period, delivering a staggering 14.5% per annum and out-compounding Value by an eye-watering 265% cumulatively. Some might argue that Growth companies have done fundamentally well (yes, a small number of companies have done spectacularly well, but they steal the headlines) or that the world has changed somehow. As we’ve written about previously, we disagree with that sentiment.
In reality, the reversal barely puts a dent in the differential. Looking at it one way, the exhibit below shows the Value opportunity set at the end of March using GMO’s own “Price to Fair Value,” the valuation metric underlying our Equity Dislocation Strategy. In the chart, we calculate the ratio of the most expensive third of stocks divided by the cheapest third of stocks within each sector (based on Price to Fair Value) and compare today’s valuation to history.
Excellent opportunity set across sectors
The ratio of the P/FV of the most expensive tercile over the cheapest tercile by sector
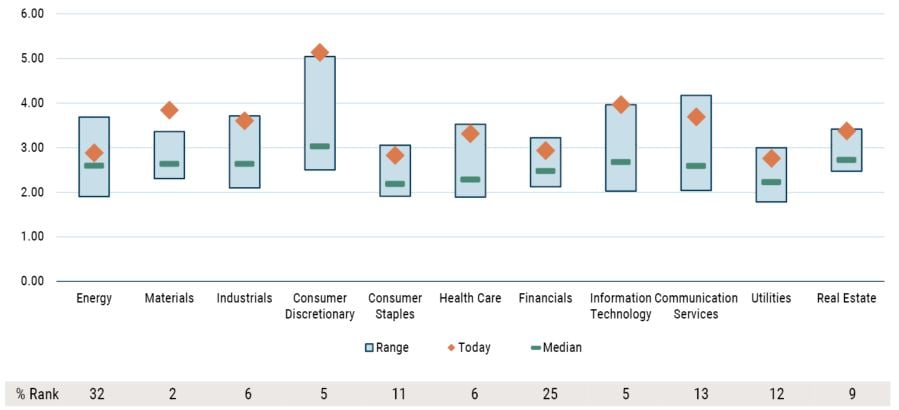
As of 3/31/2022 | Source: MSCI, GMO
The P/FV ratio is the average P/FV of the most expensive tercile of each sector of the ACWI index divided by the P/FV of the cheapest tercile, with P/FV calculated relative to country, weighted by the square root of market cap and using harmonic mean. The range of each sector captures the 5th percentile to 95th percentile of outcomes through history. The data runs from January 1990 to March 2022 (except for Real Estate which runs from September 2016 to March 2022). MSCI data may not be reproduced or used for any other purpose. MSCI provides no warranties, has not prepared or approved this report, and has no liability hereunder. Please visit https://www.gmo.com/americas/benchmark-disclaimers/ to review the complete benchmark disclaimer notice.
The differential between Value and Growth has modestly tightened since the end of December, but the key tenets of our investment thesis still stand:
- The spread in the majority of sectors remains in the most exciting 10% of history.
- We can enhance the potential to generate returns by focusing on the valuation extremes rather than just considering the top and bottom terciles.
- The broad opportunity set offers investors the ability to build an extremely diversified portfolio to capture the compelling Value proposition without having to worry about whether a sector is “Growth” or “Value.” The opportunity is not just “Banks versus Information Technology.”
The Value-Growth dislocation remains the highest conviction position for GMO’s Asset Allocation team. Our flagship Benchmark-Free Allocation Strategy continues to maintain about a 20% allocation to Equity Dislocation.
Download article here.