Executive Summary
The performance of U.S. value over the last decade has led many to wonder whether the value premium has been completely eroded. We analyze this question by decomposing the relative returns of cheap stocks in order to understand what has driven this change in performance. Our return decomposition suggests value stocks’ performance erosion can be evenly attributed to a reduction in the value premium and a widening of the value spread. Though value might deserve to trade at a greater discount today due to the market’s current dynamics, we believe that cheap stocks are still likely to deliver a premium and are therefore well-positioned to outperform the broad market.
Introduction
Whatever price multiple of which you are a fan, whichever sectors you exclude, however you neutralize your exposures, whether you equal-weight or cap-weight, one thing remains true: cheap stocks have had an unhappy decade.1 In some cases – as with sector-neutral value – they have only disappointed relative to previous outperformance. In others, such as the traditional Fama-French “HML” factor, mild disappointment would be a welcome change of pace. This is made clear in Exhibit 1, which depicts the total return of HML (currently 34% below its peak) and the length of each of its drawdowns (the most recent one has passed the 10-year mark).
Exhibit 1: HML Total Return and Drawdown Length
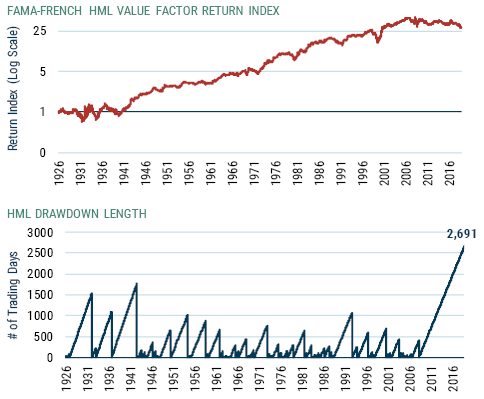
As of 5/31/19 | Source: Kenneth French, GMO
Many explanations have been given for the disheartening performance of value in the post-GFC world. Some researchers contend that value previously earned above-average returns because investors extrapolated poor fundamental growth too far into the future, and that said behavioral bias has now come undone. Others believe that the commoditization of “smart beta” has led to factor crowding, and that this has eroded the value premium. A third camp believes that something more fundamental, such as increased concentration, has made growth companies inherently more competitive and put value companies at a structural disadvantage. And then there are those who think that nothing has truly changed, that the value premium is alive and well, and that in time the humble shall be exalted.
Each of the arguments above has some intuitive appeal. Consider the behavioral story. As investors become more sophisticated and biases get uncovered, those who exhibit these biases should suffer losses and become a smaller part of the market, while those who profit from them should become proportionately more relevant to price formation. As a result, if the value premium is a “pure” behavioral story, we would expect it to erode as it becomes better known. A similar version of this argument applies when we think of factor crowding. Even if the value premium was a rational compensation for some risk to which investors became exposed when they bought into cheap stocks, a sudden change in market preferences (due to, say, passive rules-based vehicles) would likewise change the required rates of returns for these stocks.
It is also possible that the underperformance of value stocks has been caused by an unexpected2 fundamental shock; a negative shift in the profitability of cheap companies, for instance. If value companies’ low margins and undergrowth has been more pronounced and persistent than expected, their returns would naturally surprise on the downside. In a world where uncertainty abounds and professional investors are cautious to claim that the world is different, an unexpected fundamental shift could lead to the protracted underperformance of a certain kind of asset as people slowly adapt to the new regime. In this world, once the fundamental shift has been fully digested, we would go back to expecting the outperformance of value stocks.
Finally, there is the possibility that nothing has really changed. Markets are volatile, and the financial historians among us will be quick to note that value investors have agonized over lurid performance in the past. After all, if value is a risk factor, then it should not be entirely surprising that there is a cost associated with the added compensation provided by investing in low multiple stocks. If this is true, giving up on value after a period of marked underperformance is perhaps the worst thing that a manager could do.
The correct diagnosis of value’s malaise is an important exercise, as is underscored by the strikingly dissimilar implications that follow for the factor’s future. To this effect, we at GMO have done some work decomposing the relative returns of value (relative to the broad market, that is) in the United States, looking at which drivers of returns have seen the biggest changes between the 1981-2005 timeframe and the period that followed. Our decomposition looks at changes to returns as a function of four factors: growth, income, rebalancing,3 and valuations.
In summary, our results suggest that – for most agreed-upon value definitions – the drags on performance are much the same. To a value investor’s relief, atypical undergrowth is not the culprit. The blame, in fact, is to be shared (albeit not equally) between the other three drivers of returns. Income differentials have waned because valuations have risen, leading to compressed yields. Rebalancing has been less of a return engine as growth companies have seen more persistent profitability and higher multiples, leading to fewer new value opportunities. And valuations themselves have played a large role, with the value group’s multiple expansion trailing the market’s, especially over the last few years.
Given our findings, we are loath to say that nothing has changed for value over the last decade; there is some evidence that, going forward, the value premium might not be as pronounced as it has been in the past. That said, value’s current discount is wide. Though there are rational explanations for value to trade at a greater discount today than it does usually, we believe that cheap stocks are somewhat undervalued and therefore poised to deliver decent excess returns going forward.
Decomposing Returns
Value groups are generally formed on the basis of a ratio of price to some measure of economic capital. Though early academic work focused on simple accounting metrics such as book and earnings to gauge how cheap a stock is, practitioners have frequently beaten up on these proxies for intrinsic value, making careful adjustments to regular accounting metrics to get a better sense of what companies should really be worth. GMO is no exception, and researchers on our Global Equity team have put a great deal of effort into improving how we as a firm define “value.” Our analysis therefore focuses on a simplified version of our proprietary definition of the cheap cap-weighted half of the U.S. market, ex-financials.4 For the sake of this study, we are not sector-neutralizing. Regardless, our results are qualitatively quite similar when we sort stocks on regular price-to-book, when we include financials in the analysis, when we look at quintiles instead of halves, and when we sector-adjust.
In Exhibit 2, we decompose the relative returns of value, distinguishing between a period when value’s relative returns were strong (1981-2005) and the disappointing 13 years that followed.
Exhibit 2: U.S. Value’s Relative Return Decomposition
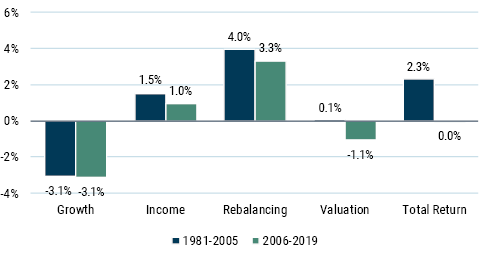
Source: Worldscope, Compustat, MSCI, GMO
Being long value has felt quite different since 2006.5 The healthy 230 bps of outperformance that cheap companies churned annually from 1981 to 2005 has dissipated, with only 4 of the past 13 years seeing value outdo the broad market. Although these middling results have been driven in large part by the widening in relative valuations6 (-110 bps per annum), poor relative pricing is not the only source of blame. The added income earned by value investors through the combination of net repurchases and dividends has had less oomph in this period of elevated multiples, costing about 50 bps of relative performance every year relative to earlier history.7
We also need to consider the variation in gains from turnover in the value group – what we call the rebalancing effect. Because value investors sell out of stocks that have become more expensive and buy into stocks that have become cheaper, the changes in multiples to the value cohort underestimate the true gains reaped by investors from multiple expansion.8 The rebalancing effect corrects this by measuring precisely the amount stocks involved in portfolio turnover contributed to returns through multiple expansion or reduction. This effect, which has been a powerful driver of returns to cheap stocks, providing almost 4% points of return in the early period, has become smaller by about 60 bps.
Growth
The one aspect of value companies that has been practically unchanged is their fundamental growth.9 As would be expected, cheap companies have generally undergrown the market (on our data, by about 300 bps per annum), and the recent period has been quite unexceptional. Though a structural shift might have occurred in the market landscape, there is no indication that such a shift has disproportionately hurt cheap companies’ historical growth.
Previous fundamental growth might mask some unsustainable practice that the constituents of the value group could be engaging in to prop up their numbers, however. Value stocks could be ramping up their leverage and investing in risky or unprofitable projects, for instance. When GMO’s Asset Allocation team looks at the relative quality of value, however, this doesn’t seem to hold; value’s quality today is at parity with that of the broad market, and in relative terms it is above its early sample average (0.98).10 At least on our definitions, value and junk are not commingled (see Exhibit 3).
Exhibit 3: U.S. Value Relative Quality
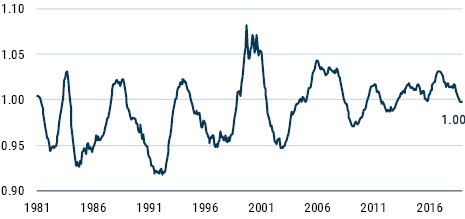
Source: Worldscope, Compustat, MSCI, GMO
Our quality metric is founded on three pillars: leverage, which attempts to measure the capacity of companies to repay their obligations; profitability, which looks at how effectively companies deploy their capital; and the volatility of profitability, which measures the consistency of companies’ income streams. A company that has a high capacity for repaying its obligations as well as an effective and stable use of capital is, by our definition, “high quality.” And from a relative perspective, value seems to be higher quality today than it was up to 2005 on all our quality pillars (see Exhibit 4).
Exhibit 4: U.S. Value Relative Quality Breakdown
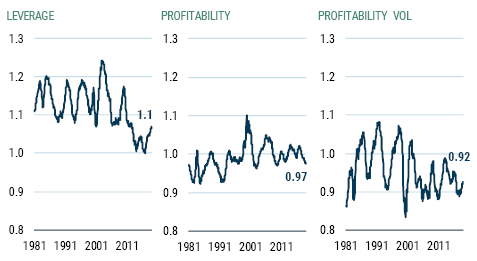
Source: Worldscope, Compustat, MSCI, GMO
It might be that our quality metric misses something important. Market expectations of fundamentals are another way to evaluate whether value companies are doing something anomalous. If value’s pattern of undergrowth has been kept stable artificially, we would expect analysts to predict poor relative growth going forward. Although this would not affect historical growth numbers, it might justify the higher discount at which value trades today. Exhibit 5, inspired by some work done by Asness et al. during the tech bubble,11 shows analyst long-term (3- to 5-year) EPS expectations for value against the market.12 What it makes clear is that analyst expectations for value companies today are far from looking problematic.
Exhibit 5: U.S. Value’s Expected Undergrowth
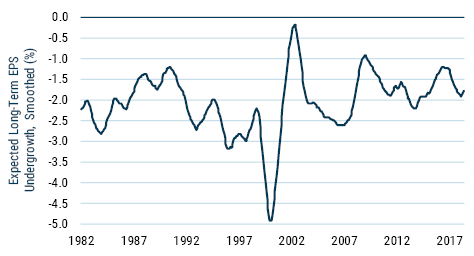
Source: IBES, GMO
All in all, growth does not seem to be any more of an issue for value stocks than it has ever been. Though cheap companies grow less than the market, this is not a new phenomenon. Moreover, these stocks are carrying relatively low leverage (both from an absolute and from a relative perspective), and market expectations on their future relative growth look no worse than normal. The underperformance of cheap companies doesn’t look to stem from an unexpected shock to fundamentals, and we should therefore look elsewhere to understand their performance.
Income
Companies that are expected to undergrow the market tend to trade at a discount, providing investors with higher yields as compensation for the relative stagnation of their cash flows. In “cheap” markets, this yield advantage can be quite significant; value stocks in the 1980s provided investors with an incremental 200 bps of returns from income. As markets become more expensive, however, the yield advantage of cheap companies wanes, assuming that the relative discount of cheap companies to the market remains the same. This is intuitive: if prices double for all companies and cash disbursements are unchanged, yields will halve across the board. The difference in yields between a cheap and an expensive company will likewise halve, and the yield advantage of the former will no longer be as attractive.
Over the past 13 years, valuations have been markedly higher than they were, on average, from 1981 to 2005 (even taking the tech bubble into consideration). Although the total payout of U.S. companies has risen from 40% to almost 80%, somewhat helping to offset the impact of higher valuations on yields, the excess payout13 of value companies has – if anything – dropped (see Exhibit 6). On net, this means that the yield advantage of value companies should be lower today than it was in the era of cheap valuations. It is therefore unsurprising that income has been a smaller driver of positive relative returns than it was early in our sample.
Exhibit 6: Value Companies’ Excess Payout (%)
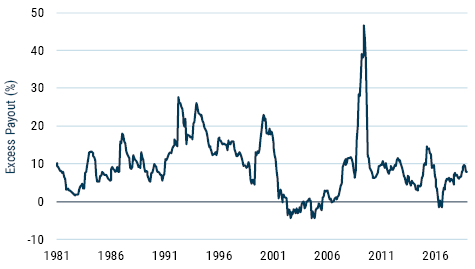
Source: Worldscope, Compustat, MSCI, GMO
To the reader, something might seem off. The income advantage of value companies has been a meager 150 bps, while this same group of stocks has typically undergrown the market by over 3%. On net, there is a large return gap which, without some further explanation, makes cheap stocks look like a decidedly unattractive proposition. So, what gives?
Rebalancing
When Jack Welch took the helm at General Electric, the company was still reeling from the economic turbulence of the 1970s. In order to help GE adapt to what he viewed as a new global growth regime, Mr. Welch introduced a series of measures meant to make GE leaner and more efficient. These included the now-common rank-and-yank, which advocates for firing a company’s bottom performers, the shutting down of underperforming businesses, and the elimination of unnecessary hierarchy. By all accounts, they worked. GE, which started the 80s with fairly low valuations,14 became a fairly consensus growth company one year into Welch’s tenure, and spent most of the ensuing decade in that category.15
A cheap company that sees its valuations rise at a faster clip than the market’s will naturally lose its “value” status, with another company taking its place. This replacement process, whereby a formerly disappointing company sees its fortunes change and its prices respond (à la General Electric in the 80s), is the engine of returns behind value portfolios. By selling securities that have become expensive and substituting them with securities that have become cheaper, value managers can simultaneously see their portfolio multiples remain low and benefit from stock-level multiple expansions. We call this the “rebalancing effect.”16
In the last 13 years, rebalancing has disappointed somewhat. Though portfolio turnover has still been significant, it is not benefitting value investors as much as it did previously. This drag on rebalancing must stem from some combination of three factors: stocks rotating less between value and growth, the valuation gap between securities exiting and joining the value group becoming more compressed, and the correlation of rotation volume and valuation spreads dropping.17 Empirically, it seems like at least two of these phenomena play a part.
Let’s look first at the amount of portfolio turnover. One way to gauge whether value portfolios have been less dynamic in the recent period is by measuring how long it takes, on average, for stocks to transition out of different quintiles. In Exhibit 7 we show that “deep” value stocks (quintile #1) have been spending less time looking extremely cheap, which should be good for rebalancing returns. The retentiveness of “deep” growth stocks (quintile #5) has been a powerful offset, however, and most things in between the cheapest and most expensive stocks have also been looking a bit less mobile. On net, because cross-sectional valuation ranks are looking a bit stiffer, rebalancing returns have suffered.
Exhibit 7: Average Number of Months Spent in Valuation Quintile
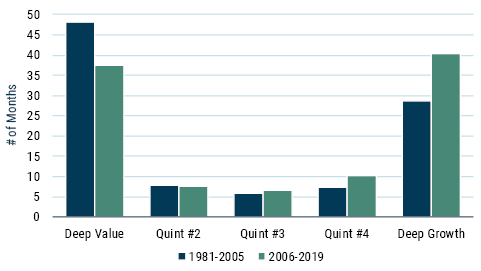
Source: Worldscope, Compustat, MSCI, GMO
The decreased speed of portfolio turnover – which is even more pronounced when we look at sector-neutral value18 – is only partially responsible for the recent slowdown in rebalancing. Though the gap between the valuations of stocks exiting and entering the value universe has remained roughly constant across periods (when we look at a composite of price-to-sales, price-to-gross-profits, and price-to-book), the co-movement of portfolio turnover and valuation spreads has become much less of a tailwind.
Recall that rebalancing is a function of both the magnitude of rebalancing (the spreads of companies exiting versus entering the value group) and of how much rebalancing is occurring (the turnover percentage), and that these two effects are not separable. If turnover is high precisely when spreads are wide, rebalancing is going to see an effect that is greater than the sum of its parts. Indeed, this is what we observed from 1981 to 2005, even after excluding the bulk of the tech bubble (1997-2002).19 If turnover and spreads are unrelated, however, there should be no gain to rebalancing beyond what would be suggested by the individual pieces, which is what we have observed over the past 13 years (see Exhibit 8).
Exhibit 8: The Loss of Positive Interaction
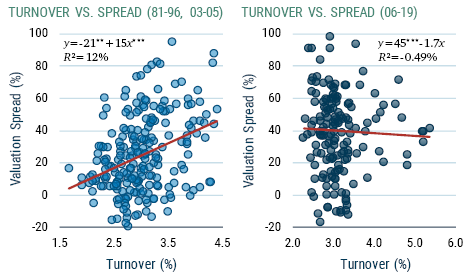
Source: Worldscope, Compustat, MSCI, GMO
With equal spreads, lower turnover, and no boost from the interaction of these two levers of rebalancing, the recent period has been trying for cheap stocks. The real question is why. A clear breakdown of rebalancing is hard to produce, given that various drivers have contributed to lower turnover. These range from growth stocks seeing more sustained profitability and growth than in the past (which lends credence to the “fundamental shift” theory) to equity analysts becoming more accurate about fundamental growth in large cap space (which is consistent with the waning of behavioral biases). Fewer takeovers of cheap companies and lower cross-sectional dispersion in returns also seem to play a role. Given that these individual contributors are all somewhat small in effect, a deeper analysis of them is perhaps best left for another day.
Valuations
There is nothing quite as engrossing as the suspension of normality. Market participants were reminded of this in December of 2018, as the S&P 500 shed almost 18% of its price in 15 trading days. Value managers were likewise rapt during those three weeks leading up to Christmas, but for a different reason: cheap stocks were outperforming. Normality, after so many disappointing years, has certainly not been exceptional relative returns.
Though income and rebalancing have been less helpful than in the past, cheap stocks’ major headwind has been their valuations. While the market currently trades at much higher multiples than those seen at the end of 2005, value stocks are at practically the same valuations today. To some extent, this was foreseeable – value was priced quite unattractively heading into 2006, close to its lowest discount to the market in almost 40 years. But more has happened than value’s discount going back to average; on a composite metric, relative multiples are now lower than in 90% of months since 1981 (see Exhibit 9).
Exhibit 9: U.S. Value Relative Valuations
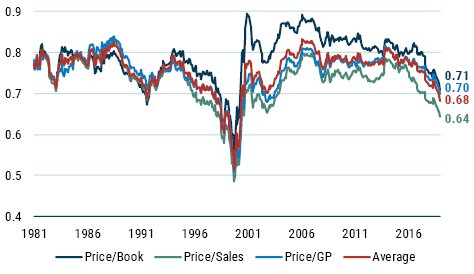
Source: Worldscope, Compustat, MSCI, GMO
More sanguine value investors view losses from changes to relative multiples as a temporary hindrance; if discounts are mean-reverting, yesterday’s losses will be tomorrow’s gains. Before sharing in this optimism, however, it’s best to try to understand what determines the relative discount at which value trades. After all, if the determinants of the value spread20 have seen a secular shift, caution might be warranted.
Multiples of assets are dependent on two factors: growth expectations and discount rates. If the economy has an unanticipated improvement that increases the former, prices go up; if risk aversion picks up, raising the latter, prices go down. Prices will respond more to changes in these quantities when, all else equal, the starting level of growth expectations is higher (because a larger amount of cash flow is involved), or when required rates of return are lower (because future cash flows are not as heavily discounted).
If value and the market have similar discount rates21 and the market experiences higher expected growth, the relative underperformance of value is unsurprising. In this scenario, value stocks are viewed as “low duration” equity,22 and they undergo less multiple expansion than the market in the face of falling required rates of return. From a functional perspective, this is easy to understand: relative to the market, value stocks’ total return depends more on cash distributions (such as dividends and buybacks) than on fundamental growth. Because the impact of these distributions is valuation-dependent while the impact of fundamental growth is not, multiple expansion has a more pronounced effect on value stocks’ expected future returns than on the market’s. As a result, cheap stocks shouldn’t see their valuations move as much as the market’s in response to an equal change in discount rates.
Using price-to-book23 data from 1928 onward, we find that variations in value’s relative multiple indeed tend to be negatively associated with changes to market valuations (see Exhibit 10); a 1% increase to the latter leads us to expect, on average, an 18-bp reduction to the former.24 Our results are consistent with the idea that value’s discount (and therefore performance) is not environment-agnostic – that cheap stocks’ duration should help them do better in risk-aversion-led sell-offs, and worse during discount-rate-led-rallies.25
Exhibit 10: Market Multiples and the Value Spread
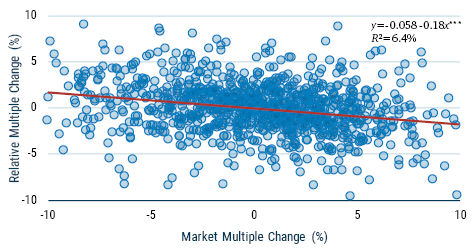
Source: Worldscope, Compustat, MSCI, GMO
The last 13 years have seen the short-term risk-free rate drop, the term premium plummet, and the equity risk premium, at least post-GFC, has seen significant compression. Faced with this trifecta, it would have been surprising to see cheap stocks’ multiples keep pace with market valuations, and more so still with value’s discount (and presumably its premium) starting at such a low level. In other words, cheap stocks deserved to see their valuations lose ground. It seems unlikely, given where discount rates are, that we should expect them to continue to do so.
Onward
The main headwind for value as a group over the past 13 years has been its widening discount, with valuations alone accounting for roughly 50% of the group’s performance deterioration during this period. In large part, this move was warranted: a fall in market-wide discount rates should lead value to be marked down. If it didn’t, value’s yield advantage would erode, leading to a reduction in the value premium, assuming, of course, that rebalancing and growth are unaffected by valuation gaps.
But valuations are not likely to move against cheap stocks forever. Though it is possible for relative multiples to draw down further, this would require either a change in growth expectations, a continued reduction in market discount rates, or an expansion of the value premium. There are scenarios under which each of these outcomes materialize: deepening market concentration and an “insurance cut” by the Fed come to mind.26 To us, the starting conditions today – retreating (yet still elevated) growth expectations, a term structure flirting with inversion, low real rates, and faint risk aversion – make a sustained rally seem less likely than the reverse.
Our concern, then, should be with the other drivers of returns. The value factor – even “smarter” implementations of it – is quite commoditized. Whether its premium stems from behavioral quirks or from its riskiness, it is no longer likely to deliver the returns we saw in the 80s and 90s. With time, analysts have become more accurate when evaluating future fundamental growth. Cross-sectional dispersion in stock returns has dropped. The net effect is less churn in valuations. Put together, slower rebalancing and a slimmer yield advantage point to a lower value premium.
While the outperformance stemming from rebalancing, growth, and income has dwindled over time, it is still fairly positive, averaging around 120 bps per annum since 2006.27 Net of valuations, cheap stocks have outdone the market in 64% of months over the past 13 years (see Exhibit 11). We have no reason to believe that this trend won’t continue,28 even with the changes that have occurred in the market, and therefore advise equity investors to pause before removing the value factor from their processes.
Exhibit 11: U.S. Value Relative Return, Net of Valuations (%)
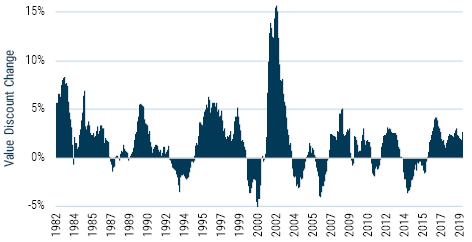
Source: Worldscope, Compustat, MSCI, GMO
Conclusion
Value has underperformed the market in 10 of the last 12 months, including the last 7. Its most recent drawdown began in 2014 and the factor is quite far from its high watermark. The relative return of traditional value has been flat since late 2004. All in all, it has been a harrowing decade for those who have sought cheap stocks, and we have tried to understand why.
We approached this problem by decomposing the factor’s relative returns. The relative growth profile of value has not changed with time; the cheapest half (ex-financials) in the U.S. has continued to undergrow the market, but by no more than what we have come to expect. These companies have also not compromised their quality to keep growth stable, suggesting that any shifts that have occurred in the market have not disproportionately hurt value’s fundamentals.
The offsets to value’s undergrowth, however, have come under pressure. Value’s yield advantage has fallen as the market has become more expensive. The group’s rebalancing – the tendency of cheap companies to see their multiples expand and rotate out of the group while expensive companies see their multiples contract and come into value – is also slower, with behavioral and structural aspects both at play. Though these drivers of relative outperformance have diminished, they still exceed value’s undergrowth by more than 1%, indicating that going forward, cheap stocks (at least as we define them) are likely to reap a decent, albeit smaller, premium.
This premium has not materialized over the last decade for a simple reason: relative valuations. Value has seen its multiples expand a lot less than the market. This makes sense – because value tends to have significantly lower duration than other equities, a broad risk rally shouldn’t be as favorable to cheap stocks as it should be to their expensive counterparts. And we have had quite a rally.
It isn’t possible to guarantee that the next decade will be kinder to value than the previous one was. The odds would seem to favor it, however. Cheap stocks still provide investors with a premium, allowing them to outperform even if their relative valuations remain low. If relative valuations rise – not an inconceivable event given a long history of mean-reverting discount rates – the ensuing relative returns will be exceptional. And value, after quite the pause, might look valuable again.
Download article here.