Listen to this Insight
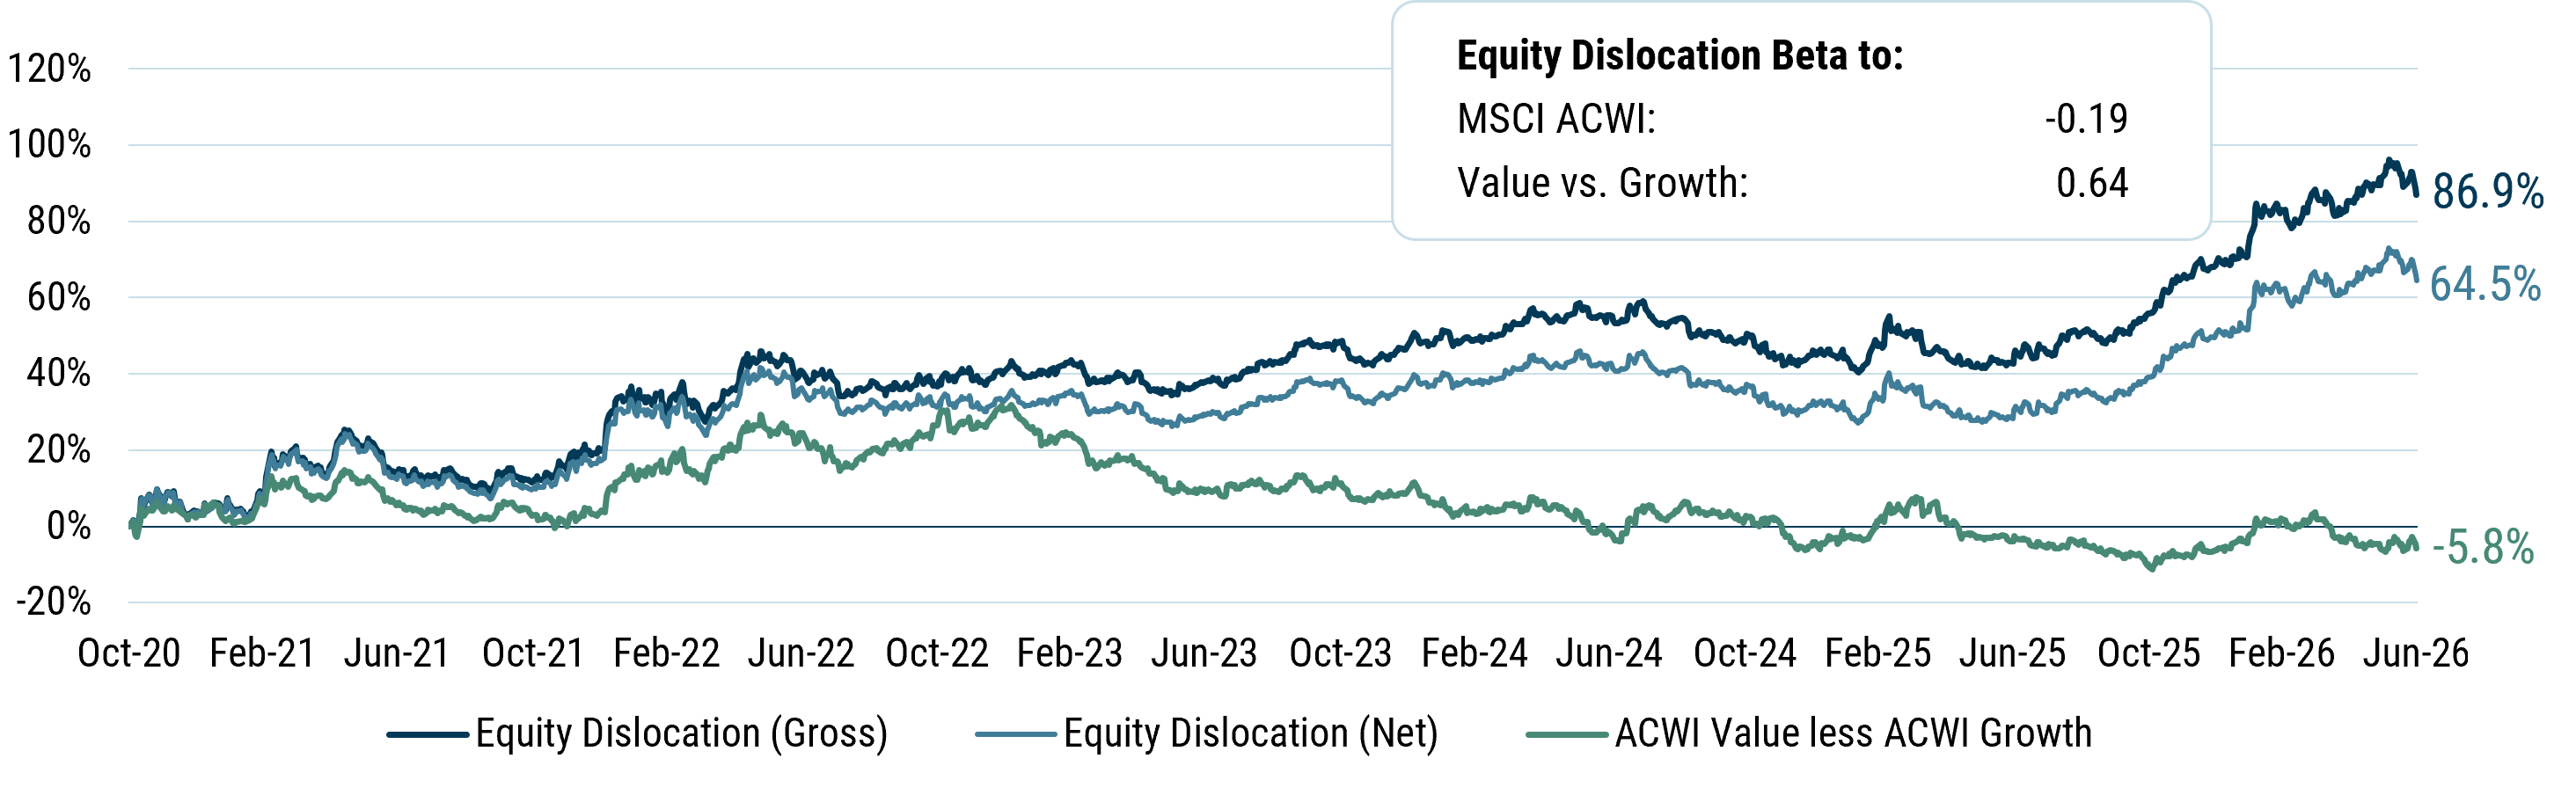
It has been an eventful six months, and we are delighted that the Equity Dislocation Strategy has risen to the occasion. The Strategy generated a 9.05% net return in the first half of 2026, compared with a 1.3% return for MSCI ACWI Value minus MSCI ACWI Growth, a broad proxy for the value-growth spread. The result was driven less by broad value factor exposure than by security selection and active rotation as valuation opportunities evolved.
Further, Equity Dislocation has demonstrated an ability to profit from AI disruption, not by forecasting which business models are most vulnerable, but by paying attention to which businesses are trading at unsustainable multiples. Share prices of expensive companies, often priced for perfect outcomes, are vulnerable to any hint of disruption. Indeed, many expensive companies have seen impressive sales and revenue growth but still failed to meet the excessive expectations embedded in their high value. Conversely, many cheap value stocks are priced for very ordinary outcomes, so any upside surprise has been heartily rewarded by the market.
As a market neutral strategy seeking to capitalize on the extraordinary dislocation between the valuations of Value and Growth stocks, it was pleasing that both the long and short books generated alpha above a naïve index implementation. The returns were driven by strong stock selection and meaningful rotation of exposures as opportunities evolved. Indeed, this approach to portfolio management has fueled Equity Dislocation's success since launch and explains much of the Strategy’s strong returns, as MSCI ACWI Value only modestly outperformed MSCI ACWI Growth over the period. Of course, this lack of outperformance of Value means that much of the potential for strong future returns remains.
We explore some of the prominent themes from the first half of 2026 below.
Extreme volatility in Value minus Growth
For the first quarter, markets seemed genuinely concerned by the sheer scale of capital investment in AI, while also starting to consider who the losers might be as a consequence of that investment. The surprise U.S. and Israel airstrikes against Iran at the end of February further contributed to a more cautious environment. Global equities were down, as MSCI ACWI returned -3.2%, and against this backdrop, MSCI ACWI Value beat MSCI ACWI Growth by 8.8%. Equity Dislocation returned 9.95% net for this period.
Optimism roared back in the second quarter, and MSCI ACWI rose an incredible 14.9%. MSCI ACWI Value trailed MSCI ACWI Growth by -9.2%, and we were delighted that good stock selection, including tremendous success in Korea, helped Equity Dislocation to be down just -0.82% net.
Delivering robust returns when Value is strongly outperforming, and holding up when Value is losing, has been a central characteristic of the Equity Dislocation Strategy’s return profile since inception.
Another interesting point is that Value has recently been winning during periods when markets are falling. Since its inception, Equity Dislocation has had a negative beta (-0.2) to MSCI ACWI. Given that both the absolute direction of markets and the outperformance of Growth are partially driven by investor enthusiasm and optimism, we would expect Equity Dislocation to remain an excellent diversifier for equity portfolios.
Software
One important structural development was the fragmentation of the “AI trade”. An example of this was the Software-as-a-Service industry plummeting as the narrative shifted from “AI really helps these companies” to “AI replaces these companies”.
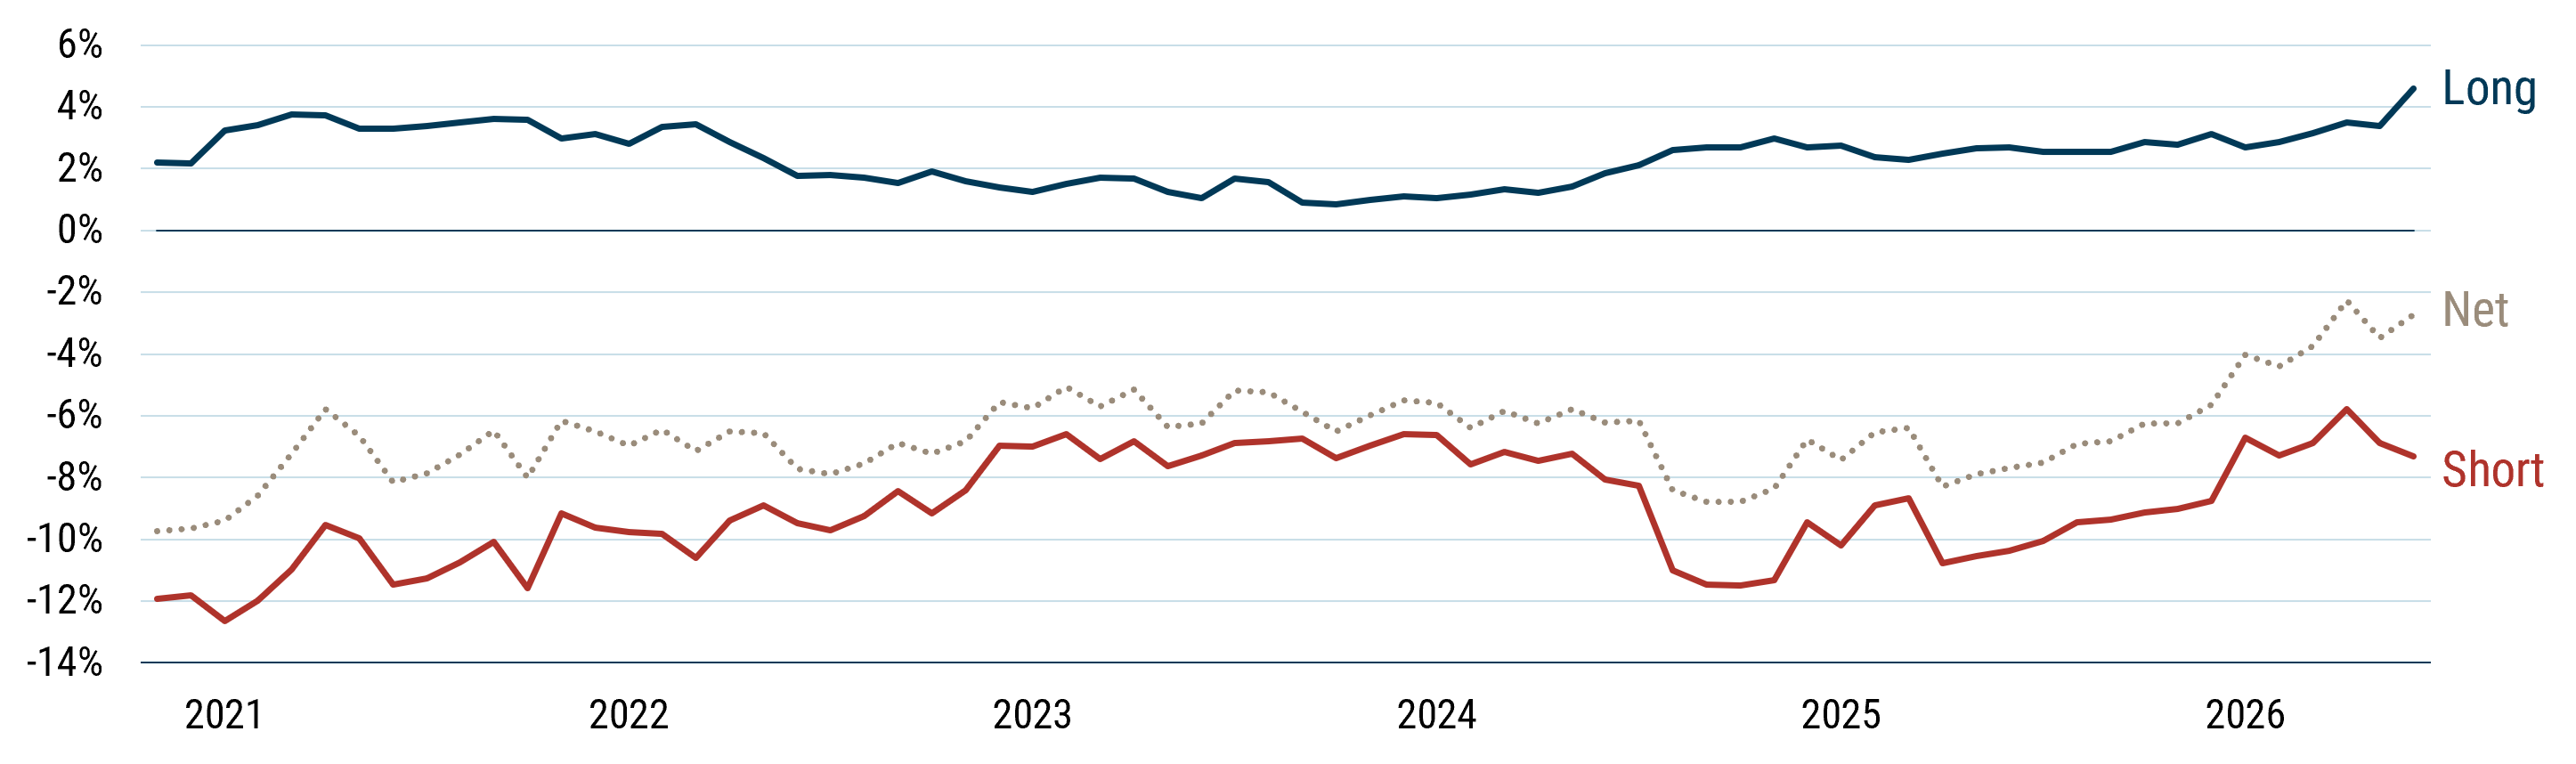
Reduced net short software position as early 2026 “SaaSpocalypse” pressured extreme P/FVs.
Equity Dislocation Software Exposures
Data from 11/30/20 to 6/12/26 | Source: GMO
We had believed that the pricing of these companies had long been too optimistic and were running an 8% net short position. After the collapse in share prices following the Anthropic-driven “SaaSpocalypse”, we no longer modeled many of these companies as egregiously expensive, and the net short position in Software was reduced to 2%.
Software contributed 1.4% to returns for the period.
Banks
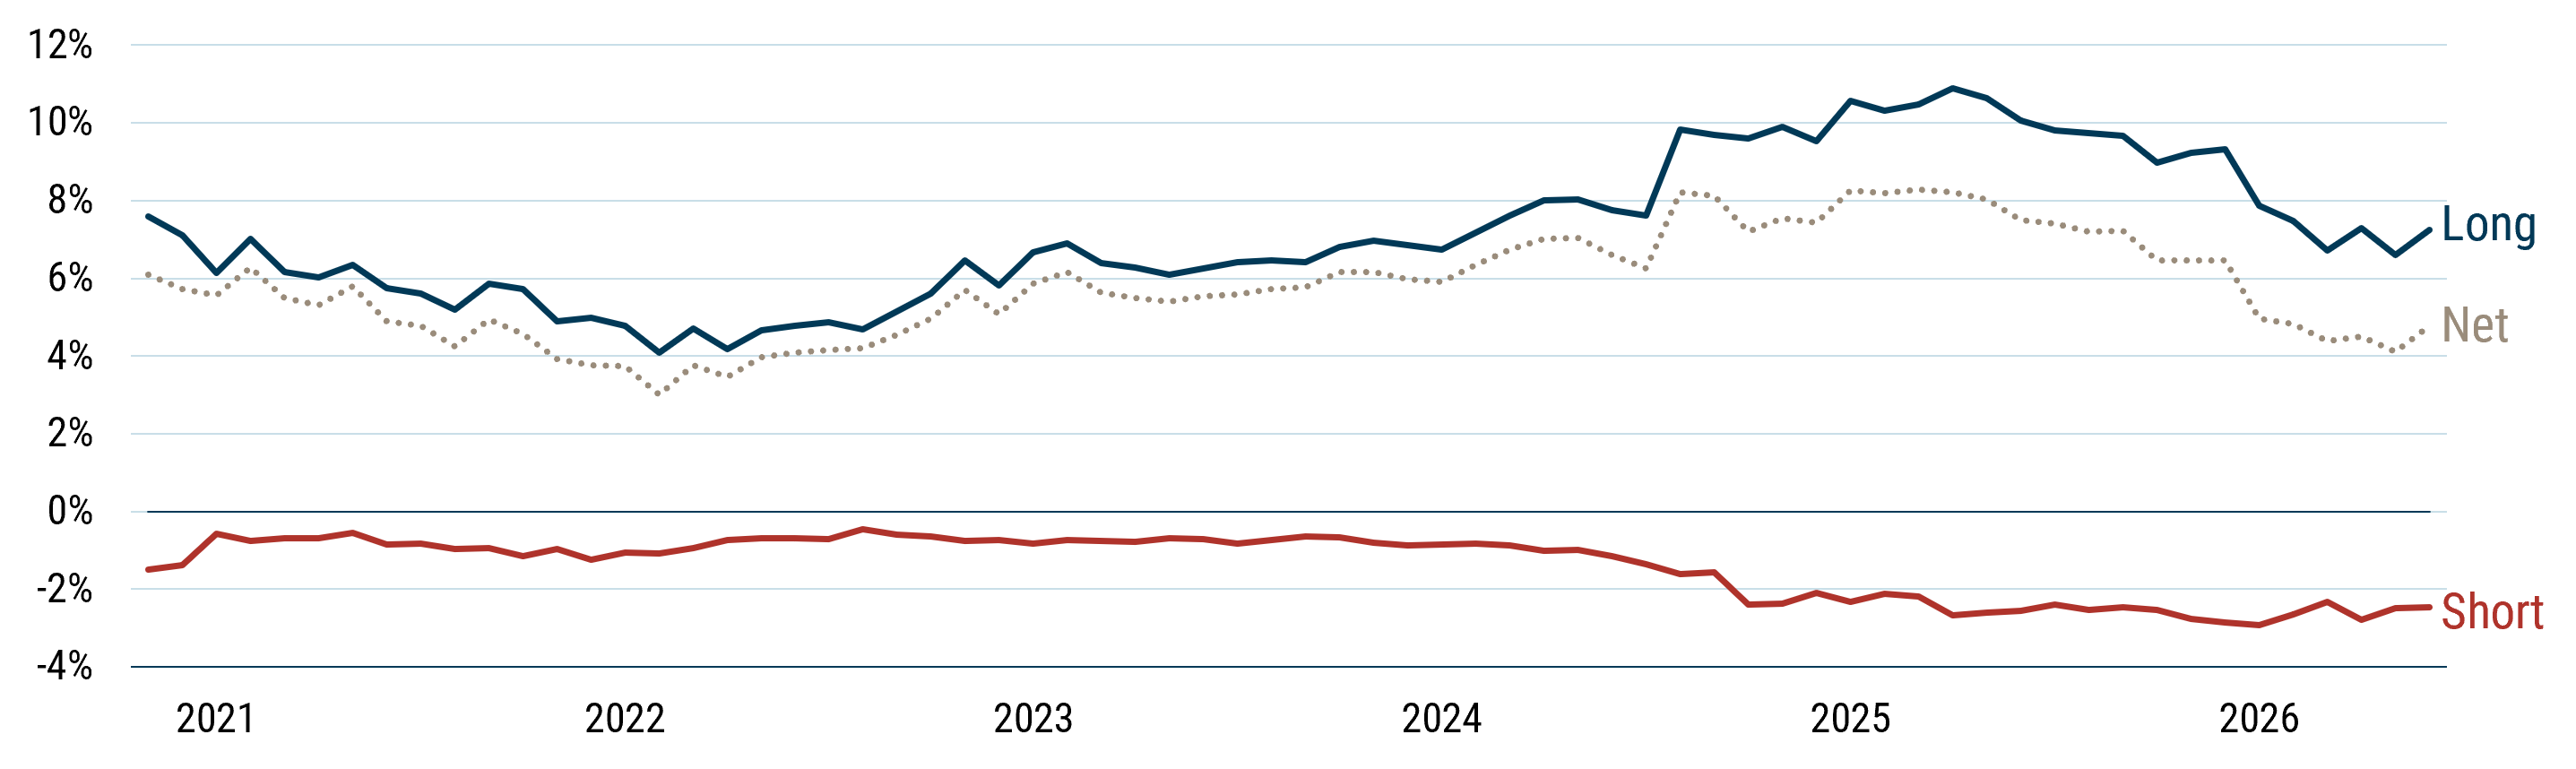
Banks had been one of the major success stories for Equity Dislocation in 2025. We had an average net long exposure of 7.5% to banks through 2025, and the two biggest contributors to performance at the total portfolio level were Banco Santander and Banco Bilbao, both up more than 150%.
Reduced Bank Exposure After Stellar Rally in European Banks
Equity Dislocation Banks Exposures
Data from 11/30/20 to 6/12/26 | Source: GMO
We still find banks to be attractive, although not to the same extent following their impressive price appreciation, and the net long position has broadly halved. We have also rotated some of the exposure out of Europe.
Banks contributed 1.2% to returns for the period.
Korea
Korea, where we have averaged about 0.7% net long (gross exposure to Korea averaged about 6.0% on the long side and 5.2% on the short side), has added some 4.0% to total portfolio returns for the period. We had targeted some cheaper growth names in Korea (including SK Square, LG Electronics, and Samsung Electronics), and they have enjoyed absolutely stellar returns.
We have been very diversified in Korea with 17 short positions and 16 long positions, but despite this, the long book has outperformed the short book by almost 100%. This strong stock selection proved particularly helpful in May, when Value was losing heavily to Growth globally.
Rotation
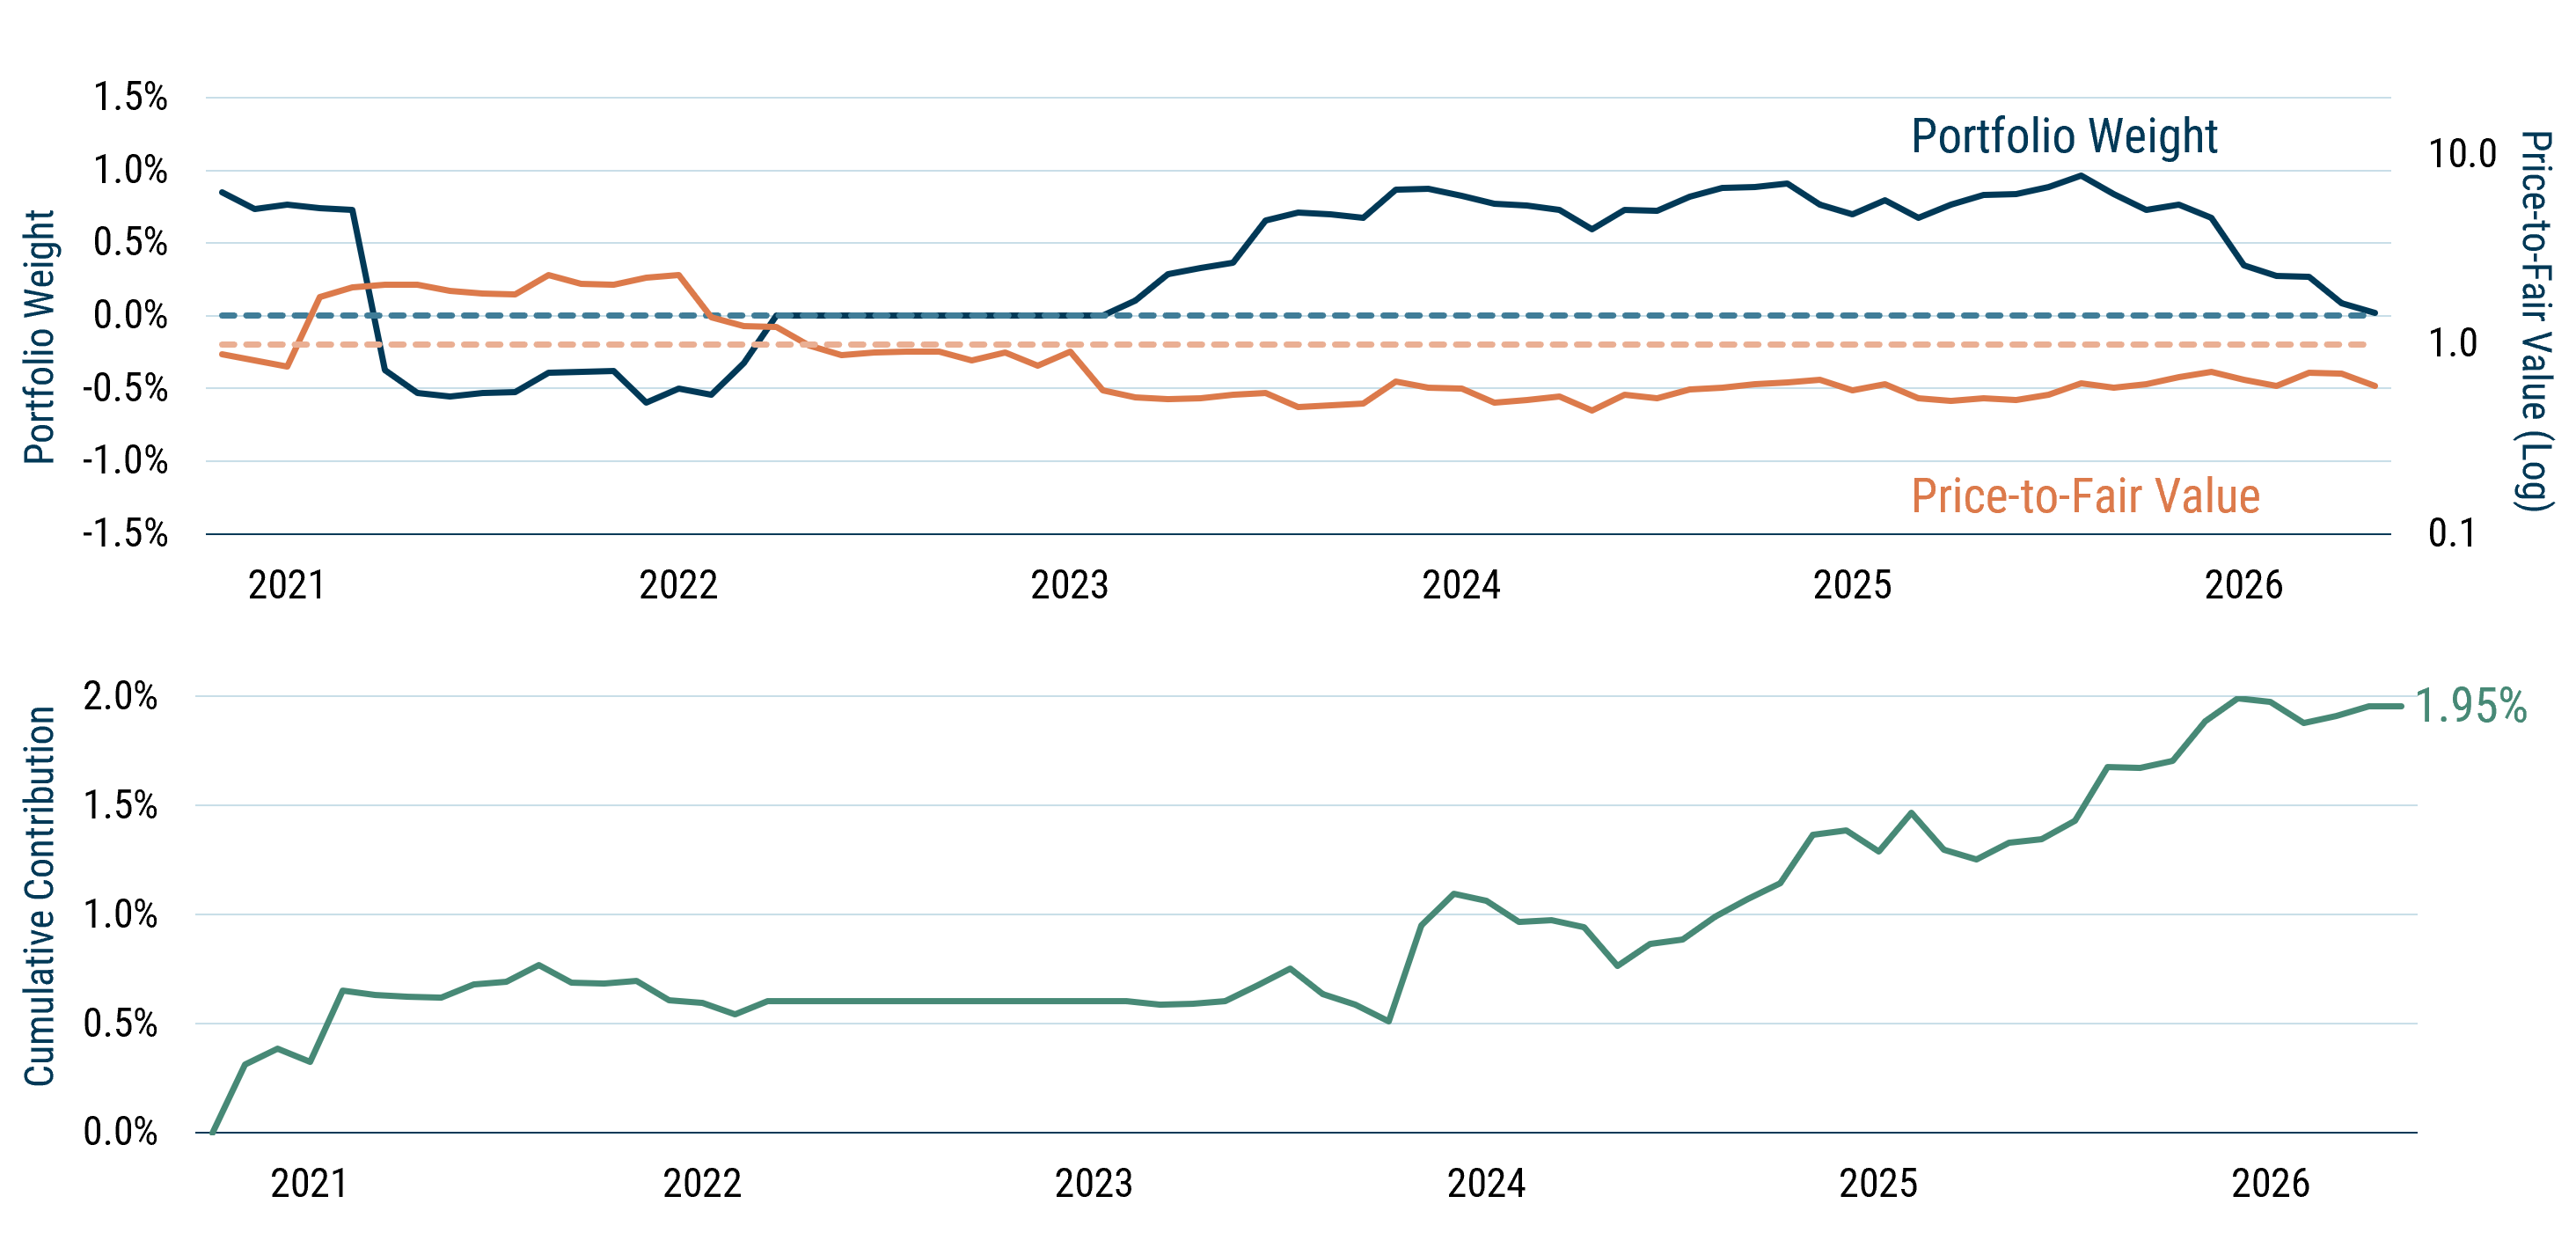
We are often asked how the strategy has generated strong performance, given that the dislocation between Value and Growth has not narrowed significantly. One of the keys to our success has been the ability to monetize strong security selection by managing exposures as valuations change. Expedia provides an excellent single stock case study of that rotation.
ROTATING WITH Evolving views of valuation
Expedia contributed 195 bps cumulatively as its position in the portfolio varied
Data from 11/30/20 to 5/31/26 | Source: GMO
Price-to-Fair Value excludes Alerts.
The orange line shows the price-to-fair-value (GMO’s proprietary valuation model) of Expedia. When it is above the dotted orange line, it is expensive, and it is cheap when it is below. The blue line in the same panel shows our exposure to Expedia – first long when it was cheap, then short as it became expensive, no exposure when it was about fair value, and then long again for much of the last few years. Expedia has been both a successful long and short position, adding almost 2% to cumulative performance, and is a great example of how dynamic portfolio rotation allows investors to make the most out of the Value opportunity.
Closing Thoughts
Equity Dislocation Strategy since launch
Data from 10/31/20 to 6/30/26
Preliminary Composite performance (%) (net of fees USD)
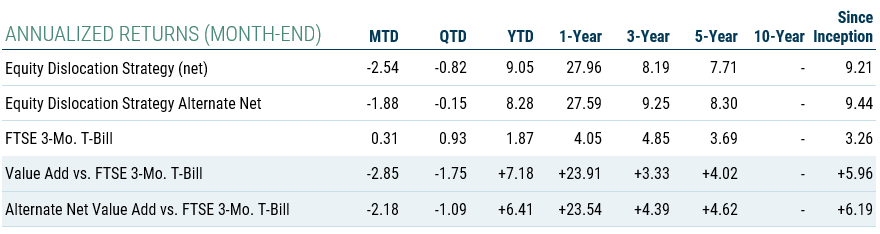
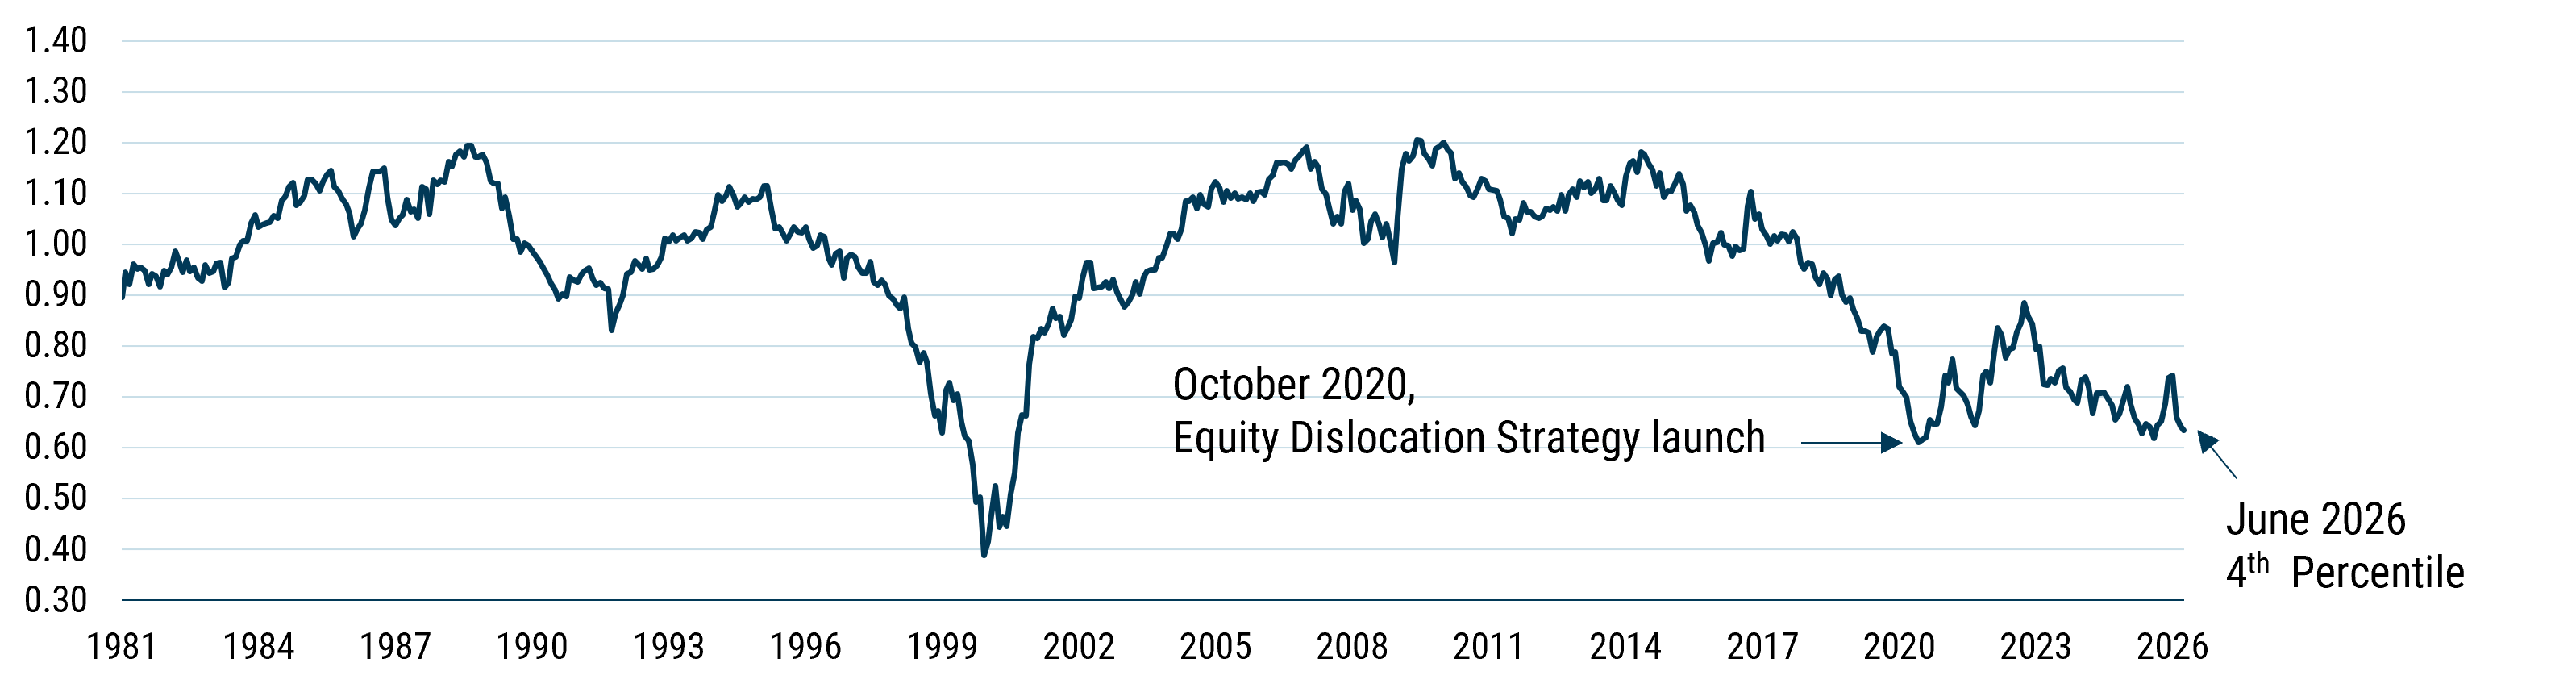
2026 has been an excellent year so far, both in absolute terms and versus a naïve MSCI ACWI Value minus MSCI ACWI Growth approach. Importantly, the broad value-growth spread has not meaningfully narrowed since the Strategy’s inception in October 2020, suggesting that the prospective opportunity remains substantial. It is no wonder that our excitement about the Equity Dislocation strategy remains unabated, and it is still the largest active position in our unconstrained Benchmark Free strategy with an exposure of roughly 20%.
We continue to view Equity Dislocation as a differentiated way to own attractively valued equities while correspondingly shorting equities where we believe valuations reflect implausible growth expectations, and to dynamically rebalance as valuations change. For investors with significant exposure to equity beta, growth-oriented public equities, or private-market assets sensitive to similar expectations, this strategy may provide a distinct source of return and diversification.
VALUE IS EXTREMELY CHEAP