- Investment committees around the world will soon meet to assess 2022 portfolio performance, often looking line by line at winners and losers. However, we believe the most attractive group of U.S. stocks today is one that is likely absent from most existing portfolios, or at least woefully underrepresented – the cheapest quintile or “Deep” Value.
- After the longest cycle in which Growth massively outperformed Value, many portfolios dropped their underperforming Value managers or hung on to those that leaned a bit less into Value to survive. No exposure means no line item, which means most committee members and staff may not be thinking about Deep Value.
- While Value outperformed Growth by a wide margin last year, 2022 marked an aberration in the relative performance of Deep vs. Shallow Value (the next 30% of cheapest stocks after Deep Value). Deep Value usually outperforms Shallow Value when Value outperforms; not so in 2022 (Exhibit 1).
- This dichotomy has left Deep Value trading cheaply relative to its own history as well as the rest of the market (Exhibit 2). We believe that it’s time to lean back into this attractive group of U.S. Value stocks.
- Purely for illustrative purposes, we consider a hypothetical scenario where all five quintiles of the market revert to their historical median valuation (i.e., all percentiles in Exhibit 2 go to the 50th percentile). Based on our estimates, if all quintiles of the U.S. market revert to their historic median valuation (which is a strong assumption), we believe that U.S. Deep Value (the cheapest quintile) is priced to outperform the rest of the market by roughly 30%.
- We have allocated to Deep Value using the Equity Dislocation and U.S. Opportunistic Value Strategies across GMO’s Asset Allocation portfolios to gain targeted exposure to this attractive investment opportunity.
EXHIBIT 1: DEEP VALUE VS. SHALLOW VALUE ANNUAL PERFORMANCE
1980-2022
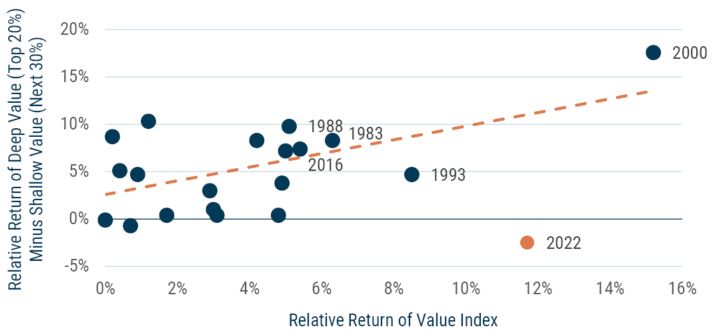
As of 11/30/2022 | Source: GMO
Composite valuation measure is composed of Price/Sales, Prices/Gross Profit, Price/Book, and Price/Economic Book. Deciles of value and market are weighted by market cap, with the largest stocks capped at a 2% weight. For the U.S. market, relative return of the Value Index compares the return of the S&P 500 Value Index to the S&P 500 Index. S&P does not guarantee the accuracy, adequacy, completeness or availability of any data or information and is not responsible for any errors or omissions from the use of such data or information. Reproduction of the data or information in any form is prohibited except with the prior written permission of S&P or its third-party licensors. Please visit https://www.gmo.com/americas/benchmark-disclaimers/ to review the complete benchmark disclaimer notice.
EXHIBIT 2: WITHIN THE U.S., “DEEP VALUE” SEGMENT (CHEAPEST 20%) IS TRULY DISLOCATED
Quintiles of Valuation in Top 1,000 U.S. Stocks
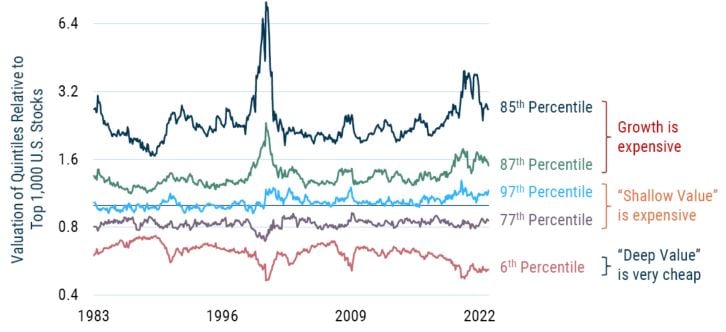
As of 12/31/2022 | Source: GMO
Composite valuation measure is composed of Price/Sales, Prices/Gross Profit, Price/Book, and Price/Economic Book. Quintiles of value and market are weighted by 4th root of market cap.
Download article here.