Executive Summary
Russia’s 2022 invasion of Ukraine and the ensuing war have prompted new and difficult questions for sovereign debt investors. One such question is how best to approach illiberal and autocratic countries, like Russia, within the asset class. Indeed, this question may be more important now than ever in the wake of such an event (in which a relatively undemocratic country within emerging debt benchmarks 1 attacked a relatively democratic one), particularly amid continued investor interest in environmental, social, and governance (ESG) sustainability. In this paper we outline a process by which investors can develop an emerging hard currency debt portfolio that prioritizes freedom and democracy while preserving the key investment characteristics of the asset class. We believe such an approach may help investors reduce exposure to certain costly political events akin to the ones witnessed in 2022. At the very least, it should help sustainability-conscious investors to establish emerging debt portfolios that are freer, more democratic, and better aligned with their own values.
The undemocratic nature of emerging countries is a longstanding issue
Are emerging countries more undemocratic or unfree? Undoubtedly, defining – let alone measuring – such concepts can be elusive and subject to debate. Though one may be tempted to answer such a question by focusing on anecdotes and news developments – an allegation of voter fraud in a recent election, an arrest of an opposing politician, a closing of a popular news outlet, and so on – we prefer a more systematic approach. Unfortunately for emerging debt investors, the data do not paint an encouraging picture.
First, a note on data: while a number of organizations measure the extent to which countries are free, open, and democratic, for the purposes of this paper we will use the World Bank’s Voice & Accountability (V&A) metric as a proxy for this broad theme. One of six Worldwide Governance Indicators (WGIs) established in the mid-1990s, V&A captures “perceptions of the extent to which a country's citizens are able to participate in selecting their government, as well as freedom of expression, freedom of association, and a free media.” 2 We find this metric especially suitable for this paper, given its long and respected track record, breadth of country coverage, and use of a wide range of sources in its methodology.
In our 2021 paper 3 on the integration of ESG factors (including V&A) in sovereign debt investing, we discussed at length a conundrum for emerging sovereign debt investors: the inverse relationship between the strength of countries’ ESG characteristics and their overall level of development. In plain words, richer countries tend to perform better with regard to ESG, while poorer countries tend to perform worse. We are hardly the first to shed light on this fact, but in recent years as the conversation around ESG investing has become more sophisticated, we sense a growing recognition of the link between income and ESG at the country level. 4 The key implication is that investors in emerging country asset classes will, all things being equal, hold a worse portfolio in terms of ESG than their developed country counterparts.
Unsurprisingly, the “G” in ESG is no exception, and countries which feature better governance tend to be richer and more developed. Numerous economists have expounded on this relationship in recent decades, albeit with varying nomenclatures. In an earlier work on the subject, Hall and Jones (1999) referred to “social infrastructure” in explaining differences in output per worker, concluding that:
A country’s long-run economic performance is determined primarily by the institutions and government policies that make up the economic environment within which individuals and firms make investments, create and transfer ideas, and produce goods and services. 5
While the causal relationship between governance and economic outcomes can be debated, the correlation between the two is clear. Exhibit 1 below plots per capita GDP against a straight average of the aforementioned WGIs. Meanwhile, Exhibit 2 shows average scores across the six dimensions for EMBIG countries versus those of advanced economies, 6 with worse governance outcomes for the EMBIG category across each of the six WGIs, including V&A. In plain terms, emerging debt and other asset classes focusing on developing countries will tend to feature significantly greater corruption, poorer regulatory quality, greater political instability, and weaker democratic institutions than those focused on developed countries.
EXHIBIT 1: STRONG CORRELATION BETWEEN GOVERNANCE AND INCOME
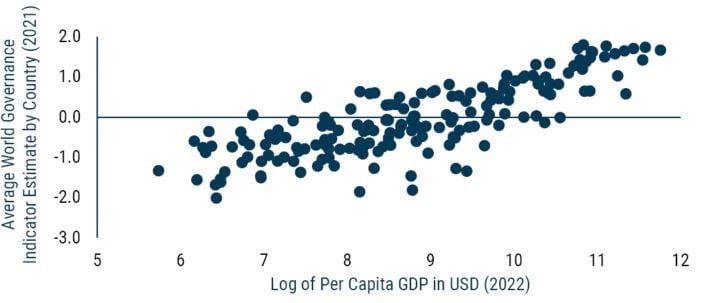
Source: World Bank, Bloomberg
EXHIBIT 2: EMBIG COUNTRIES ARE WEAKER ACROSS ALL ASPECTS OF GOVERNANCE
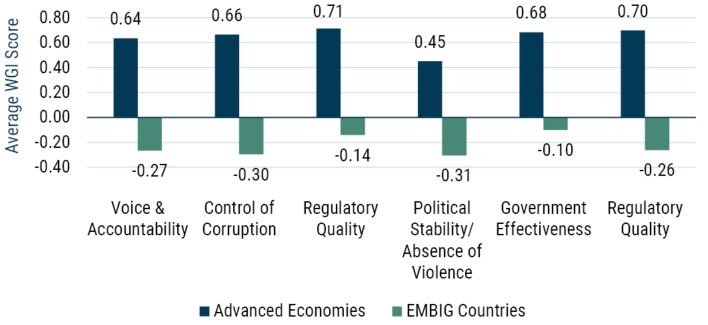
Source: World Bank, International Monetary Fund
The connection between V&A and borrowing costs is surprisingly weak
Above we discussed the strong and positive correlation between countries’ V&A scores and their income levels. But what about the link with borrowing costs? Here, the results are much less straightforward.
Exhibit 3 shows the correlation coefficients between sovereign spreads and each of the six WGIs. The direction of the relationship is as we would expect – higher governance scores are associated with tighter sovereign spreads and better creditworthiness. Yet we find it notable that the V&A metric has the lowest magnitude. Regressing spreads on V&A reinforces this finding. As Exhibit 4 illustrates, a simple regression of sovereign spreads at the end of 2022 on each of the six WGIs, controlling for per capita GDP, shows the least robust relationship between spreads and V&A.
EXHIBIT 3: V&A HAS A LOWEST CORRELATION WITH SOVEREIGN SPREADS
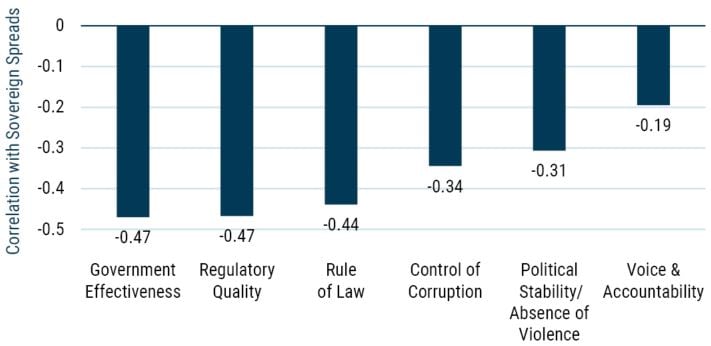
Source: World Bank, J.P. Morgan, GMO
EXHIBIT 4: V&A LEAST STATISTICALLY SIGNIFICANT WHEN CONTROLLING FOR INCOME
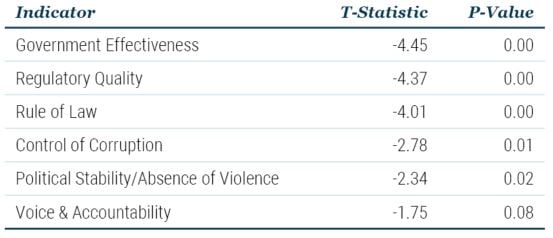
Source: World Bank, J.P. Morgan, GMO
Why, then, does V&A correlate relatively poorly with spreads, in contrast to other governance metrics? One explanation may be that markets are overly shortsighted and fail to recognize the importance of this theme toward long-term debt sustainability, a possibility which we will address shortly. However, another (simpler) explanation may be that other aspects of governance impact a country’s ability to service its debt much more directly. It is somewhat hard to imagine a country with poorly enforced property rights, weak state capacity, and a high degree of political instability borrowing consistently at tight spreads. Conversely, for better or worse, there are ample examples of relatively undemocratic countries whose other characteristics support the stable economic and fiscal outcomes necessary to earn the confidence of creditors.
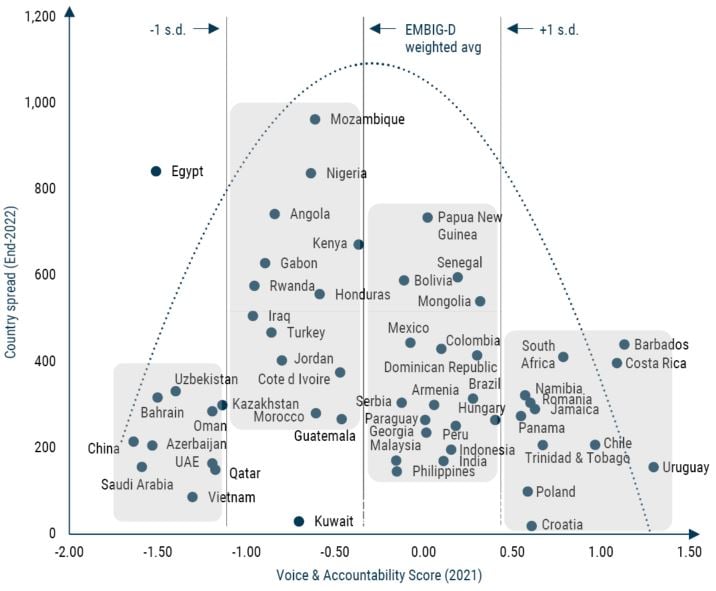
Exhibit 5 illustrates this by plotting countries’ 2021 V&A scores against their index bond spreads as of the end of last year. 7 Immediately, we see something of a “barbell” relationship between these two factors; while the strongest democracies toward the right tend to feature tight spreads (e.g., Chile and Uruguay), we also note a number of highly undemocratic countries toward the left with similarly low borrowing costs (e.g., Azerbaijan, China, and Saudi Arabia). Somewhat remarkably, nearly every country with a V&A score more than one standard deviation worse than the mean had bond spreads under 400 bps. Among these ten countries, we find governance scores across the other five categories roughly in line with the average for the asset class.
EXHIBIT 5: SEVERAL STRONG BORROWERS HAVE SURPRISINGLY WEAK V&A SCORES
Source: World Bank, J.P. Morgan, GMO
This supports our contention that relatively undemocratic countries with otherwise sound economic, fiscal, and governance characteristics can – and often do – earn the privilege of low borrowing costs. Indeed, Russia was a notable example of this phenomenon prior to its invasion of Ukraine and subsequent exclusion from J.P. Morgan’s benchmarks in 2022. As Exhibit 6 illustrates, for most of the past several years Russia’s sovereign spreads have been more or less in line with its investment-grade peers in the index, with the exception of two instances: a brief (about a year and a half) period after its invasion of Crimea in 2014, and the current period, involving default and removal from the benchmarks. Thus, for the better part of the decade leading up to the Russia-Ukraine war, investors saw Russia as a typical investment-grade credit, despite its clear democratic shortcomings and, especially after 2014, its proven capacity for belligerence.
This may seem odd in retrospect given recent experience, but Russia’s tendency to trade at tight spreads prior to the current war is otherwise unremarkable. Indeed, similar to those low V&A, low spread countries at the bottom left of Exhibit 5, Russia featured strong debt and fiscal metrics prior to the 2022 invasion. 8 In other words, investors collectively concluded that Russia’s capacity to service its debt was strong, and that the risks posed by its undemocratic qualities and history of aggression did not warrant a significant additional risk premium.
EXHIBIT 6: RUSSIA SPREADS IN LINE WITH OTHER IG CREDITS
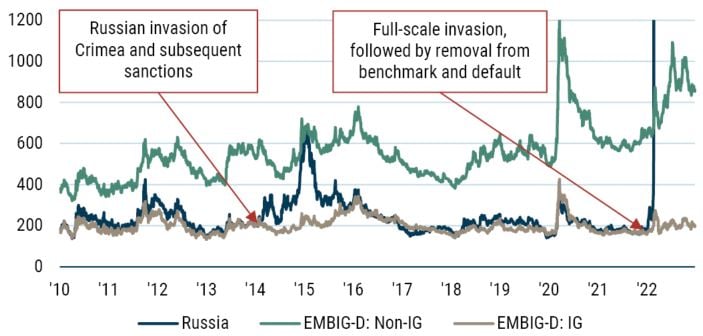
Source: J.P. Morgan
Emerging debt investors can prioritize freedom and democracy without significant sacrifices to returns
The observation that countries’ levels of V&A have little bearing on pricing may be troubling for some emerging debt investors in that it reveals to some extent the market’s indifference to this theme. On the other hand, we believe it may represent an opportunity for those looking to promote the concept without incurring a steep cost in returns.
Many investors and other market observers have pointed not just to the connection between countries’ ESG characteristics and per capita incomes, but also in relation to bond yields. As we wrote in 2021:
Within emerging country debt, poorer countries not only tend to have worse ESG scores, but also offer higher yields…To disqualify low-scoring ESG countries from eligibility within an emerging debt portfolio, or to otherwise limit their weights in the portfolio irrespective of other factors, runs the risk of skewing the portfolio toward lower yields, and potentially lower returns. 9
There are various ways to illustrate this. The simplest is to compare EMBIG-D to its higher quality ESG analog, the J.P. Morgan ESG EMBI Index (JESG EMBI). In the past decade (2013-22), JESG EMBI has featured lower average bond yields (5.3% vs. 5.8%) even amid slightly higher average duration (7.3 years vs. 7.0 years), while producing lower average annual total returns (2.1% vs. 2.4%). Another way is to start with the main index and examine its characteristics as we begin excluding its worst ESG performers. Exhibit 7 shows the effects on average bond yields and credit ratings 10 as we begin to exclude countries ten at a time, based on their MSCI ESG scores as of the end of last year. Not surprisingly, as we exclude a greater number of ESG laggards from the index, we gravitate toward a portfolio that is higher in credit rating and lower in yields.
EXHIBIT 7: YIELDS DECLINE, RATINGS IMPROVE WITH BETTER ESG SCORES
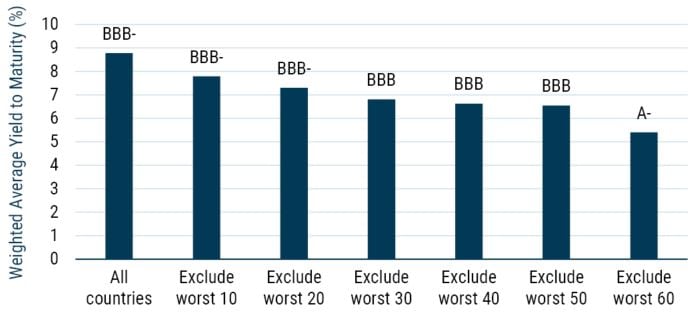
Source: J.P. Morgan, S&P, Fitch, MSCI, GMO
When we focus on the specific theme of freedom and democracy as proxied by V&A, however, this effect is much less pronounced, and we observe much smaller impacts on both bond yields and returns. We set about determining this by creating a model portfolio with a clear set of rules and principles, establishing three tiers of eligibility based on both levels and trends in Voice & Accountability. Specifically, in the first category, “excluded” countries would be entirely ineligible for inclusion in the portfolio. In the second, “limited” countries would be eligible, but face constraints in terms of the amount of investment capital allocated. 11 Finally, all other countries would be fully eligible and, due to the reallocation away from “excluded” and “limited” peers, would feature portfolio weights greater than those of the benchmark. Exhibit 8 offers more detail on the rules underlying this approach.
EXHIBIT 8: Model Portfolio Rules & Principles
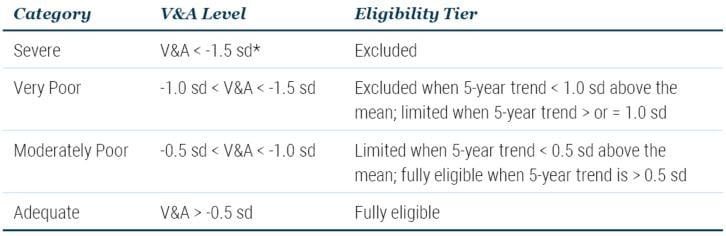
*Standard deviations from the mean
Over various time horizons (20, 15, 10, and 5 years), a constrained portfolio using the rules above would have resulted in levels of annualized total returns and risk-adjusted total returns roughly similar to that of the index. 12 This is the case even as a significant share of the index is excluded under such rules (at the end of 2022, roughly 30% of countries by market cap would be excluded, and another 11% limited).
EXHIBIT 9: RECENT YIELDS ARE MATERIALLY HIGHER UNDER MODEL PORTFOLIO RULES
Difference in model portfolio and EMBIG-D yields at year-end (%)
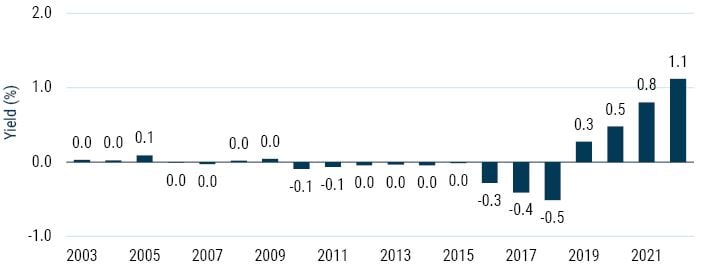
Source: J.P. Morgan, GMO
Another important result is the shift over time in the character of the model portfolio. As Exhibit 9 shows, the difference in average bond yields between the portfolio and the index is generally small between 2003 and 2018 but rises significantly from 2019 onward. This trend is notable as it coincides with the recent (and somewhat controversial) addition of several Gulf countries to the index, namely Saudi Arabia, Qatar, United Arab Emirates, Bahrain, and Kuwait. 13 All of these countries except Kuwait had V&A scores worse than one standard deviation from the mean from 2017 to 2020 (and only Saudi Arabia featured a positive trend), while all but Oman (which entered the index prior to 2019) were rated single-A or better and had spreads well inside that of the index. Their collective weight at the time of entry in January 2019 was 1.3% but grew to 16.7% of the index by the end of 2022, helping to explain much of the trend in relative yields between the two portfolios. We think this portends well in terms of future returns for a portfolio that may filter out some of these credits if one accepts that higher-yielding and lower-rated credits are more likely than not to deliver higher returns in the long-run.
A sustainability tool which may also protect against tail risks
Could countries’ levels of V&A today help us anticipate negative risk events tomorrow? This question is possibly more relevant than ever given the impacts of Russia’s recent actions.
As a simple exercise, we look at the 49 EMBIG countries for which we have complete total return data over the past decade (2013 through 2022) and focus on the ten countries with negative total returns (Lebanon, Venezuela, Ukraine, Sri Lanka, Zambia, Ecuador, Argentina, Ghana, Belarus, and Russia). These countries did, in fact, have significantly worse V&A scores at the beginning of the period. However, other metrics relevant to credit risk were also less favorable for the group. As shown in Exhibit 10, at the start of the period debt and interest burdens were higher, fiscal performance was weaker, and current account deficits were larger than for the remaining countries in our sample.
EXHIBIT 10: ANTICIPATING NEGATIVE RISK EVENTS
Countries experiencing negative total returns over the past decade featured worse V&A scores and lagged on other key metrics related to debt sustainability
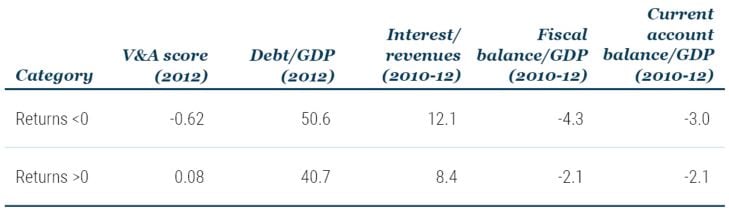
Source: World Bank, International Monetary Fund, J.P. Morgan, GMO
Regressing returns directly on V&A scores gives us more encouraging results. When controlling for the factors above, we find a positive and statistically significant relationship between V&A and total returns, with a one standard deviation increase in score associated with an additional 2.6% in annualized returns. Indeed, under our portfolio rules framework, each of the worst four performers over the period would have been either limited (Lebanon) or excluded (Belarus, Russia, and Venezuela).
The issue, however, pertains to the presence of Belarus and Russia in our sample; without including these two countries, the relationship between countries’ scores and returns is much less statistically significant. This brings us back to an inescapable question: Was democracy, or the lack thereof, really the issue that caused Belarus and Russia to fall off the map financially and produce such disastrous returns? It is true that both countries exhibited weak democratic institutions at the start of the period, but we would argue that it was specifically their belligerence toward a European neighbor and the West’s willingness to levy a financial penalty – not the state of their democratic institutions – that ultimately drove them into sanctions-related default. In fairness, democracy and belligerence are related concepts – various authors 14 have shown that wars between healthy democracies are exceedingly rare – but our point is that trying to predict which countries might suffer a similar fate in the future requires us to think beyond any one concept or variable. 15 Given the uniqueness of the Russia-Ukraine war and the dearth of similar cases, we think it is difficult to forecast similar events in the future using historical data.
Yet, regardless of its capacity to predict tail risks, we believe this investment approach has great potential as a solution for sustainability conscious investors. As we have shown, emerging countries are less free and democratic than their developed counterparts, a reality that was hammered home by the events of 2022. For those who are purely focused on returns, this fact may be neither surprising nor problematic. For others, however, we see clear opportunities to address the issue systematically, resulting in a portfolio that may help to promote freedom and democracy without significant sacrifices in returns. Perhaps in this way investors can use the lessons of the recent past to chart a more sensible path forward.
Download article here.
J.P. Morgan, the main benchmark provider in this area, included Russia in both its external and local currency indices, the Emerging Markets Bond Index – Global Diversified (EMBIG-D) and the Government Bond Index – Emerging Markets (GBI-EM), respectively. For the purposes of this paper, we will use EMBIG-D for country comparison purposes given its wider breadth of investable countries (70 versus 20).
The Worldwide Governance Indicators: Methodology and Analytical Issues (Kaufman, Kraay, and Mastruzzi 2010).
Sovereign ESG Integration: An Alpha-Oriented Approach for Emerging Debt (Aghdasi 2021).
See, for instance, the World Bank’s 2021 publication, A New Dawn – Rethinking Sovereign ESG, which asserted, “More-developed countries tend to have stronger institutions, more equality, and more prosperity. Therefore, higher income tends to be tied to better ESG scores, especially regarding Social and Governance issues. Because of this ingrained income bias, about 90% of ESG scores can be explained by a country’s gross national income.”
Robert E. Hall and Charles I. Jones, Why Do Some Countries Produce So Much More Output Per Worker Than Others? Quarterly Journal of Economics, Vol. 114, No. 1 (Feb., 1999), p. 114.
We use the IMF’s definition for “advanced economies.”
For the sake of simplicity, we focus for the time being on those countries with spreads under 1,000 bps. The relationship between strength of democracy and debt distress is an important sub-topic which we address later in this paper.
For instance, using the most recent IMF World Economic outlook estimates published prior to the invasion, 2022 debt-to-GDP for Russia was estimated at 17.9% versus a weighted average of 60.8% for the remainder of the index.
Sovereign ESG Integration: An Alpha-Oriented Approach for Emerging Debt (Aghdasi 2021).
From Standard & Poor’s, and Fitch when unavailable.
Specifically, we limit the par value of these countries’ bonds – effectively, the dollar amount lent – to 0.75 times the equivalent amount in the index.
For a more detailed analysis, please contact your GMO representative.
For background, see Closing the Gulf: How the GCC Countries Fit into Our Emerging Debt Investment Process (Ross 2019) and How Higher Ratings Are Changing Emerging Debt (Vandersteel 2020).
See Kosuke Imai and James Lo, “Robustness of Empirical Evidence for Democratic Peace: A Nonparametric Sensitivity Analysis” (International Organization, Volume 75, Issue 3, Summer 2021, pp. 901-919) for a useful history on the idea, which dates back at least to the 18th century.
See, for instance, Weighing the Risk of Sanctions in Emerging Debt (Ross 2023), in which we introduced a more holistic framework for assessing the risk of severe sanctions on borrowers. The framework has four components: conflict and aggression, democracy, human rights, and financial transparency.
Disclaimer: The views expressed are the views of Eamon Aghdasi and Mina Tomovska through the period ending August 2023, and are subject to change at any time based on market and other conditions. This is not an offer or solicitation for the purchase or sale of any security and should not be construed as such. References to specific securities and issuers are for illustrative purposes only and are not intended to be, and should not be interpreted as, recommendations to purchase or sell such securities.
Copyright © 2023 by GMO LLC. All rights reserved.
J.P. Morgan, the main benchmark provider in this area, included Russia in both its external and local currency indices, the Emerging Markets Bond Index – Global Diversified (EMBIG-D) and the Government Bond Index – Emerging Markets (GBI-EM), respectively. For the purposes of this paper, we will use EMBIG-D for country comparison purposes given its wider breadth of investable countries (70 versus 20).
The Worldwide Governance Indicators: Methodology and Analytical Issues (Kaufman, Kraay, and Mastruzzi 2010).
Sovereign ESG Integration: An Alpha-Oriented Approach for Emerging Debt (Aghdasi 2021).
See, for instance, the World Bank’s 2021 publication, A New Dawn – Rethinking Sovereign ESG, which asserted, “More-developed countries tend to have stronger institutions, more equality, and more prosperity. Therefore, higher income tends to be tied to better ESG scores, especially regarding Social and Governance issues. Because of this ingrained income bias, about 90% of ESG scores can be explained by a country’s gross national income.”
Robert E. Hall and Charles I. Jones, Why Do Some Countries Produce So Much More Output Per Worker Than Others? Quarterly Journal of Economics, Vol. 114, No. 1 (Feb., 1999), p. 114.
We use the IMF’s definition for “advanced economies.”
For the sake of simplicity, we focus for the time being on those countries with spreads under 1,000 bps. The relationship between strength of democracy and debt distress is an important sub-topic which we address later in this paper.
For instance, using the most recent IMF World Economic outlook estimates published prior to the invasion, 2022 debt-to-GDP for Russia was estimated at 17.9% versus a weighted average of 60.8% for the remainder of the index.
Sovereign ESG Integration: An Alpha-Oriented Approach for Emerging Debt (Aghdasi 2021).
From Standard & Poor’s, and Fitch when unavailable.
Specifically, we limit the par value of these countries’ bonds – effectively, the dollar amount lent – to 0.75 times the equivalent amount in the index.
For a more detailed analysis, please contact your GMO representative.
For background, see Closing the Gulf: How the GCC Countries Fit into Our Emerging Debt Investment Process (Ross 2019) and How Higher Ratings Are Changing Emerging Debt (Vandersteel 2020).
See Kosuke Imai and James Lo, “Robustness of Empirical Evidence for Democratic Peace: A Nonparametric Sensitivity Analysis” (International Organization, Volume 75, Issue 3, Summer 2021, pp. 901-919) for a useful history on the idea, which dates back at least to the 18th century.
See, for instance, Weighing the Risk of Sanctions in Emerging Debt (Ross 2023), in which we introduced a more holistic framework for assessing the risk of severe sanctions on borrowers. The framework has four components: conflict and aggression, democracy, human rights, and financial transparency.