Uncertainty Has Seldom Been Higher
Oddly, Neither Has the Stock Market
By Ben Inker
Executive Summary
At the March lows, most risk assets appeared to be fair value or cheap, even assuming a moderate hit to fair value from a severe recession. In our multi-asset portfolios, we added to our holdings of equities and credit over the few weeks around the lows. Our expectation was that markets would continue to be volatile and would have a hard time making too much headway given very high levels of economic uncertainty and the fact that most of that uncertainty was to the downside. Instead, over the following six weeks we saw a massive rally in risk assets, particularly equities. We got four to six years of “normal” equity returns in the space of less than two months. Meanwhile, our estimate of the downside risks to the global economy have not notably lessened. As a result, we have taken advantage of the higher prices to significantly reduce the effective equity weight in our multi-asset portfolios, turning some of it into long/short trades where we maintain exposure to relatively cheap stocks but reduce the portfolio’s sensitivity to overall market direction. We are not doing this out of a sense of certainty as to the market’s direction from here, but due to a belief that at current prices, markets seem to be pricing in something close to the best-case scenario. Such a scenario is certainly possible, particularly if an effective and widely available vaccine or strikingly effective treatment for Covid-19 were to be developed quickly. But if we do not get that happy outcome, we believe substantial losses would be likely across most equity markets. In the face of that unattractive risk/reward trade-off, we believe we can do better for our clients by taking more risk on the extraordinary relative stock selection opportunities the market is offering and less on the direction the stock market actually takes over the coming months. To that end, we have reduced our net equity exposure in our Benchmark-Free Allocation Strategy from around 55% to about 25%.
The Virus, the Economy, and the Market
By Jeremy Grantham
Executive Summary
The current P/E on the U.S. market is in the top 10% of its history. The U.S. economy in contrast is in its worst 10%, perhaps even the worst 1%. In addition, everything is uncertain, perhaps to a unique degree. The market’s P/E level typically reflects current conditions. Markets have historically loved fat margins, low inflation, stability and, by inference, low levels of uncertainty. This is apparently one of the most impressive mismatches in history. That being said, this is a new type of crisis and much will be different. There are no certainties but there are probably still some better and safer themes. Caution and patience are likely to be two of them.
To continue reading, scroll down or download here.
Uncertainty Has Seldom Been Higher
Oddly, Neither Has the Stock Market
By Ben Inker
As we have worked over the last couple of months to understand the likely impact of the pandemic on economies and asset classes around the world, the most striking feature is the extraordinary uncertainty of the path from here. Many things are possible, from a V-shaped recovery, to a longer slog as economies struggle to get back to “normal” without a rapidly available vaccine and/or widely available effective treatment, to a true global depression as the destruction of countless small businesses leaves millions upon millions out of work even after we do reach the other side of the pandemic. Throw in the possibility of an inflationary resurgence driven by the truly mind-blowing amounts of money that are being printed and spent by governments and central banks around the world to stave off the worst impacts of the pandemic’s toll and you have more potential uncertainty about what the next several years will bring than at any time since World War II.1 Our job is to try to understand the impacts of those scenarios on the assets we forecast and put together a portfolio that gives an attractive outcome in as many scenarios as we can manage. As our work was progressing this spring, so too was a striking rally in risk assets around the world. While the rally has been most pronounced in the U.S., risk assets have participated all over the world.
It has been a long time since the world faced a novel disease with such a dangerous combination of high contagiousness and significant lethality. The 1918 Spanish Flu pandemic was more than a century ago, and the more recent pandemic candidates have fortunately lacked either high levels of contagiousness (Ebola, SARS, MERS), or lethality (2009 Avian Flu) to create truly massive disruption to public health or the economy. Covid-19, unfortunately, is a true global menace. The impact on the global economy has been stark and shocking, with recent weeks bringing drops in employment and industrial production never before seen in history. As the scope of the potential damage started to become clear to investors in the first weeks of March, markets around the world entered into a freefall, with global stocks dropping 33% in a little over 4 weeks. Other risk assets took similar hits, with U.S. corporate high yield bonds and emerging sovereign debt each falling 21% and REITs falling 43%.2 While stocks came into this period generally expensive relative to history and credit spreads were on the tighter side, the fall created significant investment opportunities. Given the clear economic pain that the global economy was in for, we immediately marked down our estimate of fair value for equities around the world assuming an economic downturn approximately twice as bad as that of the Global Financial Crisis in 2008-09 (I’ll refer to this scenario as GFCx23). But despite that haircut, we found ourselves with a number of risk assets looking attractively priced, and we increased our holdings of stocks and high yield credit in our multi-asset portfolios. Given the uncertainties, we also began “stressing” our assumptions for an economic scenario materially worse than GFCx2.
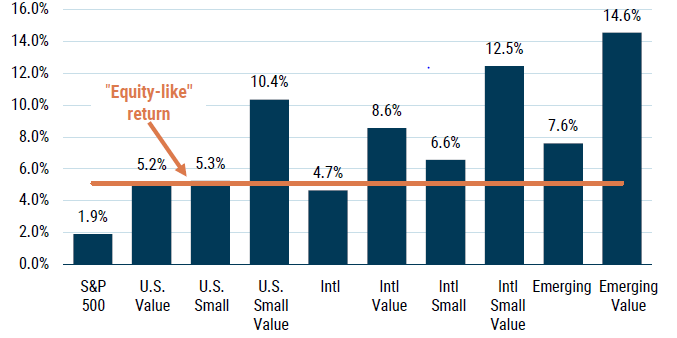
Putting firm probabilities on economic scenarios today is extremely difficult. Economic forecasting is a difficult proposition in the best of times. The fact that the economic outcomes from here significantly depend on the evolution of a pandemic caused by a virus that the world has a total of five months of collective knowledge about makes the task close to impossible. What we can say, however, is that the possibility of a very bad economic outcome, whether “W” or “L” or some other shape hitherto unknown to economics and the Roman alphabet, is much more material than is normally the case. The potential of such a dire event is always with us and, indeed, the primary justification for the equity risk premium rests on the dismal performance of equities in depression scenarios. If such events were not possible, equities would not need to be priced to deliver the long-term returns we all assume4 they will. However, normally we think of economic disaster scenarios as true tail events. It is unwise to allow their possibility to fall completely out of your imagination, but they don’t need to be thought of as part of the reasonably likely scenarios for the world economy. Today, that is no longer the case. Prudence suggests that investors with the need to exist in the long run must contemplate what kind of a hit a depression scenario would inflict on both their portfolios and the overarching entity or need that the portfolios exist to serve. And with a rapidity seldom matched in history, equities have gone from plausibly priced for very bad outcomes to more or less ignoring the possibility. Exhibit 1 shows a version of our equity forecasts from March 23, 2020. It’s a version few of you have seen before as it is a blend of our full mean reversion and partial mean reversion forecasts, which we usually show separately. For this purpose, the difference between those two scenarios isn’t all that important, as they both assume that economically things wend their way back to “normal” over seven years.5 In this case, we have also incorporated our first-pass estimate of the hit to fair value in each of the equity groups from a GFCx2 event.6 While U.S. large cap equities still looked somewhat overvalued at those prices, global equities in general seemed to have priced in a bad economic event and left room to earn an “equity-like” return7 despite the hit.
Exhibit 1: Blended Forecasts as of March 23, 2020
Source: GMO
These forecasts are an average of the mean reversion and partial mean reversion scenarios for GMO’s asset class forecasts, adjusted for the expected deterioration of fundamentals associated with an event of twice the magnitude of the 2008-09 Global Financial Crisis.
Given these attractive forecasts, we felt comfortable adding to our allocation to equities, allocating to both international large and small value and emerging value stocks, along with the new GMO Cyclical Focus Strategy, built and managed by our Focused Equity team. This portfolio focuses on the stronger companies within industries that have been hard-hit by a downturn.8
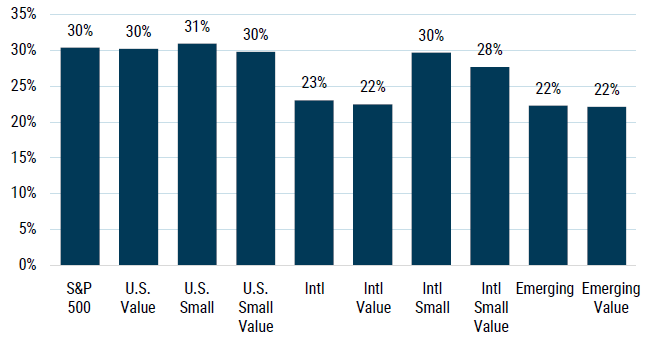
Given the wide scope of the rally since March, we feel that all of the equities we bought in March and April remain very cheap relative to broad markets, but since March 23rd we have seen a rally of frankly stunning proportions, as we can see in Exhibit 2.
Exhibit 2: broad market returns
Source: S&P, Russell, MSCI, GMO | Data from 3/23/2020-4/30/2020
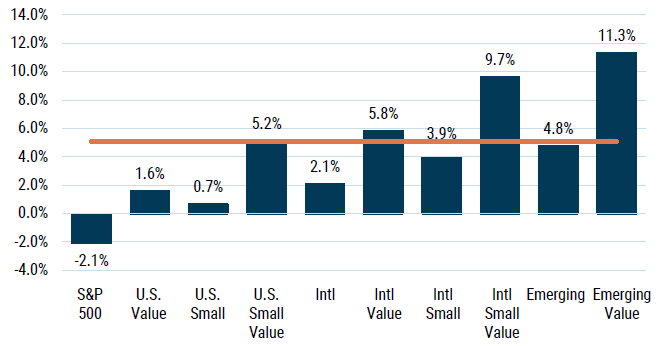
To put the rally in perspective, the group that went up the least, International Value stocks, earned the equivalent of 4.4 years of an “equity-like” return for a fair-valued group of stocks. U.S. large and small cap stocks rose the equivalent of 6 years of “equity-like” returns. Given that we didn’t learn anything between March 23rd and April 30th that should have meaningfully altered our estimation of the plausible economic scenarios from here, this understandably has had a negative effect on our forecasts. Exhibit 3 shows what those forecasts looked like as of April 30, 2020.
Exhibit 3: Blended Forecasts as of April 30, 2020
Source: GMO
We believe non-U.S. value stocks and global small cap value are still priced to give a fair return or better in a bad economic scenario, but now neither U.S. large value nor broad developed markets outside of the U.S. are priced to deliver anything particularly close to a “fair” return. In fact, the only group outside of the value style at all which is priced to deliver a “fair” return in a bad economic scenario is emerging markets. To be clear, that is not due to an assumption on our part that emerging markets will avoid a fundamental hit in such an event. In fact, we assume the GFCx2 scenario is worse for emerging market stocks on average than it is for developed market stocks. However, it is an oversimplification to assume that all emerging countries are poorly positioned for the pandemic. Some of them certainly are – much of Latin America and Africa, for example, lack both the public health resources and fiscal and monetary space to cushion the blow from Covid-19. But the east Asian countries are generally handling things much better, taking advantage of what they learned in dealing with the SARS outbreak 17 years ago. Our Emerging Domestic Opportunities team has built a Covid preparedness ranking of both emerging and developed countries. While the worst positioned countries are all emerging ones, so are most of the best, with 58% of the MSCI EM Index in countries that look quite well-positioned to handle the pandemic against about 11%, which are in the worst positioned category.9 But while the ability of some of these economies to handle the crisis well is helpful, the primary reason we believe emerging stocks should give a higher return is simply that they are trading at much lower valuations, which leaves significant room for normalized earnings to fall while still providing a good return to shareholders. Emerging market value stocks are far cheaper still, and today seem priced to offer a double-digit expected return in a GFCx2.
Market prices almost always move in a more volatile fashion than fair values. Under normal circumstances, we are prepared to let our equity portfolios “run” for a while during a rally, given that value-driven forecasts tend to be too quick to buy or sell equities in bull and bear markets. That pattern does still seem to hold more often than not in rapid falls and rises as well as more gradual ones. However, in this case we do not merely have stocks whose valuations have deteriorated quite quickly, but we also have a much higher than average possibility of a very bad economic outcome, which would mean significantly worse outcomes for stocks than what is embodied in our forecasts. That bad outcome is by no means assured. We can all hope that it will be avoided, and the somewhat extravagant promises of vaccine developers prove to be true. But it no longer seems prudent to hold onto an equity-heavy portfolio given that first, returns in anything other than the optimistic case look to be disappointing, and second, that we can maintain good returns by shorting out broad equity indices against the value stocks we hold that look priced to withstand plenty of bad news.
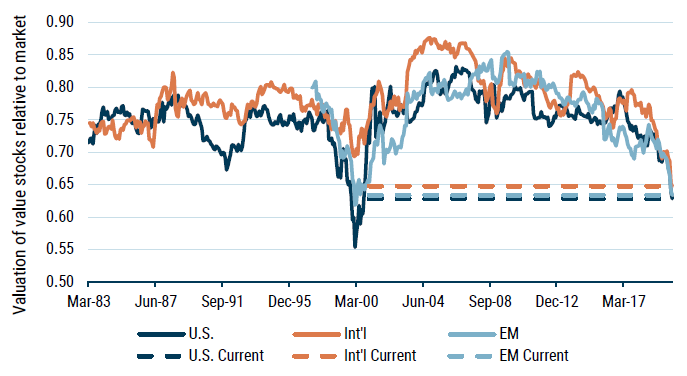
We have written extensively on the attractiveness of value stocks over the past year or so, and I don’t want to rehash all of that here. But a picture is worth a thousand words and is a lot quicker to read, so Exhibit 4 shows the discount to value stocks in the U.S., EAFE, and emerging markets over time.10
Exhibit 4: Spread of Value for MSCI Regional Value Factors
Source: MSCI, Worldscope, GMO | As of 4/30/2020
Valuations are a blend of four different value measures for MSCI Value regional indices relative to their base regional index.
Value stocks in EAFE are trading at the largest discount they ever have in history. Emerging value stocks are trading at a slightly bigger discount than that, a level they breached only one month before in history. The spread is slightly wider still in the U.S., even if we are “merely” at the relative valuation level of early December 1999. But while things proceeded to get even more extreme in the U.S. for several more months, value stocks beat the broad market by 6%, 17% and 26% over the next 1, 2, and 3 years from when they hit the current level of discount in the internet bubble.11
Conclusion
Investing always involves making decisions under uncertainty. We seldom feel we know what the market will do in the near term. We do not feel we know what the short term will bring here, either. While many stocks appear to us to be overvalued today, overvalued stock markets are nothing new. What is new is the meaningful possibility of a disastrous economic outcome combined with a substantially overvalued stock market. The disaster scenario is by no means a certainty. But it is plausible enough that we want to invest in a way that mitigates the losses should it occur, as long as that can be done without costing too much in expected returns for less dire scenarios. Simply holding cash would remove the downside in the disaster scenario, but cash offers no return today. Moving from stocks to cash would be trading the possibility of a horrible outcome against the certainty of an inadequate one. Happily, we are not restricted to that choice. In aggregate, global value stocks are cheaper relative to the market than they have ever been apart from a month or two in the TMT bubble. That cheapness buys a lot of margin of safety for a bad economic outcome while still providing an expected return higher than developed stock markets.12 We believe that a combination of that spread and a long position in emerging market value stocks – the cheapest stocks in the world – provides a far better risk/reward trade-off than a traditional equity position at this point in time.
The Virus, the Economy, and the Market
By Jeremy Grantham
My simple life at GMO of focusing most of my efforts on climate change related investing was rudely interrupted by the coronavirus. The virus is a bottomless pit of complexity, contradictory data, and guesswork.
The interactions of the virus with the economy and new economic measures are the same: complex and without precedent.
And the interactions with the market psychology of these medical, financial, economic, and political actions, well, as any self-respecting gangster would say, “Fuhgeddaboudit.” So, starting in late January – yes, I was way ahead of the U.S. and the U.K. administrations, both spectacularly slow to get the point – I have been spending twice my usual total research time on all these new interactions, which for anyone interested in data analysis have presented an amazing challenge. The good news is the days flash by. The bad news is that new data arrives faster than humans can keep up with.
For now, let’s get this on the table.
There are no certainties here. At GMO we dealt with three major events prior to this crisis, and rightly or wrongly, we felt “nearly certain” that sooner or later we would be right. We exited Japan 100% in 1987 at 45x and watched it go to 65x (for a second, bigger than the U.S.) before a downward readjustment of 30 years and counting. In early 1998 we fought the Tech bubble from 21x (equal to the previous record high in 1929) to 35x before a 50% decline, losing many clients and then regaining even more on the round trip. In 2007 we led our clients relatively painlessly through the housing bust. In all three we felt we were nearly certain to be right. Japan, the Tech bubbles, and 1929, which sadly I missed, were not new types of events. They were merely extreme cases akin to South Sea Bubble investor euphoria and madness. The 2008 event also was easier if you focused on the U.S. housing euphoria, which was a 3-sigma, 100-year event or, simply, unique. We calculated that a return trip to the old price trend and a typical overrun in those extreme house prices would remove $10 trillion of perceived wealth from U.S. consumers and guarantee the worst recession for decades.
All these events echoed historical precedents. And from these precedents we drew confidence.
But this event is unlike all those. It is totally new and there can be no near certainties, merely strong possibilities. This is why Ben Inker, our Head of Asset Allocation, is nervous and this is why you are nervous, or should be.
Everyone can see and feel that this is different and can sense the bizarre nature of the market response: we are in the top 10% of historical price earnings ratio for the S&P on prior earnings and simultaneously are in the worst 10% of economic situations, arguably even the worst 1%!
And worse, we had U.S. and global problems looming before the virus: an increasingly disturbed climate causing global floods, droughts, and farming problems; slowing population growth, in the developed world, soon to be negative; and steadily slowing productivity gains, especially in the developed world, and therefore a slowing GDP trend. In the U.S., our 3%+ a year trend is down to, at best, 1.5% in my opinion. It is closer to a 1% maximum in Europe. We had, as mentioned, top 10% historical P/Es in the U.S. and much the highest debt level ever in the U.S. for both corporations and peacetime government. So, after a 10-year economic recovery, this would have been a perfectly normal time historically for a setback.
And then the virus hit.
Simultaneously, it is causing supply and demand shocks unlike anything before. Ever. It is generating a much faster economic contraction than that of the Great Depression. And unlike 1989 Japan, 2000 Tech (U.S.), and 2008 (U.S. and Europe), it is truly global. The drop in GDP and rise in unemployment in four weeks have equaled what took one to four years to reach in the Great Depression and were never reached in the other events. Rogoff & Reinhart, Harvard Professors who wrote the definitive analysis of the 2008 bust, agree that this event is indeed completely different and suggest it will take at least 5 years to regain 2019 levels of activity. But this is a guess. We really don’t know how long it will take. Nearly certain is that a V-shaped recovery looks like a lost hope. The best possible outcome would be that there will be, almost miraculously, billions of doses of effective vaccine by year-end. But most viruses have never had a useful vaccine and most useful vaccines have taken well over five years to develop and when developed have been only partially successful. Yes, this time there will be an enormous effort with unprecedented spending. But still, a leading vaccine expert says quick success would be like “drawing successfully to several inside straights in a row.” And even if all works out well with a vaccine there will remain deep economic wounds.
Bankruptcies have already started (Hertz on May 22nd) and by year-end thousands of them will arrive into a peak of already existing corporate debt. It will need spectacular management, which it may get. But it may not. Throwing money – paper and electronic impulses – at the problem can help psychology and, particularly, the stock market, where extra stimulus money can end up but does not necessarily put people back to work; there will be up to 20% unemployment for at least a moment.
Sound and massive infrastructure spending would address the problem better, including greening both the grid and energy production. At least the size and speed of the initial financial help, which fortunately we learned to do in the housing financial bust, has saved us from the certainty of Great Depression II. But this is only round one. And many global administrations are, shall we say, not consistently sensible.
Unanticipatable outcomes seem to be guaranteed. We will all have had an enforced several months of introspection. This could turn out to be a fulcrum, or tipping point, for new social and business trends: deficiencies in capitalism; inequality; climate change and our environment: limited resources in a finite world; our current high consumption economy; growth at any price.
Attitudes to several of these factors were already beginning to shift before the virus. Resistance to the downsides of the status quo was already stirring. Now, all may be up for grabs.
In short, we have never lived in a period where the future was so uncertain. Yet the market is 10% below its previous high in January when, superficially at least, everything seemed fine in economics and finance. And if not “fine,” well, good enough. The future paths include many that could change corporate profitability, growth, and many aspects of capitalism, society, and the global political scene. Some perhaps for the better, but some not. The key here is uncertainty, which in some ways seems the highest in my experience. So, in terms of risk and return – particularly of the worst possible outcomes compared to the best – the current market seems lost in one-sided optimism when prudence and patience seem much more appropriate.
Summary
The few-line summary of my argument is this: the current P/E on the U.S. market is in the top 10% of its history. The U.S. economy in contrast is in its worst 10%, perhaps even the worst 1%. In addition, everything is uncertain, perhaps to a unique degree. The market’s P/E level typically reflects current conditions (please see Appendix). Markets have historically loved fat margins, low inflation, stability and, by inference, low levels of uncertainty. This is apparently one of the most impressive mismatches in history. That being said, this is a new type of crisis and much will be different. There are no certainties but there are probably still some better and safer themes. Caution and patience are likely to be two of them.
Appendix: Explaining P/E
Over 20 years now, Ben Inker and I have done a lot of work on explaining price earnings multiples. Yes, the market occasionally gets impacted by panics and euphoria, but mostly it reflects the current data. It is a coincident indicator of comfort. Factors that disturb it depress the ratio. And the most important drivers are profit margins and current inflation. No surprises – the market loves high margins and hates high inflation. Exhibit 1 shows the data. Things can always change and precedents can become irrelevant, but the bet here is that for the next few quarters earnings and profit margins will be crushed and sometime during that depressed phase P/E ratios will also be pulled down as is typical, giving us a lower multiple of substantially lower earnings.
EXHIBIT 1: Inker-Grantham Behavioral Model to Explain P/E
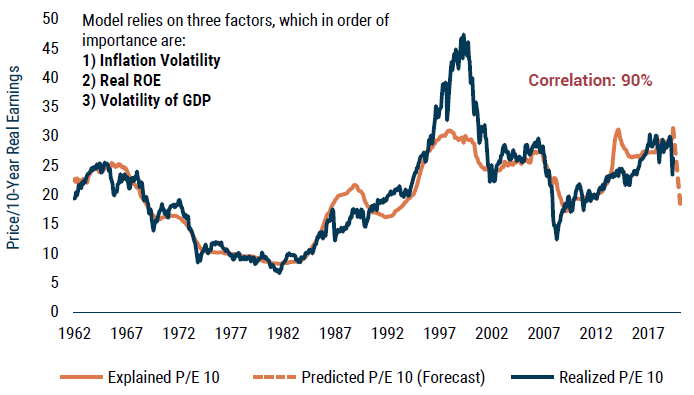
As of 4/30/20 | Source: GMO
Note: Normalized Earnings Yield (E10/P) is regressed on the three factors listed above to come up with predicted earnings yield. Its reciprocal is the explained P/E 10. Forecast for future “fair P/E 10” assumes that the market’s profitability will drop by 30% and that inflation and GDP volatility will rise to 2008-like levels as new data comes in.

