Executive Summary
Fourth quarter emerging debt returns reflected the continued improvement of global economic and market conditions. The external debt EMBIG-D index was up +5.8% amid tightening credit spreads, offsetting any losses from higher U.S. Treasury yields. The local debt GBI-EMGD index was also up, by +9.6%, due mainly to strong currency returns (+7.4%), though local rates also produced gains (+2.2%).
As we enter 2021, our valuation metrics for emerging external debt are less compelling than they were at the beginning of the quarter because of the continued rally. However, we view much of this change as being a result of spreads normalizing as transaction and liquidity stresses have been reduced. Valuations continue to remain within the historical range that we consider attractive, and the fundamentals of a majority of the emerging market asset class remain supportive of positive valuations going forward. While emerging currencies are currently within the neutral range of fair value, they also remain attractive relative to the past 10-year average. In addition, despite the continued recovery in local interest rates in Q4, real interest rate differentials between emerging and developed markets remain consistent with recent historical norms. In other words, rates rallied nearly everywhere, so relative value did not change much.
In this piece, we update our valuation charts and commentary, with additional detail on our methodology available upon request.1
External Debt Valuation
The EMBIG-D benchmark spread tightened by more than 80 bps in Q4. As seen in Exhibit 1, the multiple of the benchmark’s credit spread to the spread that would be required to compensate for credit losses fell over the course of the quarter. That multiple stood at 2.6x on December 31, 2020, down from 3.2x on September 30. Based on historical experience, this multiple of 2.6x is inching toward the level that we would deem unattractive, and significantly less attractive than what prevailed at the end of March (7.2x), right around the peak of the sell-off.
Exhibit 1: Long-Term View of the “Fair Market Multiple” for Emerging External Debt
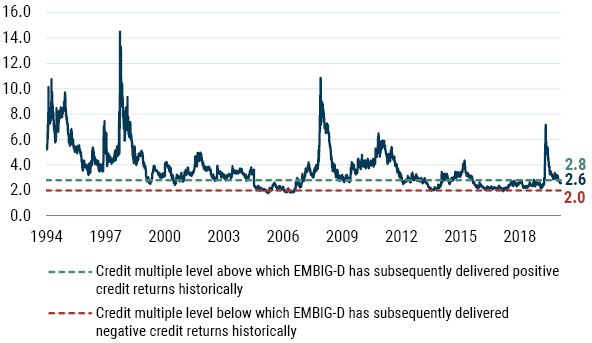
As of 12/31/20 | Source: GMO calculations based on Bloomberg and J.P. Morgan data
Credit spread tightening was the main reason for the decrease in the multiple over the quarter, as the multiple’s denominator – the fair value spread or expected credit loss – rose marginally by 2 bps to 136 bps at the end of December. Regular readers will recall that this fair value spread is a function of the weighted-average credit rating of the benchmark, along with historical sovereign credit transition data and an assumption about recovery values given default. In terms of the fourth quarter, the fair value spread was influenced by a handful of downgrades including Oman (BB- to B+ in October), Panama (BBB+ to BBB in November), and Sri Lanka (B- to CCC+ in December). Additionally, a number of countries await the results of restructuring negotiations, including Lebanon, Suriname, and Zambia.
The preceding was a discussion of the level of spreads, or credit cushion. From a total return standpoint, the level and changes of the underlying risk-free rate also matter. In the fourth quarter, U.S. Treasury yields rose, with the 10-year yield rising by 23 bps and having a negative impact on benchmark returns. We measure the “cushion” in Treasuries by the slope of the forward curve of the 10-year swap rate, depicted by the light-font lines in Exhibit 2. The interest rate “cushion” (which we proxy as the slope of the forward curve) continues to be low by historical standards, meaning a sharp rise in the 10-year Treasury yield would be a surprise to the market. The slope of the 10-year forward curve ended the quarter at 47 bps, 12 bps higher than the 35 bps of the prior quarter. We would view this as a positive relative to the previous quarter.
Exhibit 2: 10-Year U.S. Treasury Swap Curves at Quarterly Intervals
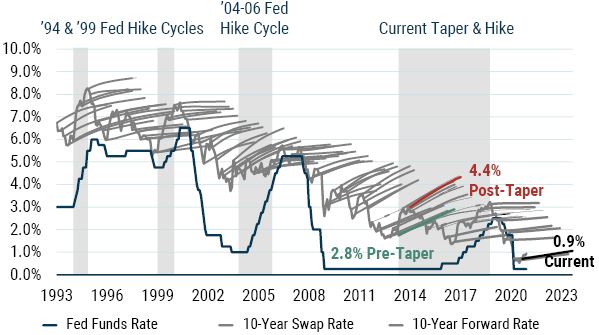
As of 12/31/20 | Source: GMO
Liquidity
One key feature of emerging markets is liquidity and GMO’s external debt portfolio benefits from and takes exposure to the liquidity premium in emerging markets. Emerging market debt is a risk asset and bid-ask spreads typically widen in times of a crisis. As Exhibit 3 shows, bid-ask spreads came in by nearly 135 bps since the high of 2.2% on March 23, ending the year at 0.9%.
Exhibit 3: EMBIG-D Bid-Ask Spread (% of price) September 2019 – September 2020
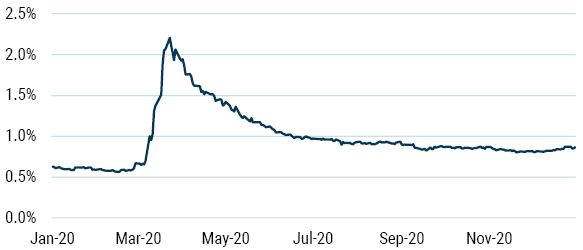
As of 12/31/20 | Source: GMO, Haver, J.P. Morgan
It’s important to note that bid-ask spreads tend to revert to a standard level (historically, 0.8%) after widening during times of crisis, and this time appears to be no different. In Exhibit 4 we see how bid-ask spreads behaved during such crises as the Mexican peso crisis (1995), Russian financial crisis (1998), and the Global Financial Crisis (2008), and their following stabilization. From the pinnacle of the Mexican peso crisis in January 1995, it took about six months before bid-ask spreads stabilized, and roughly one year for bid-ask spreads to stabilize following the Russian financial crisis and the Global Financial Crisis.
We continue to believe that the stabilization of bid-ask spreads following the impact of the Covid-19 pandemic and oil shocks will be quicker relative to prior crises. Our strategy focuses on instrument selection and tends to own securities with a lower liquidity profile than the benchmark. We are long-term oriented investors and liquidity providers in this type of market, and our process is able to identify dislocations and opportunities to pick up attractively priced securities. This approach positions us well for alpha versus the benchmark going forward.
Exhibit 4: EMBIG-D Bid-Ask Spread (% of price), Since December 1993
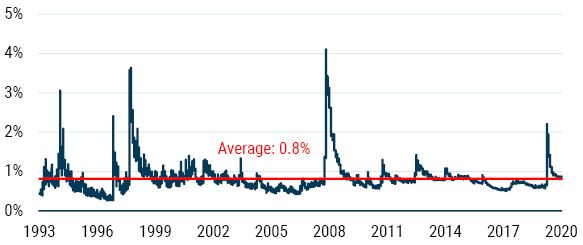
As of 12/31/20 | Source: GMO
Local Debt Markets Valuation
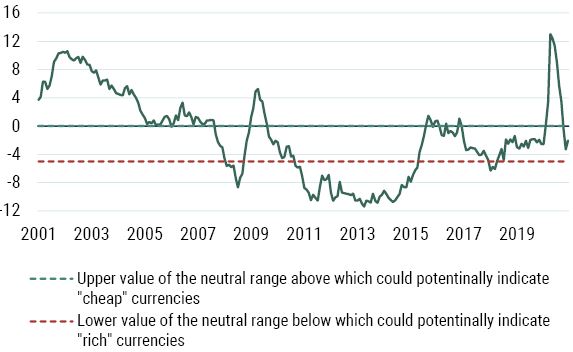
Exhibit 5 provides a time series of our model’s estimate of the GBI-EMGD’s spot FX valuation. Recall that our model analyzes trends in macroeconomic fundamentals such as balance of payments composition and flows, valuation of the currency, and the economic cycle, and uses a regression analysis to produce an estimate of total expected FX returns for each country in the GBI-EMGD benchmark. These are then combined into a single value of a total expected FX return using a market cap weighted average of currencies in the GBI-EMGD. We then deduct the GBI-EMGD weighted carry from the estimated GBI-EMGD weighted value of total FX expected return to get to an expected EM FX spot return. Finally, we estimate a neutral range based on the backtest of the overall model to assess whether EM currencies are cheap, rich, or fairly valued. A value that is higher (lower) than the upper (lower) value of the neutral range could potentially indicate “cheap” (“rich”) currencies. A value that is within the neutral range would be considered “fair.” EM currencies, while not cheap outright, ended 2020 more or less in the middle of the neutral range, while remaining attractive relative to the past 10-year average. We note that were one to adopt a more fundamentals-based rather than a behavioral and sentiment-related model, EM FX would look more attractive. Our own decomposition of the model into these categories supports this view and, scanning the various sell-side and buy-side recommendations, it would appear that many use similar valuation-based factors in support of their view in favor of EM FX.
Exhibit 5: GBI-EMGD Expected Spot FX Return Given the Fundamentals
As of 12/31/20 | Source: GMO
As a final comment on EM currency valuation, we also consider the current valuation of major DM currencies. This is useful to the extent that EM currencies as a complex often present a high beta trade opportunity vs. DM. While our process is focused on EM relative value by design, we do need to consider the overall valuation of major DM currencies to ensure that a secular move of major DM currencies against EM as a complex does not negatively affect EM relative value currency opportunities. In this regard, when we consider valuations using a similar model for EUR and CAD, we find them to be in neutral territory currently. Neither currency is overvalued relative to historic norms, suggesting that a continued focus on EM currency relative valuation is reasonable given current valuations.
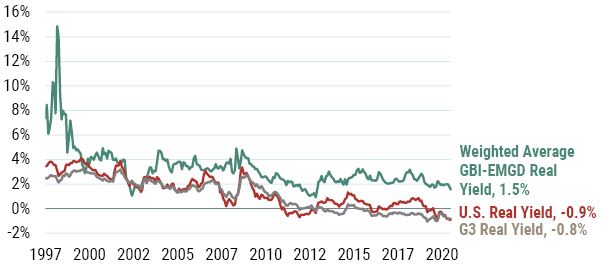
As for emerging market local interest rates, we consider differentials in real yields to gauge the relative attractiveness of EM against developed markets (see Exhibit 6). In this regard, the story that has been in place for many quarters (years, actually) remains as we can still see a substantial positive gap between EM and DM real yields. That gap tightened during the quarter as emerging real yields fell by 42 bps to 1.5%. Real yields fell in Q4; nominal yields produced gains when compared to the subdued performance of the previous quarter, while inflation forecasts increased in most EM countries as global demand picked up following the decline shaped by the global Covid-19 pandemic. The spread between EM and U.S. real yields tightened by 33 bps during the quarter, to 246 bps. While this spread had been fairly stable for several years running, the 5-year average of this spread rose slightly to 221 bps from 220 bps at the end of Q4. By our calculations, the real yield in the U.S. fell to -0.9% in December from -0.8% in September, and while the European real yield remains firmly in negative territory, the Japanese real yield remained positive for a third consecutive quarter.
Exhibit 6: Inflation-Adjusted Bond Yields
As of 12/31/20 | Source: GMO
Download article here.