Listen to this Insight
International deep value stocks are a high-conviction, active position across all GMO Asset Allocation portfolios. We define the deep value group of securities as the cheapest 20% of the market, a broad opportunity set that allows us to construct portfolios that are cheaper than traditional value indexes but still high in quality. So far, this bet has paid off: GMO’s deep value strategies have delivered truly impressive performance, yet they remain attractively priced.
Our thesis? International deep value has shown potential for future outperformance:
- Attractive valuations in non-U.S. markets as opposed to the U.S. market, which has become increasingly expensive and concentrated
- Exposure to cheap currencies like the yen, euro, and pound sterling
- Historically wide value spreads, meaning that deep value has the potential for strong outperformance in a mean reversion scenario.
Outperformance through active management
While each of these factors has contributed to strong recent performance, meaningful reversion potential remains. The active opportunity set for GMO’s deep value portfolios continues to be robust, supported by security selection alpha and active portfolio rotation.
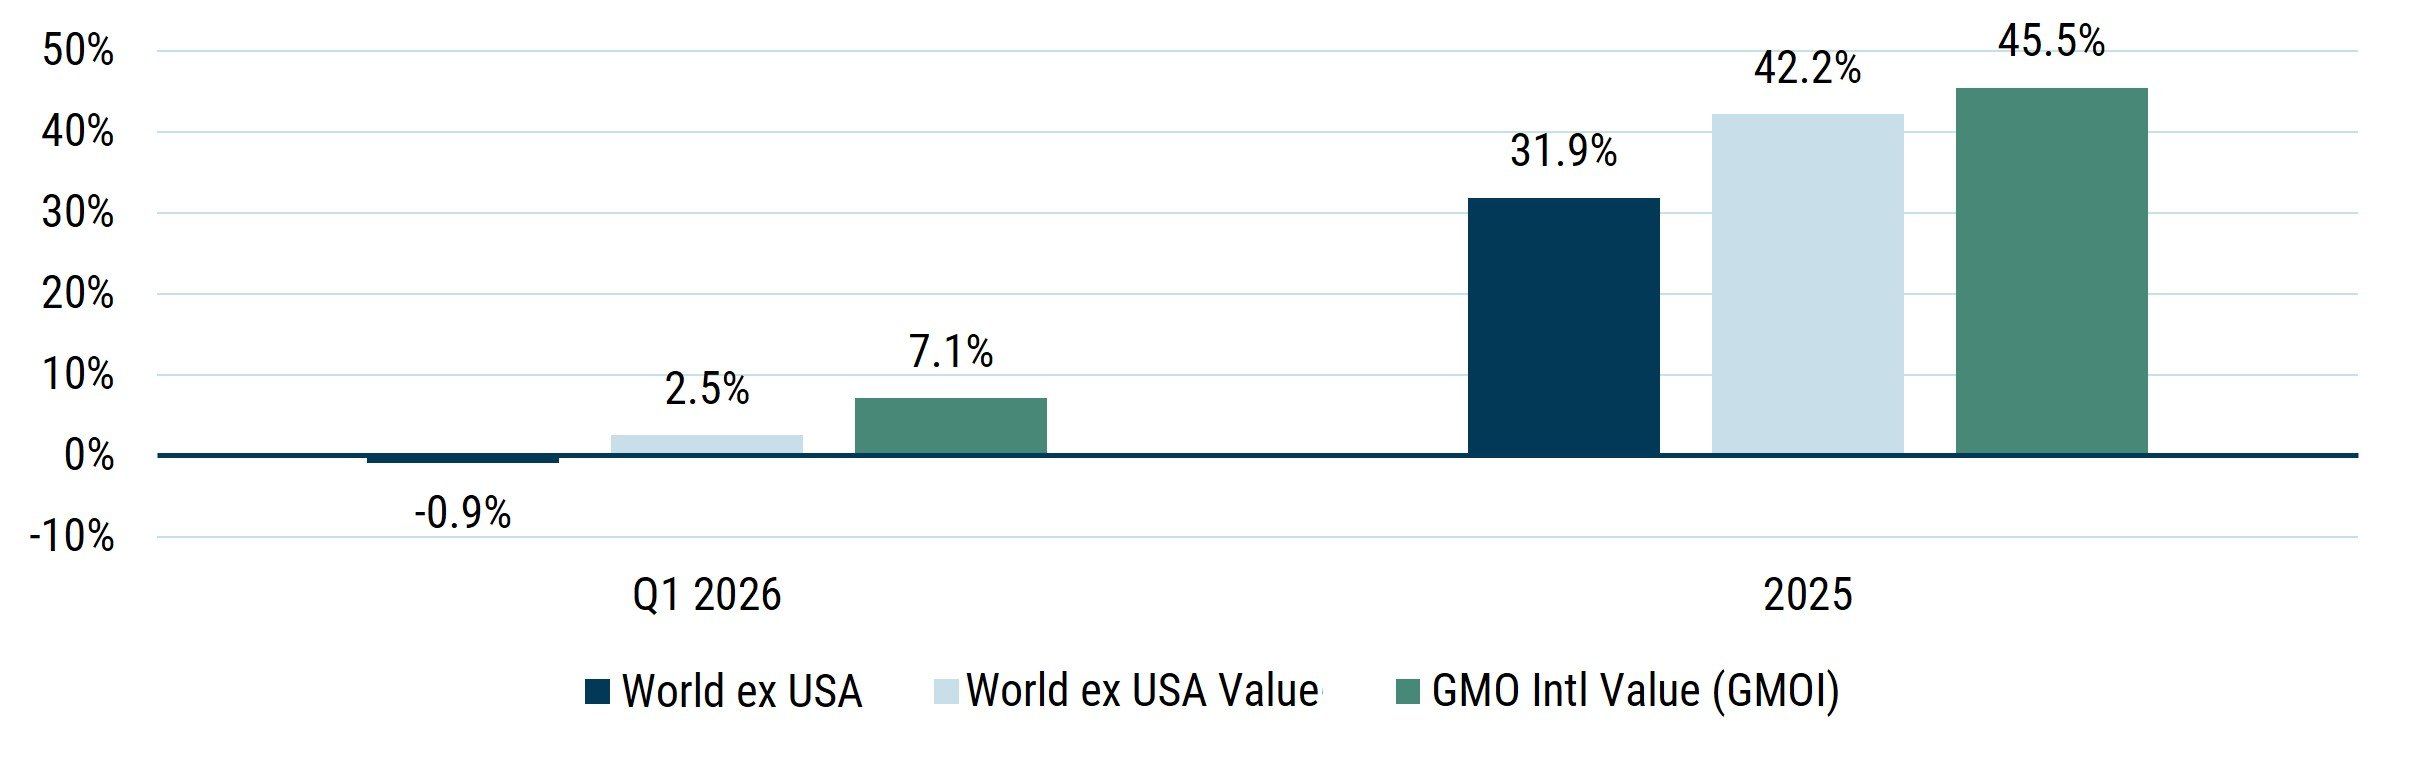
To illustrate, we focus on one of our deep value strategies, the GMO International Value ETF (GMOI). As shown in Exhibit 1, GMOI extended its 2025 outperformance through Q1 of 2026.
Exhibit 1: Value Was Priced to Outperform and Has Delivered
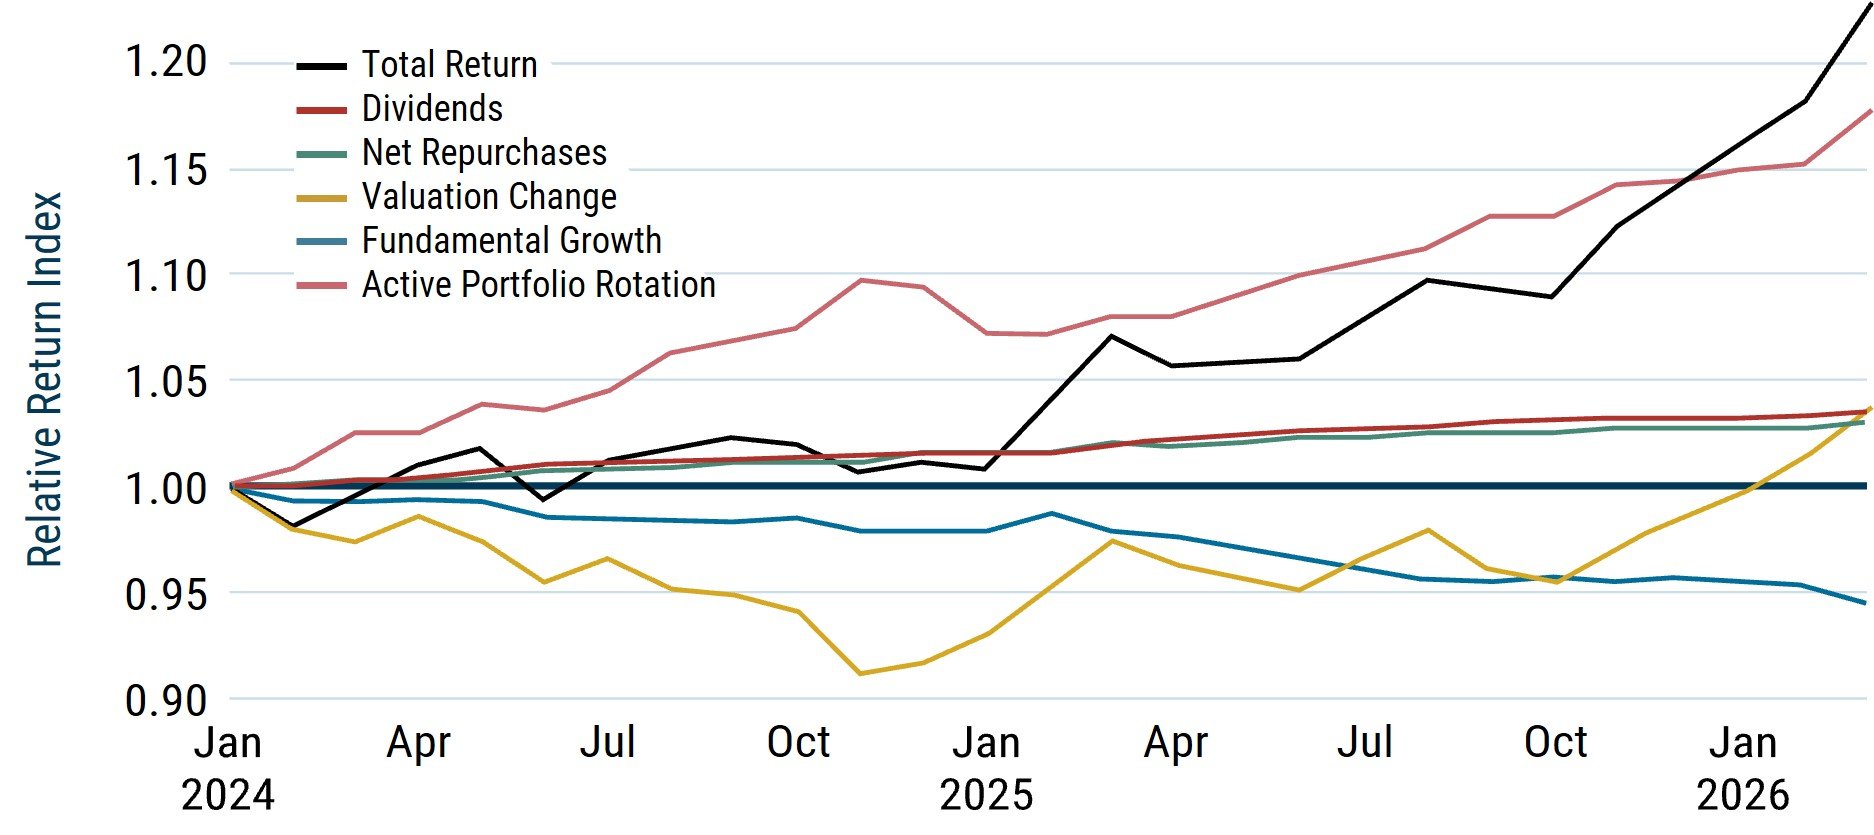
The primary driver of GMOI’s return relative to the MSCI World ex USA universe has been active portfolio rotation: the process of monetizing successful security selection by selling winners and reinvesting the proceeds in more attractively priced opportunities. We believe this rotation, an enduring feature of value groups, positions the GMOI portfolio for continued success.
Importantly, the realized relative return from valuation change remains modest. As shown by the yellow line in Exhibit 2, valuation change (the portfolio repricing and getting relatively more expensive) has contributed little to relative returns. This means the portfolio’s discount to the universe remains as wide as it was at the start of 2024.
Exhibit 2: Return Decomposition of GMO International Value (GMOI)
Relative Return Decomposition: GMO International Value vs. World ex USA (01/2024+)
Source: Worldscope, Compustat, MSCI, GMO
MSCI data may not be reproduced or used for any other purpose. MSCI provides no warranties, has not prepared or approved this report, and has no liability hereunder. Please visit https://www.gmo.com/americas/benchmark-disclaimers/ to review the complete benchmark disclaimer notice.
A standout performance contributor: Banks
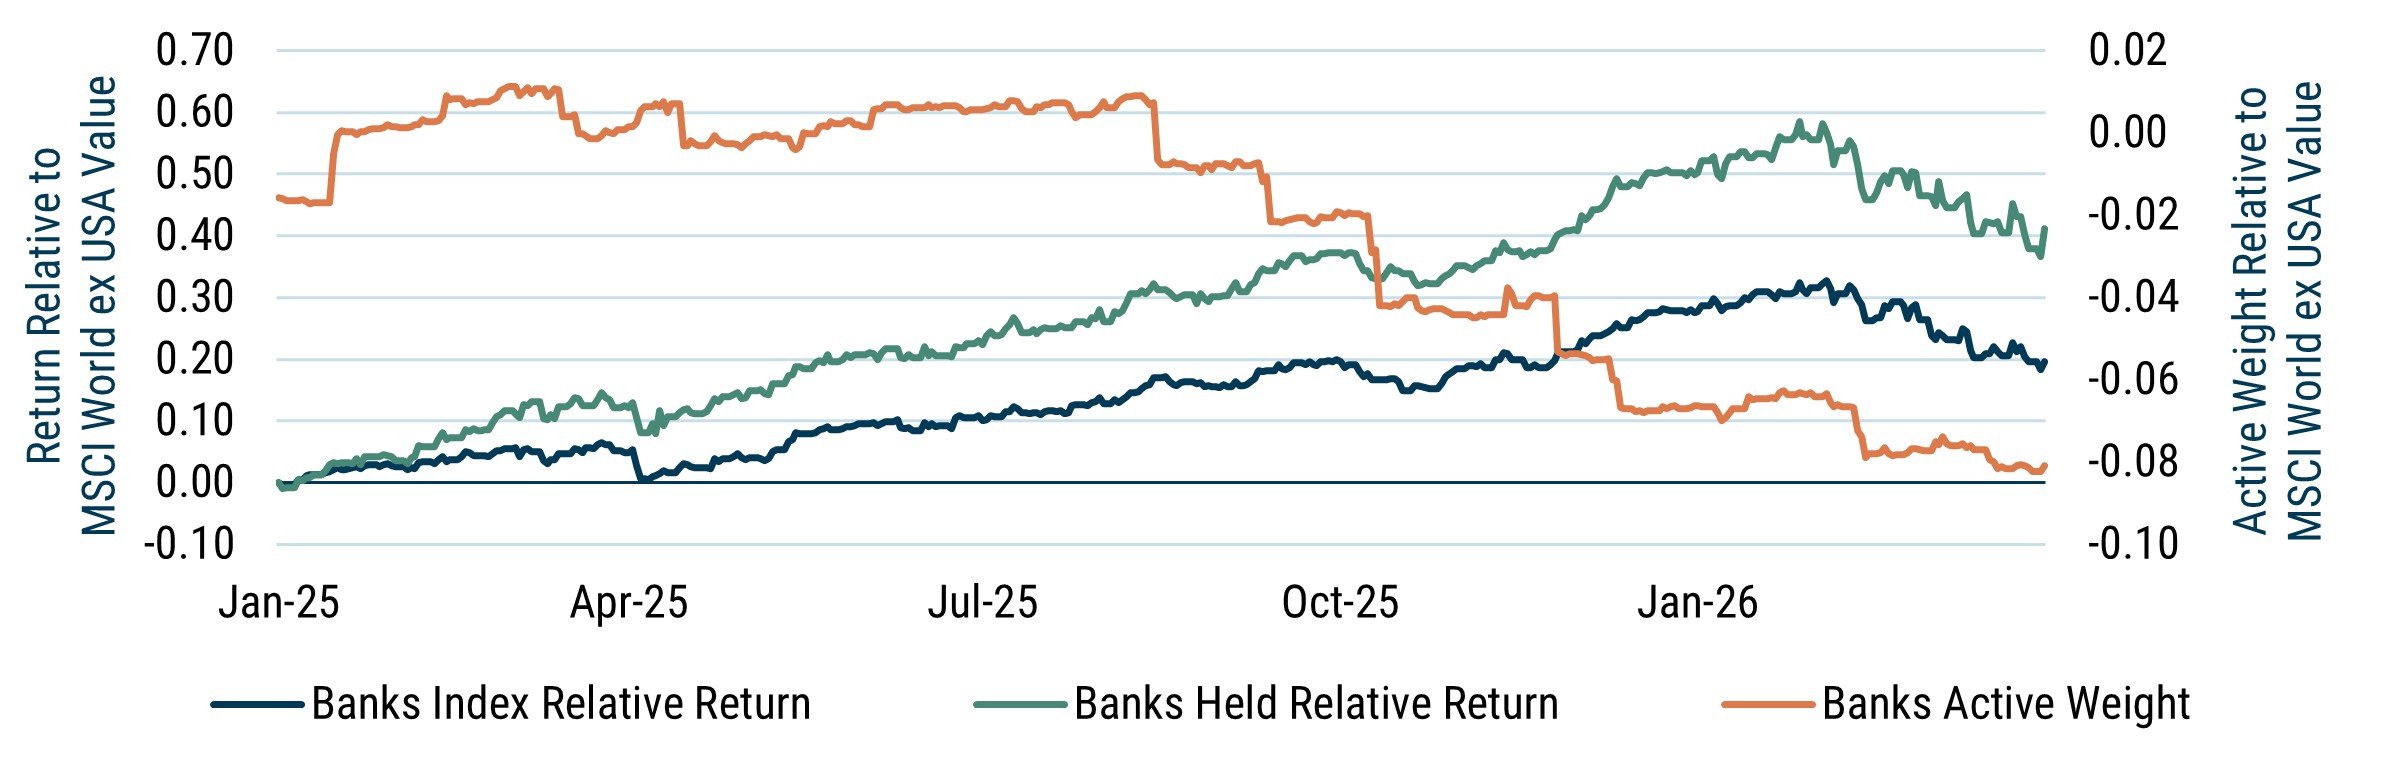
Banks provide a clear example of how security selection and portfolio rotation combine to drive alpha. At the beginning of 2025, GMO’s value models identified numerous attractive opportunities within the sector. From that point through January 31, 2026, banks outperformed the MSCI World ex USA Value index by 32 percentage points. The banks held in the GMOI portfolio outperformed the index by 56 percentage points over the same period, reflecting strong security selection.
As this excellent performance materialized, GMOI systematically reduced exposure, lowering the portfolio’s active weight in banks to -8% by the end of Q1 2026. At the same time, we reinvested the proceeds in attractively priced securities across industries and sectors, including insurance, financial services, telecommunications, pharmaceuticals, automobiles, transportation and energy. This rotation proved additive: banks underperformed the ex USA Value index in February and March 2026, while an overweight to energy helped relative returns amid heightened geopolitical volatility.
Exhibit 3: Banks—A Standout Performance Contributor
GMO International Value
MSCI WORLD EX USA INDEX BANKING INDUSTRY GROUP
Source: MSCI, GMO
Please see important disclosures at the end of the presentation.
MSCI data may not be reproduced or used for any other purpose. MSCI provides no warranties, has not prepared or approved this report, and has no liability hereunder. Please visit https://www.gmo.com/americas/benchmark-disclaimers/ to review the complete benchmark disclaimer notice.
Valuations still leave room for reversion
As a result of this active rotation, the portfolio continues to exhibit a substantial relative valuation advantage, despite strong realized performance. As of March 31, 2026, GMOI traded at a roughly 40% discount to the MSCI World ex-US index (on par with its relative valuation as of December 31, 2024) and a roughly 60% discount to the S&P 500.
Exhibit 4: Portfolio Trades at a Deep Discount Despite Strong Realized Outperformance
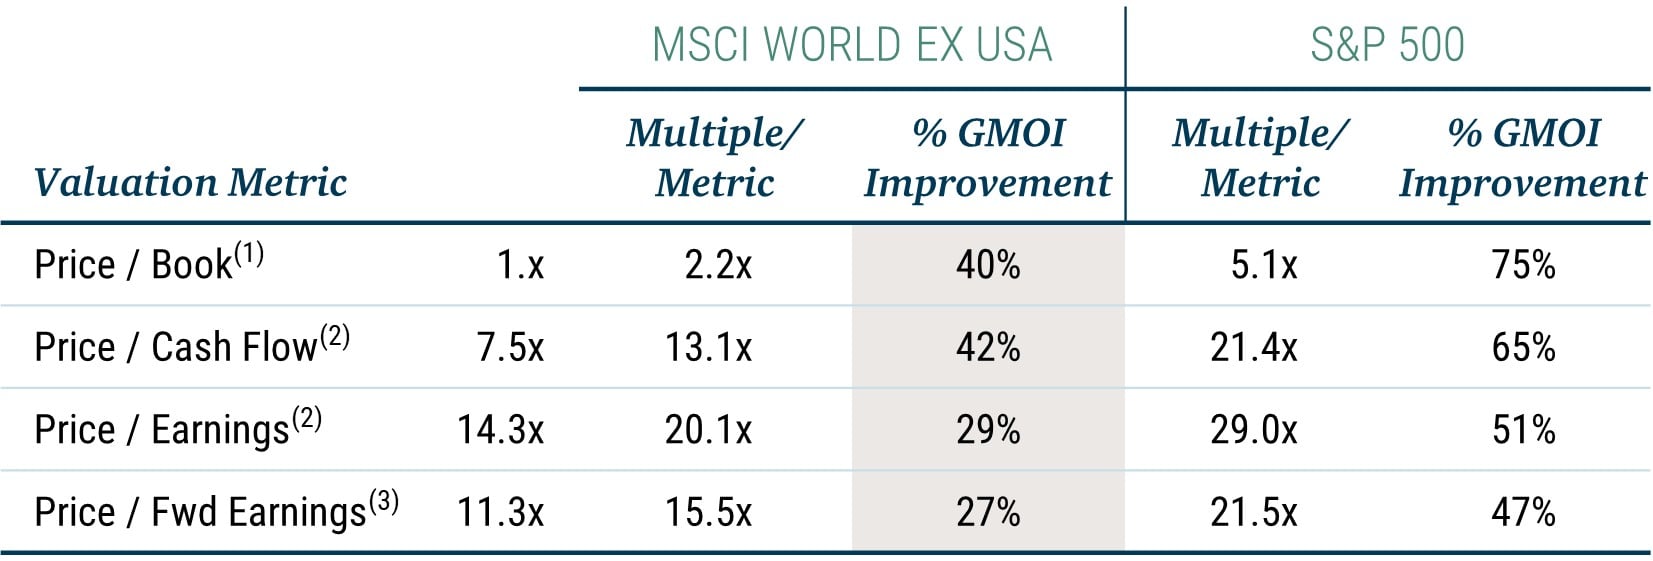
(1) Historical 1-year weighted average
(2) Historical 1-year weighted median
(3) Forward 1-year weighted median
Tapping the potential
Despite strong realized performance, we believe international deep value continues to offer a compelling forward looking opportunity. Valuations remain deeply discounted, currency exposures are still favorable, and value spreads remain historically wide. Considering these conditions, it appears that much of the reversion potential may still be present.
Importantly, the opportunity is not purely about exposure to the value factor. GMO’s deep value portfolios continue to benefit from a broad and liquid opportunity set, where disciplined security selection and ongoing portfolio rotation allow us to harvest alpha while continually refreshing future return potential.
For additional perspective on this investment theme, see our Year-End Letter for 2025: Deep Value.