Executive Summary
As we turn over the page to a new year, there are plenty of decisions that investors will need to make. We all want to make the right decisions, but perhaps even more important is to avoid making the wrong ones. So, in this quarterly, I’d like to talk about some wrong decisions that investors and investment committees will be tempted to make at this time. In each case, there is both a specific mistake that we are seeing investors make currently and a more generalized type of error that serves as an example of that mistake. I’d argue that avoiding these specific mistakes now will spare investors a lot of grief and learning to avoid these classes of mistakes will serve you very well in the long term.
None of us, regardless of our skill and experience in investing, can be spared the pain caused by making mistakes. While we can all certainly learn from our mistakes, we are often still tempted to fall into the next trap, especially at times when markets seem destined to climb far beyond what reason dictates. Many of these mistakes might be avoided by exercising the discipline of simply pausing to consider the potential pitfalls of your investment decision. With contributions from my own experience and those of my GMO colleagues, I present a handful of mistakes that the current investment environment seems to invite. While clearly not an exhaustive list, perhaps you will recognize yourself in one and pause to consider how you might avoid a costly misstep.
Mistake 1: Piling into Growth and the U.S. and out of Chinese and Emerging Equities
Generalized Version: Riding Your Winners and Losing Faith in Your Losers
In 2021 we saw a continuation of patterns long since established, with the U.S. equity market far outpacing the rest of the world and large cap growth again beating large cap value in the developed world.1 China’s clamping down on its tech giants – which had provided the U.S.’s strongest competition for growth investor enthusiasm – left plenty of investors feeling as if U.S. large growth was both the lowest risk and highest return version of equities. Not surprisingly, some are explicitly rethinking their commitment to emerging markets in light of recent Chinese policy shifts (which we think is a mistake) and more are simply failing to rebalance their portfolios out of their winners and into their losers. The bias this creates is compounded by the fact that the growth exposure of many active managers has gradually crept up over the past few years as they chase performance as well.2 Rebalancing back to your previous regional targets must be the bare minimum move to make. The rising weight of the U.S. in global indices at a time when its valuation premium is the highest in decades actually argues for more active reductions in U.S. exposure than simply keeping its weight in line with that of, for example, MSCI ACWI, which currently has weights of 61%/26%/13% in the U.S., EAFE, and emerging regions, respectively. Using our estimates of fair value, those weights would be 49%/33%/18%, which is the biggest difference between market-cap-weighted and fundamentals-weighted versions of this global benchmark since the height of the Japan bubble more than 30 years ago.
Of course, to many investors, having an overweight to U.S. equities seems not merely harmless but actually risk-reducing, given that the U.S. has performed better in most downturns over the last 15 years. It is natural to feel that any market that has recently done well is less risky and those that have done poorly are riskier, but this turns out not to be the case, as we can see in Exhibit 1.
Exhibit 1: 3-Year Performance of Countries Ranked by Trailing Performance
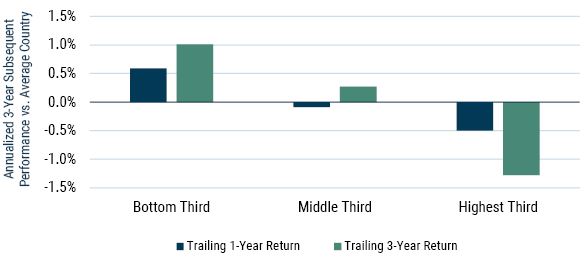
Data is from 1970 to 2021 | Source: GMO, MSCI
Data is across the U.S., U.K., Germany, France, Australia, Japan, Hong Kong, and Canada.
Whether we are looking at trailing 1- or 3-year performance, the former laggard countries wind up being the winners, and the previous high-fliers underperform. The U.S. may feel like the safer bet given its strong performance, but history suggests otherwise.
The tendency to ride winners and cut losers is also tempting within your active manager roster. It is completely natural to feel more confident in your managers who have just had a great few years and entertain doubts about those who lagged. In round numbers, no one ever fires a manager after strong performance, whereas lagging managers rightly live in fear of the axe. I discussed the impact of this on investor portfolios a few years ago,3 here illustrated in Exhibit 2, which shows the performance of managers who were fired by institutional investors in the three years prior and subsequent to being fired.
Exhibit 2: Be Ready for Periods of Underperformance
3-Year Cumulative Excess Returns
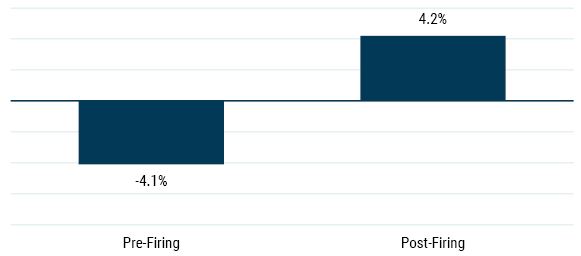
Source: Amit Goyal and Sunil Wahal, "The Selection and Termination of Investment Management Firms by Plan Sponsors," August 2008
Data reflect cumulative excess returns for investment managers terminated for performance-based reasons.
Teasing out the difference between skill, luck, and style for active managers is far more of an art than a science, but the instinct to ditch the managers who have recently disappointed has often proved painful.
And the most obvious driver of style-driven differences for managers in recent years has been the question as to whether they lean more toward value or growth. I don’t want to spend too much time on this one given that every second piece I have written in the last couple of years has been about how attractively positioned value is, but it does bear repeating that value is still very cheap relative to growth. Exhibit 3 shows the valuation of value versus growth in the U.S. as of the end of 2021; value is in the fifth percentile relative to history. If it were to go to its historic average valuation versus growth, that would entail outperforming growth by approximately 68%.4
EXHIBIT 3: VALUATION OF U.S. GROWTH VS. U.S. VALUE
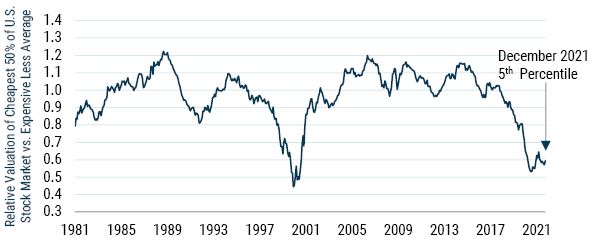
As of 12/31/2021 | Source: GMO
Composite Valuation Measure is composed of price/sales, price/gross profit, price/book, and price/economic book. Value and growth groups are both sliced over 12 months.
Things generally only get very cheap by virtue of underperforming, though. And while value managers had a somewhat better year in 2021 than they have had in a while, their trailing performance tends to pale in comparison to growth-oriented managers. Not only does that mean those growth managers will take up a bigger portion of your portfolio if you haven’t rebalanced, but it also is a very natural instinct for your confidence in your managers’ skill to follow their relative performance, so you may be tempted to fire outright some value-oriented managers, thereby enhancing a growth bias in your portfolio. That looks like an even more dangerous mistake than such a move would normally be.
Mistake 2: Piling into Private Equity and Venture Capital
Generalized Version: Trying to Copy the Portfolios of Recently Successful Institutions
Of course it makes sense to try to learn from successful investors, and a number of endowments have reported eye-popping returns from their private equity investments over the past year. But piling into the assets that made "the smart money" the most presents two kinds of problems. First, the institutions that did best after the fact are generally those that had the largest allocations to the markets that happened to do best. As we saw in analyzing Mistake 1, leaning into those historically strong-performing markets is likelier than not to be a mistake. But beyond that problem there is a deeper one. It is one thing to see that MIT made 55% in fiscal 2021 and had 43% of its endowment in private equity.5 It is another to have the resources and access to be able to build a portfolio equivalent to MIT’s. Particularly in the case of private equity, many investors are focused on putting money to work to capture a presumed "illiquidity premium," whereas the more experienced players understand that strong returns are only likely to come from the best managers and that there is really no such thing as generic exposure to "private equity" in the first place.6 Beyond that, allocations to illiquid assets require changes to the way you manage the rest of your portfolio. An allocation that might seem perfectly manageable when markets are flying can turn into a millstone around your neck if markets should fall back to Earth while the required capital calls continue to come in.
Private equity can be reasonably thought of as a levered version of active equity management. This is arguably less true in venture capital, where the companies involved are too immature to be listed in the equity market. But for "LBO-type" private equity, which is where the largest amounts of capital are deployed, both the entry and exit points for most investments are the public equity markets. This doesn’t mean that private equity managers cannot deliver superior returns, but it does mean that they are not doing so by earning any so-called "illiquidity premium," since the illiquidity is self-imposed. Superior private equity managers do not earn an illiquidity premium, but rather generate alpha through exploiting inefficiencies in the public financial markets.7 For the best managers, that alpha can more than cover their high fees as well as the substantial costs involved in this type of investing, but the fees and costs do not drop meaningfully as one goes from the top quartile managers to the bottom quartile managers.8 Those investing in this space, particularly at a time like today when valuations are frothy and capital is abundant, need to be confident that they have both the skills to find better managers and that those superior managers – who are having no trouble raising capital and largely get to choose their LPs – are interested in having them as clients. MIT has an experienced investment team with proven manager selection skills and a reputation that makes them a sought-after LP. For investors who cannot say both of those things, their portfolios would be well served by reflecting that difference.
Mistake 3: Assuming that Assets that Made it through the Pandemic Well Carry Low Fundamental Risk
Generalized Version: Excessive Faith in the Results of the Last War
While I like to think that people have enough understanding of the unique nature of the Covid event not to assume it is the template for future market falls, I still hear people talk about growth stocks being inherently more protective in an economic downturn while pointing to 2020 as evidence for this. Though that particular argument seems hard to take too seriously, I have a lot of sympathy for investors who fall into this basic trap because it is one I’ve fallen into myself. After our value-driven asset allocation process managed to avoid losses in the internet bust and substantially cushion losses in the Global Financial Crisis,9 I fell into the trap of believing that cheaper assets would reliably prove less risky in market downturns. This certainly proved not to be the case in the pandemic, where cheaper assets not only fell more on the way down but also rose less fast in the recovery. But the basic issue is a broader one than what happened in a particular market downturn. There is no single definition of "risk" that one can rely on to tell you how an asset will do in a bear market. An asset might be reasonably resilient to losses driven by economic weakness but very vulnerable to losses from a liquidity shock. My team tends to look at risk on three basic axes – depression risk, inflation risk, and liquidity risk – and there are no assets proof against them all. But it is not merely the fact that bear markets can be driven by different underlying economic causes that creates trouble for believing your portfolio is proof against them. The characteristics of a particular asset will also change depending on factors such as its current pricing. As an example, U.S. Treasuries were wonderfully protective in the Covid bear market of February to March 2020. That’s not a particular shock given that high quality government bonds usually provide windfall gains in sharp downturns. But what is also notable is that other high quality government bonds that had been strongly protective in prior equity bear markets were nowhere near as helpful. Exhibit 4 shows the return of various G10 government bonds in the Covid bear market against starting short rates in each market.
Exhibit 4: COVID Crisis Bond Returns and Starting Short Rates
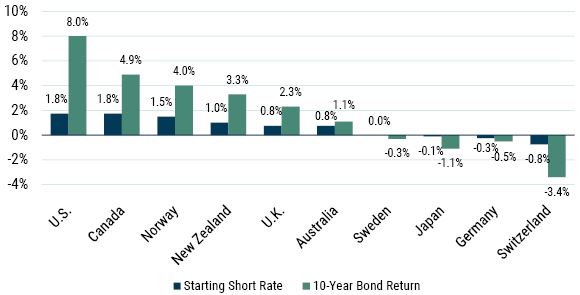
Source: DataStream, GMO
Short rates are levels as of 1/31/2020 and bond returns are the returns from 2/19/2020 to 3/23/2020.
U.S. Treasuries were far and away the best performers in the period, but what seems particularly striking to me is that the average bond return in markets where the short rate came into the period zero or below was actually negative. Government bonds have historically been good performers in bad economic times, but a crucial driver for those results has been the fact that central banks were able to reduce interest rates in the face of the downturn. When the starting level of interest rates made that impossible (or at least inadvisable) in much of Europe and Japan, the previously reliable defensiveness of those government bonds disappeared.
There is another argument I’m hearing today that makes a similar type of error, although it sounds a little different. This one is not so much about the performance of a particular asset or strategy as it is a point about the actual "riskiness" of risk assets. This premise argues that because central banks will ride to the rescue whenever financial markets are floundering, risk assets are not actually all that risky. However sharp the bear market, the likelihood of lasting losses is far lower than history would suggest, and long-term investors can afford to be more or less entirely invested in equities and other similarly risky assets. Conceptually this is exactly the kind of thinking that Hyman Minsky warned about – if this argument is believed it will encourage a build-up of risk that ensures that the argument will eventually fail, probably spectacularly so. But more specifically, it wouldn’t actually take everyone moving to 100% equities for this to prove disastrous thinking. All it takes is a situation where central banks have more pressing problems to worry about than what is going on in the stock market. Obviously, in a situation where inflation is stubbornly high, central banks may not be able to ease conditions even if financial markets fall. But even in the absence of an inflation problem, central bankers can only afford to ride to the rescue of financial markets when conditions in the real economy are at least as weak as they are in the financial economy. In the long bull run of the last 40 years that has almost always been the case. In a situation where the real economy is in good shape despite financial markets having troubles, the central bank might well have to leave the financial markets to their own devices and losses could take a very long time to reverse themselves.10
Mistake 4: Using an Unrealistically High Expected Return for Your Portfolio
Generalized Version: Failing to Understand the Implications of the Historical Sources of Asset Returns
This is a warning I have been giving for years now, and it’s one of those situations where the fact that I have been wrong in the shorter term makes me all the more likely to be correct in the long term, even if my ability to convince people has almost certainly deteriorated. But after yet another year of strong returns from traditional portfolios, investors really need to look at their long-term assumptions with an eye to reducing them. Actually, whether 2021 was a better than average or worse than average year depends on how you measure it. A 60/40 MSCI ACWI/Bloomberg Aggregate portfolio earned a return of about 10.2%. That is well above the 7.5% average over the last 20 years, but it was only 3.2% after inflation, and that is lower than the longer-term average. But 2019 and 2020 were very strong for the traditional portfolio as well and the three-year annualized return for 60/40 has been 14.3% annualized, or close to 11% real. Such strong returns make it tempting to assume that future returns to the portfolio must be higher than earlier assumptions.
But the primary driver of those strong returns has been rising valuations. On forecast P/Es, ACWI is about 45% more expensive than it was at the end of 2018,11 and the yield on the U.S. 10-year is 43% lower. It does not require any belief in reversion to the mean to understand that those higher valuations imply lower long-term returns. While it may be tempting to want to ignore the warnings of anyone who has been arguing in this direction for a while (i.e., me), the fact that valuations have continued to rise and returns therefore continued to be strong does not change the fact that all else equal, rising valuations necessarily imply falling future expected returns.
The math of bonds is simple enough that few actually believe returns will be anything like historical levels from here, but there seems to be lots of fantastical thinking with regard to more complex assets such as equities. But history is clear. There is no reason to believe the long-term return to equities will be any higher than the normalized earnings yield of equities. Exhibit 5 shows this in the case of the S&P 500.
Exhibit 5: Fundamental Return to S&P 500 against Earnings Yield Proxy
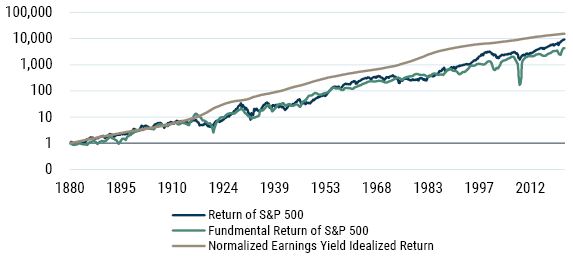
As of 12/31/2021 | Source: Robert Shiller, GMO
The gray line on the chart shows the return investors would have achieved had the real return to the S&P 500 each year been its Shiller earnings yield. The blue line shows the actual real return of the S&P 500, and the green line shows the "fundamental return" of the S&P 500 – the return that came from dividends and real earnings growth. Neither the green nor the blue line have kept up with the gray, and this is true across almost every equity index we have decent data for. Therefore, taking the normalized earnings yield as an upper limit for sustainable equity returns is probably the fairest assumption.12
Investors in the S&P 500 have benefitted historically from rising valuations – the stock market trades at a much higher P/E today than it did a century ago, or even a decade ago. But even assuming that today’s P/Es are sustainable, rising valuations cannot be a sustainable source of returns. The sustainable source of returns is the income and earnings growth that investors receive, and those sources will deliver less when prices are high relative to earnings. That is a particularly sobering fact to realize today, as the normalized earnings yields are near their lows – 2.5% for the S&P, about 4% for the international developed markets, and a more encouraging 5.8% for emerging markets. Given current regional weights in global stock market indices, that makes for a disquieting 3.3% weighted average. If we generously considered the equivalent expected real return to be 0% real for bonds,13 the expectation for a 60/40 portfolio comes out at a disheartening 2%, which only rises to 2.5% for a more aggressive 75/25 equity/bond split. Even if you wanted to assume that today’s record profits across most of the world are "normal" and earnings yields correspondingly higher than the normalized versions, those sustainable real returns would only increase to 2.6% for 60/40 and 3.2% for a 75/25 split. All of that is a far cry from the 5% real return assumption most investors use as a rule of thumb and are counting on in their investment and spending decisions. We believe this dismal situation can be improved by biasing your equity book away from the U.S. and your non-equity book toward liquid alternatives rather than long-term bonds, but making a big difference in expected returns requires a willingness to look very different than the traditional portfolio, and that is very hard for most investors. Achieving 5% real or even close to that in the coming 10 to 20 years is going to require either a large dose of alpha or a severe bear market in the near future that allows for much lower average valuations for stocks and bonds over the long run.14
Conclusion
This is by no means an exhaustive list of the mistakes investors will be tempted to make this year. When I sent out a request to colleagues at GMO for suggestions of mistakes they saw investors making or contemplating, I got a list far too long to do justice to in a single letter. Some of them were inspired by moves that GMOers had seen investors make recently, but some seemed to be inspired by mistakes that they themselves have made over the years. None of us are immune to making investment mistakes, and investing does seem to be an area where there are lessons that usually cannot be taught, only painfully learned on one’s own. I don’t imagine that this piece will change that basic truth, but as you find yourself making decisions about your portfolio to position for 2022 and beyond, at least spend a moment to ask yourself whether you are falling into one of these classes of investment mistakes. No matter how fast markets are moving, taking a little time before pulling the trigger on a decision to try to ensure it is a well-reasoned one is unlikely to be a mistake.
Download article here.