Key Takeaways
- Dangerous temperatures, intense wildfires, devastating storms, and severe flooding have become common, and the damage caused is costing hundreds of billions of dollars per year. 1
- This new reality heightens transition risks for companies and investors and underlines the criticality of incorporating a total emissions perspective.
- When assessing risk, most investors focus too narrowly on scope 1 and scope 2 emissions, which offer a limited view of exposure.
- By looking beyond scope 1 and scope 2, GMO’s Indirect Emissions Model provides investors with insights that can alter the basis of key decisions ranging from portfolio construction to engagement priorities in a more targeted, impactful way.
Introduction
Many investors aim to mitigate the impact of systemic climate risk through their portfolio decisions and by supporting global efforts to decarbonize. However, most focus too narrowly on scope 1 and scope 2 emissions when assessing emissions risk. As a result, they may overlook companies with significant emissions risks from upstream or downstream sources that, in aggregate, may even surpass those of companies within high-emission sectors. It is therefore imperative for investors to evaluate the total emissions footprint to effectively manage transition risks. 2
EXHIBIT 1: Total emissions reveals a different rank order for high-emitting sectors
MSCI ACWI IMI Carbon Footprint by Sector (tCO2e/$mm MCap)
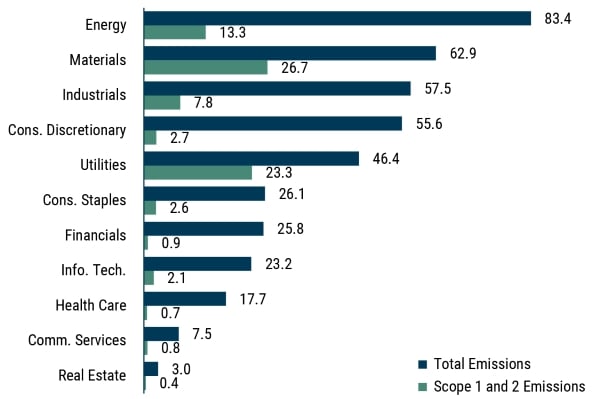
As of 3/31/2025 | Source: GMO, S&P Trucost Limited © Trucost (2023), MSCI
MSCI data may not be reproduced or used for any other purpose. MSCI provides no warranties, has not prepared or approved this report, and has no liability hereunder. S&P does not guarantee the accuracy, adequacy, completeness or availability of any data or information and is not responsible for any errors or omissions from the use of such data or information. Reproduction of the data or information in any form is prohibited except with the prior written permission of S&P or its third-party licensors. Please visit https://www.gmo.com/americas/benchmark-disclaimers/ to review the complete benchmark disclaimer notice.
Comparing sector carbon footprints using scope 1 and 2 emissions relative to total emissions, we observe that sector rankings differ based on the emissions measure used. For instance, Exhibit 1 shows that for a broad market index such as the MSCI All Country World Investable Market Index (MSCI ACWI IMI), the sectors that contribute the most to the scope 1 and 2 carbon footprint (green bars) are Materials and Utilities.
When total emissions (blue bars) are factored in, Energy becomes the largest contributor by far. Other sectors also see dramatic changes. For example, Consumer Discretionary and Consumer Staples, which were among the lowest scope 1 and 2 emissions intensity sectors, emerge as the fourth and sixth highest contributors to the index’s total emissions exposure.
Insights from a Comprehensive View of Total Emissions
As the global community advances toward a net-zero economy , asset owners and their beneficiaries are increasingly confronted with transition risks within their investment portfolios. Amid the current geopolitical and macroeconomic landscape shifts, it is even more important to understand total emissions exposure and how decarbonization efforts are impacted.
These risks are particularly pronounced in high-emission sectors, which face multiple channels of exposure:
- Increased costs: Policy decisions around the globe can disrupt economies and markets with magnitude and speed. Carbon policies that impose taxes or restrictions on emissions can significantly elevate operational costs.
- Reduced demand: Customer substitution driven by new and improved technologies, reputational concerns, and shifting preferences can diminish demand.
- Litigation and legal actions: Companies may incur substantial losses from legal proceedings related to their emissions.
- Higher cost of capital: Concerns regarding the impact of the above-noted risks on the ability to estimate future cash flows can result in the application of higher risk premia.
It is crucial to recognize that approximately 80% of a company's total emissions footprint represent indirect emissions from its suppliers or customers. Neglecting these indirect emissions means overlooking a substantial portion of the associated risks.
DEFINING TOTAL EMISSIONSWhen evaluating emissions, most asset owners and investors look to a company’s own activities (scope 1 emissions) and purchased power (scope 2 emissions) because they are easier to measure and increasingly available. But approximately 80% of a company's total emissions footprint represents indirect emissions from a company’s suppliers or customers. Reported scope 3 data attempts to capture indirect emissions, but low data quality and reporting inconsistencies make the data unreliable. For a complete picture, one must assess end-to-end company value chains, including both upstream and downstream activities. THE GMO INDIRECT EMISSIONS MODELThe GMO Indirect Emissions Model is designed to address the inadequacies of scope 3 data and allow for fair comparisons across portfolio holdings. Unlike other models that rely heavily on sector averages and top-down assumptions, GMO’s proprietary model integrates company-specific supply chain data, segment-level revenue, and scope 1 emissions into a global input-output framework. This allows for a consistent, transparent, and scalable estimation of indirect emissions across upstream suppliers and downstream customers. For more details, see Estimating Value Chain Emissions for Portfolio Construction: The GMO Indirect Emissions Model. |
Insight #1: Improving Portfolio Construction
Investors aim to mitigate emissions risk by reducing exposure to high-emission companies in favor of lower-emission counterparts within the same sector. Currently most investors focus on the scope 1 and 2 emissions of portfolio companies, in part due to the challenges associated with scope 3 reporting. However, differences between scope 1 and 2 emissions and total emissions have significant implications for portfolio construction.
Investors aiming to reduce their portfolio carbon footprint while maintaining sector neutrality tend to underweight high-intensity companies within each sector. The chart on the left of Exhibit 2 illustrates company-reported scope 1 and 2 emissions intensity for four semiconductor companies: Samsung Electronics, Taiwan Semiconductor, Intel, and Qualcomm. To account for differences in scale, emissions data is normalized by company revenues to better align with production footprints. In this scenario, investors would likely reduce exposure to Taiwan Semiconductor, whose scope 1 and 2 emissions intensity is 75% higher than Samsung, the next highest.
However, when total emissions are considered, a different picture emerges. The chart on the right of Exhibit 2 shows the total emissions intensity of the same companies but also includes company-reported scope 1 emissions plus upstream and downstream GMO Indirect Emissions. Taiwan Semiconductor has the lowest total emissions intensity of the group. Samsung, Intel, and Qualcomm, despite having different scope 1 and scope 2 intensities, have similar levels of total emissions intensities.
EXHIBIT 2: Total Emissions enables apples-to-apples comparisons of companies
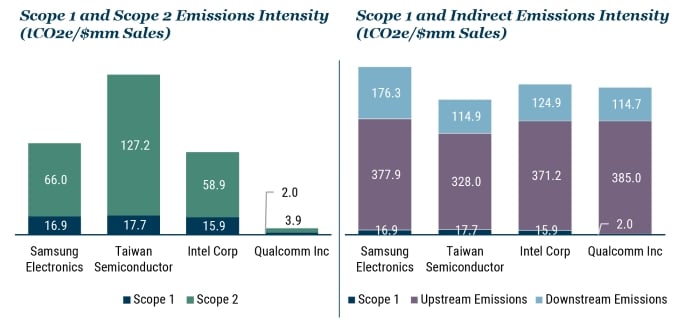
As of 3/31/2025 | Source: GMO, S&P Trucost Limited © Trucost (2025)
Including reported scope 3 emissions in portfolio construction has proved insufficient in capturing total emissions. In similar analyses comparing reported downstream emissions to estimates generated by the GMO Indirect Emissions model, we continue to see changes in how companies rank and, importantly, the reported emissions can be an order of magnitude smaller than our emissions approximation. This highlights that operationally similar companies may have very different emissions because of the reporting flexibility provided in current emissions accounting practices, 3 not because of differences in emissions efficiency.
Insight #2: Engaging Where It Counts
Total emissions data can also focus engagements better. Prioritizing corporate and sector engagement efforts toward areas that have the most impact on total emissions can be a meaningful shift for investors seeking to contribute to carbon reduction efforts through stewardship. Specifically, engaging on value chain emissions can accelerate decarbonization efforts given the depth and breadth of supply chains.
For example, the Industrials sector is the largest contributor to MSCI ACWI IMI’s total carbon footprint. Exhibit 3 provides a simplified way of summarizing MSCI ACWI IMI’s upstream emissions sources by sector. For example, the Industrials sector gets 8% of its upstream emissions from other companies in the same sector. Most of its supply chain emissions come from companies in the Utilities, Materials, and Energy sectors. We believe it is especially important to emphasize the energy exposure of Industrials as even a fossil-free portfolio will harbor significant energy exposure through upstream emissions, highlighting the need for supply chain-oriented engagement.
EXHIBIT 3: UTILITIES, MATERIALS AND ENERGY ARE SIGNIFICANT SOURCES OF UPSTREAM EMISSIONS
MSCI ACWI IMI Upstream Emissions Sources by Sector (% of total upstream emissions)
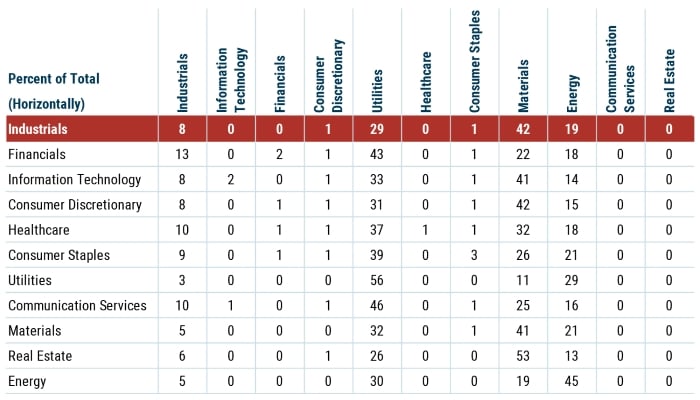
As of 3/31/2025 | Source: GMO, S&P Trucost Limited © Trucost (2025), MSCI
When conducted across all portfolio sectors, this analysis helps companies and investors understand where to focus their attention when evaluating supply chain risk.
Another way to promote decarbonization is to encourage companies to shift to lower emission suppliers. The GMO Indirect Emissions model allows you to identify the sectors that have the highest upstream emissions, meaning that inputs into their production process have high emissions.
Exhibit 4 shows the upstream weighted average carbon intensity (WACI) to identify the MSCI ACWI IMI sectors that are most emissions inefficient. Energy, Materials, Industrials, and Consumer Discretionary emerge as the sectors that would have the most impact on other companies’ total emissions. Focusing company engagements on these four sectors increases the potential impact on a portfolio’s total carbon footprint.
EXHIBIT 4 : ENGAGE WITH LARGEST UPSTREAM EMITTERS FOR GREATER IMPACT
MSCI ACWI IMI Sectors, Weighted Average Carbon Intensity (tCO2e/$mm Sales)
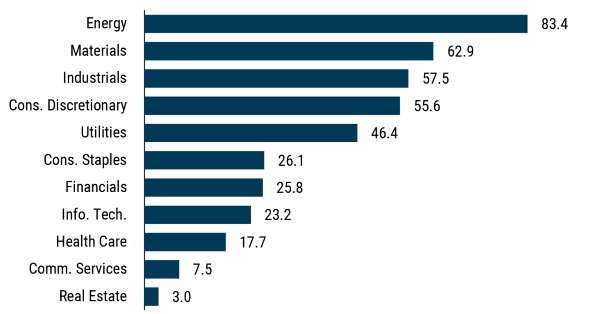
As of 3/31/2025 | Source: GMO, S&P Trucost Limited © Trucost (2023), MSCI
Conclusion
The importance of adopting a total emissions approach in portfolio construction and management cannot be overstated. As the world continues to grapple with the severe impacts of climate change, it is imperative for investors to consider not only direct emissions but also the indirect emissions embedded in value chains. The GMO Indirect Emissions Model provides a robust framework for assessing these emissions, offering a more comprehensive view of a company's carbon footprint relevant for both portfolio construction and corporate engagement.
The total emissions approach, supported by the GMO Indirect Emissions Model, provides investors with the necessary tools to make informed decisions that align with global decarbonization goals. By prioritizing both direct and indirect emissions, investors can better manage risks, drive meaningful engagement, and contribute to a sustainable future.
Download article here.
The Potsdam Institute for Climate Impact Research estimated that damage due to climate change is expected to amount to US$38 trillion per year until 2050. This is about six times larger than the costs of climate change mitigation. See "38 Trillion Dollars in Damages Each Year: World Economy Already Committed to Income Reduction of 19% Due to Climate Change," (PIK 2024).
For more information about the importance of considering total emissions, see “Greenhouse Gas Emissions Disclosure Requirements Applying IFRS S2 Climate‑related Disclosures,” (IFRS 2025).
Disclosure: The views expressed are the views of Chris Heelan, Michelle Morphew, Deborah Ng, Miekela Singh, George Sakoulis through the period ending June 10, 2025, and are subject to change at any time based on market and other conditions. This is not an offer or solicitation for the purchase or sale of any security and should not be construed as such. References to specific securities and issuers are for illustrative purposes only and are not intended to be, and should not be interpreted as, recommendations to purchase or sell such securities.
Copyright © 2025 by GMO LLC. All rights reserved.
The Potsdam Institute for Climate Impact Research estimated that damage due to climate change is expected to amount to US$38 trillion per year until 2050. This is about six times larger than the costs of climate change mitigation. See "38 Trillion Dollars in Damages Each Year: World Economy Already Committed to Income Reduction of 19% Due to Climate Change," (PIK 2024).
For more information about the importance of considering total emissions, see “Greenhouse Gas Emissions Disclosure Requirements Applying IFRS S2 Climate‑related Disclosures,” (IFRS 2025).