Key Takeaways
- Recently, AI-related stocks have been driving market sentiment.
- A key component is the surge in investment spending associated with the AI revolution.
- Counterintuitively, historical booms in corporate investment have been associated with recessions and lower equity returns.
- In a market that is already extremely overvalued, this points to another reason to question the sustainability of the bull market.
The AI Capex Boom
We have seen the boom in the U.S. market, and even globally, driven by the boom in AI-related securities. The average person can now tell you all about ‘Hyperscalers’, the latest addition to the cultural lexicon. The share prices of these firms have accelerated, and with this, markets have gone from strength to strength. A big part of the story that has inspired the market is the boom in CAPEX spending that the Hyperscalers (and others) have promised. Shown below is how some of the top Hyperscalers are predicted to increase their CAPEX spending over the next few years.
Exhibit 1: Forecast Capex Growth
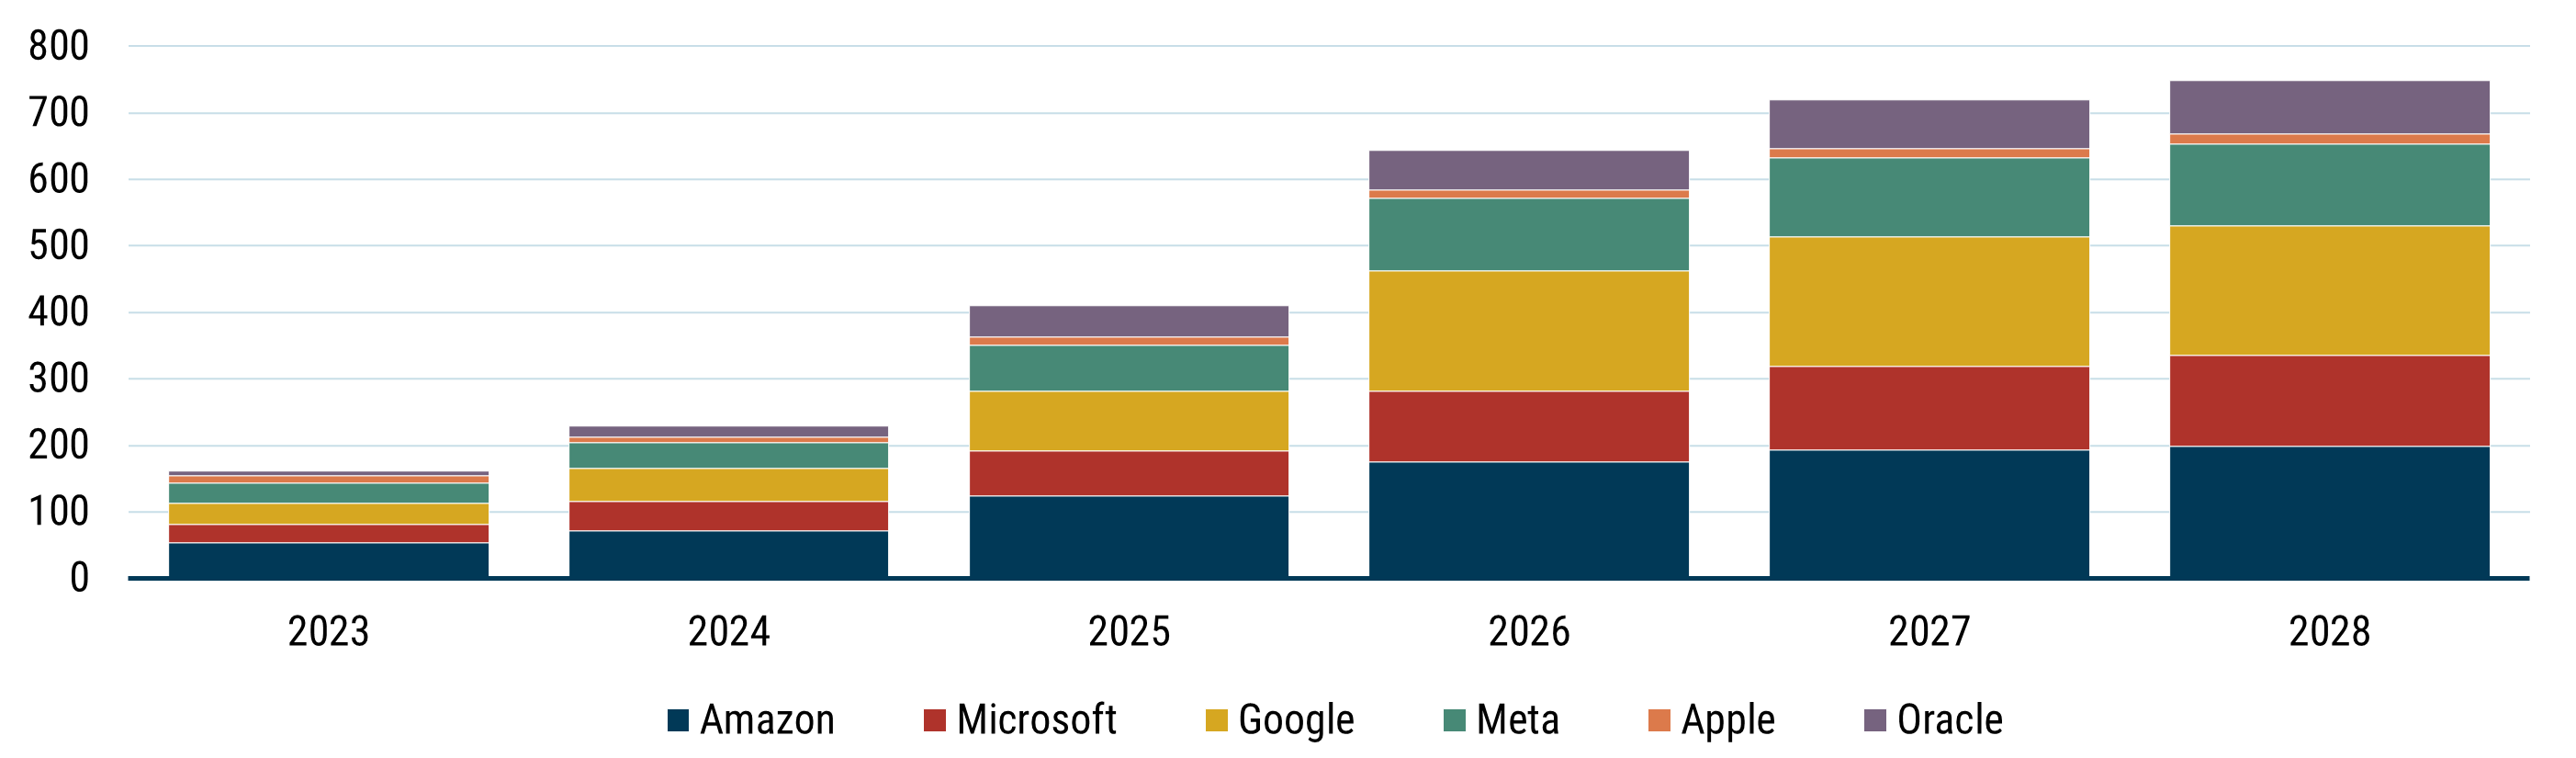
Data as of February 2026 | Source: GMO, FactSet
As we can see, this is predicted to provide some huge outlays for these firms, who collectively constitute about a quarter of the S&P’s market capitalisation. But we have also seen several aspects of the market question some of these outlays. Do booms in CAPEX generally foretell wise investments, or do they tend to warn of over-optimism? If we take a reflective look at history, what do booms in the CAPEX, and more broadly, corporate investment in general, mean for future market returns?
Delving Deeper - What History Suggests About Investment Booms
This question was examined by two academics, Salman Arif (Indiana University) and Charles M.C. Lee (Stanford University), in "Aggregate Investment and Investor Sentiment" (Review of Financial Studies, 2011). Rather than looking solely at CAPEX, the authors used a measure of corporate investment (CORPORATE INVESTMENT in our charts and later in this paper). We summarize the construction in the Appendix, but in summary, it is the Change in Net Operating Assets + R&D, over the Average Total assets + Non-Amortised R&D. This measure gives a broader definition of economic investment than just CAPEX, as investment can also be done through other means, such as R&D and inventory expansion (see Appendix for details).
The authors aggregate this measure for the broad U.S. equity market, then see how this forecasts futures equity returns. They found that higher corporate investment is associated with lower stock returns. What’s more, periods of higher investment also seem to occur just before economic recessions. Clearly, this is extremely topical for today. AI technologies are being implemented at unprecedented speed, with massive scale infrastructure construction to match.
The ideas in their paper aren’t new to the world of finance. Even back in the early 90s, economists were theorising about ideas such as the notion that when capital expenditure decreases with the cost of capital, investment should negatively predict stock returns (Cochrane, 1991). We have witnessed this pattern recur across recessions ever since.
Now, we wanted to test if Arif and Lee’s conclusions are still relevant and adaptable to the current economic climate by replicating and updating their methodology. We examined the level of corporate investment for all non-financial companies in the S&P 500 since 1985, then looked at the subsequent quarterly returns to the market. Using Arif and Lee’s measure of investment trends to the aggregated market, we, too, note a strong negative relationship between corporate investment and future equity returns. We can see this in the chart below (we have shown subsequent yearly returns for ease of observation).
Exhibit 2: S&P 500, Corporate Investment Level vs. Future Market Return
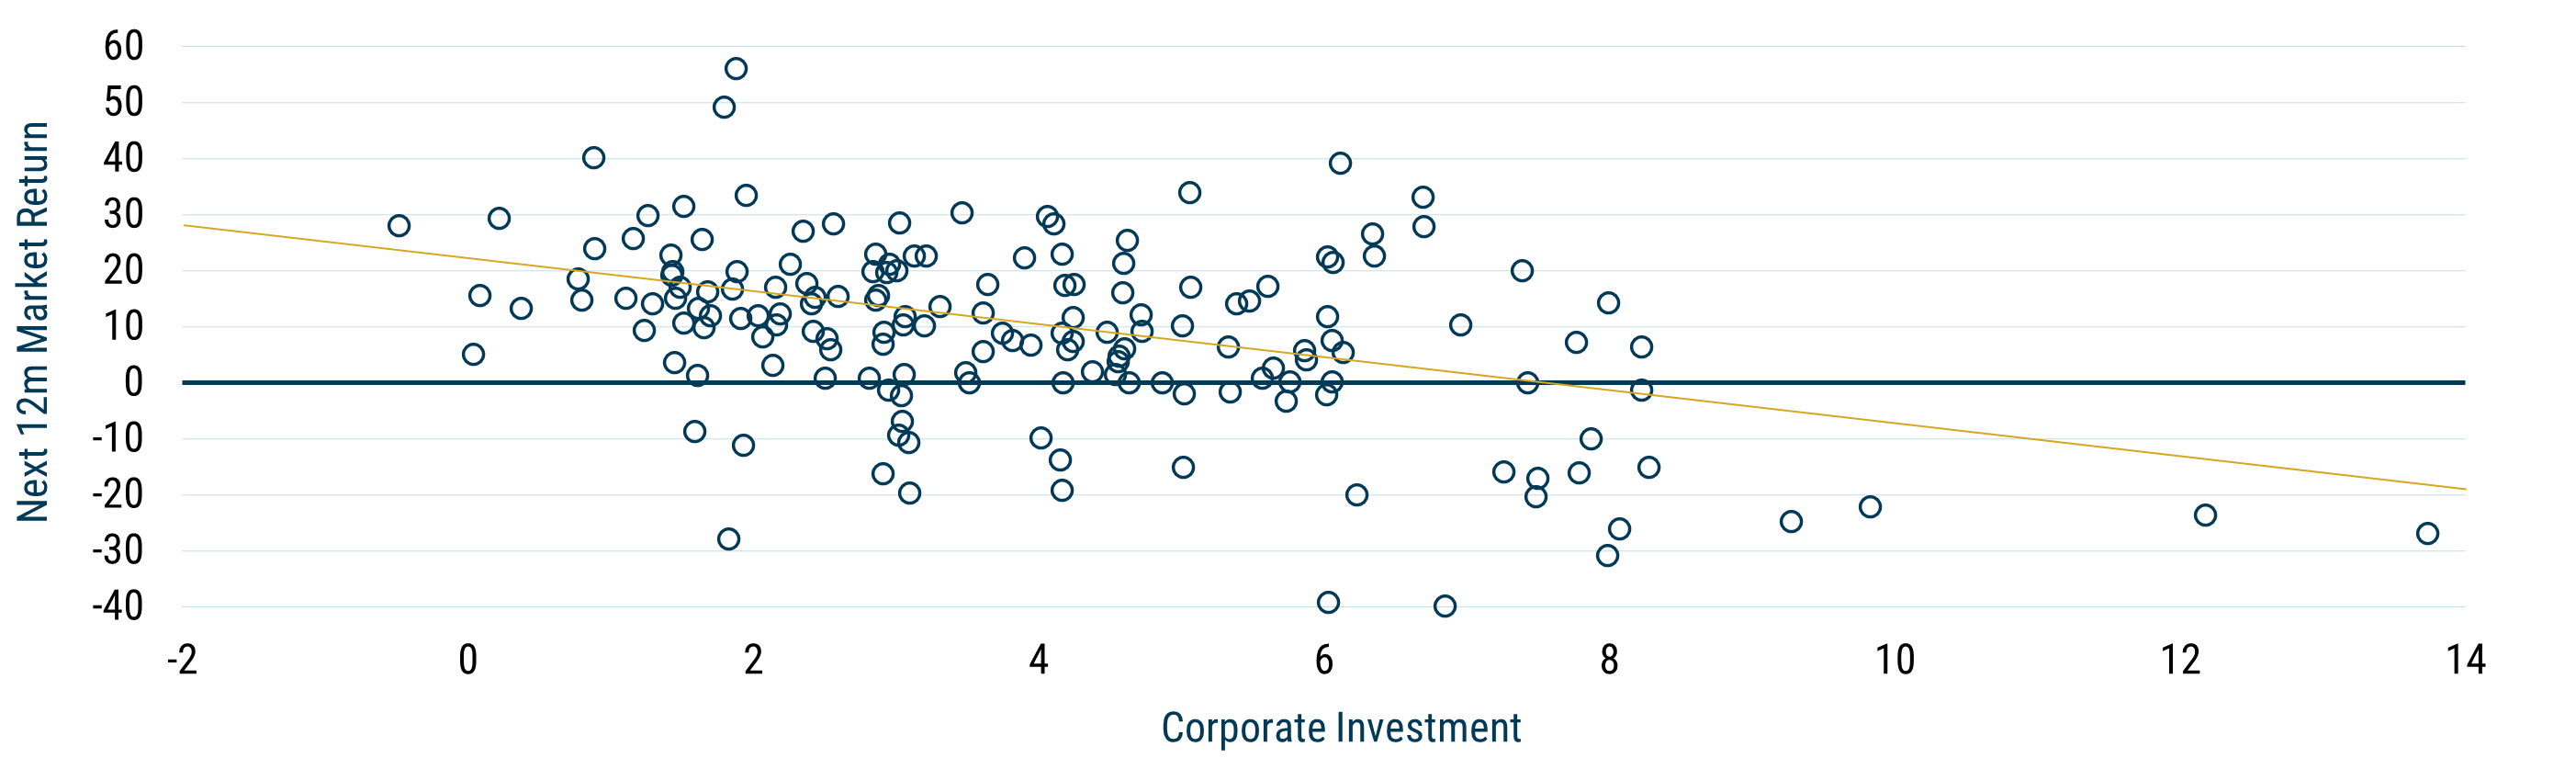
Data as of February 2026 | Source: GMO, Worldscope
Arif and Lee also looked at several global markets and found similar results, which we confirmed by evaluating data from a variety of other international markets. We also looked at all MSCI Developed countries. We found that in 20 of 23 markets (excluding Japan, New Zealand, and the Netherlands), there was a negative relationship between corporate investment and future equity returns. This again seems to confirm that high corporate investment spending is more a point of caution for equity returns, rather than a point of confidence.
Investment, Sentiment, and the Business Cycle Offer Clues as to Why
One of Arif and Lee’s key observations is that corporate investment is closely tied to business cycles. Shown below, we can see how investment peaks do, in fact, appear to coincide with recessions. What’s more, it appears that corporate investments have been on a steady rise since the GFC.
Exhibit 3: USA Investment with Recessions
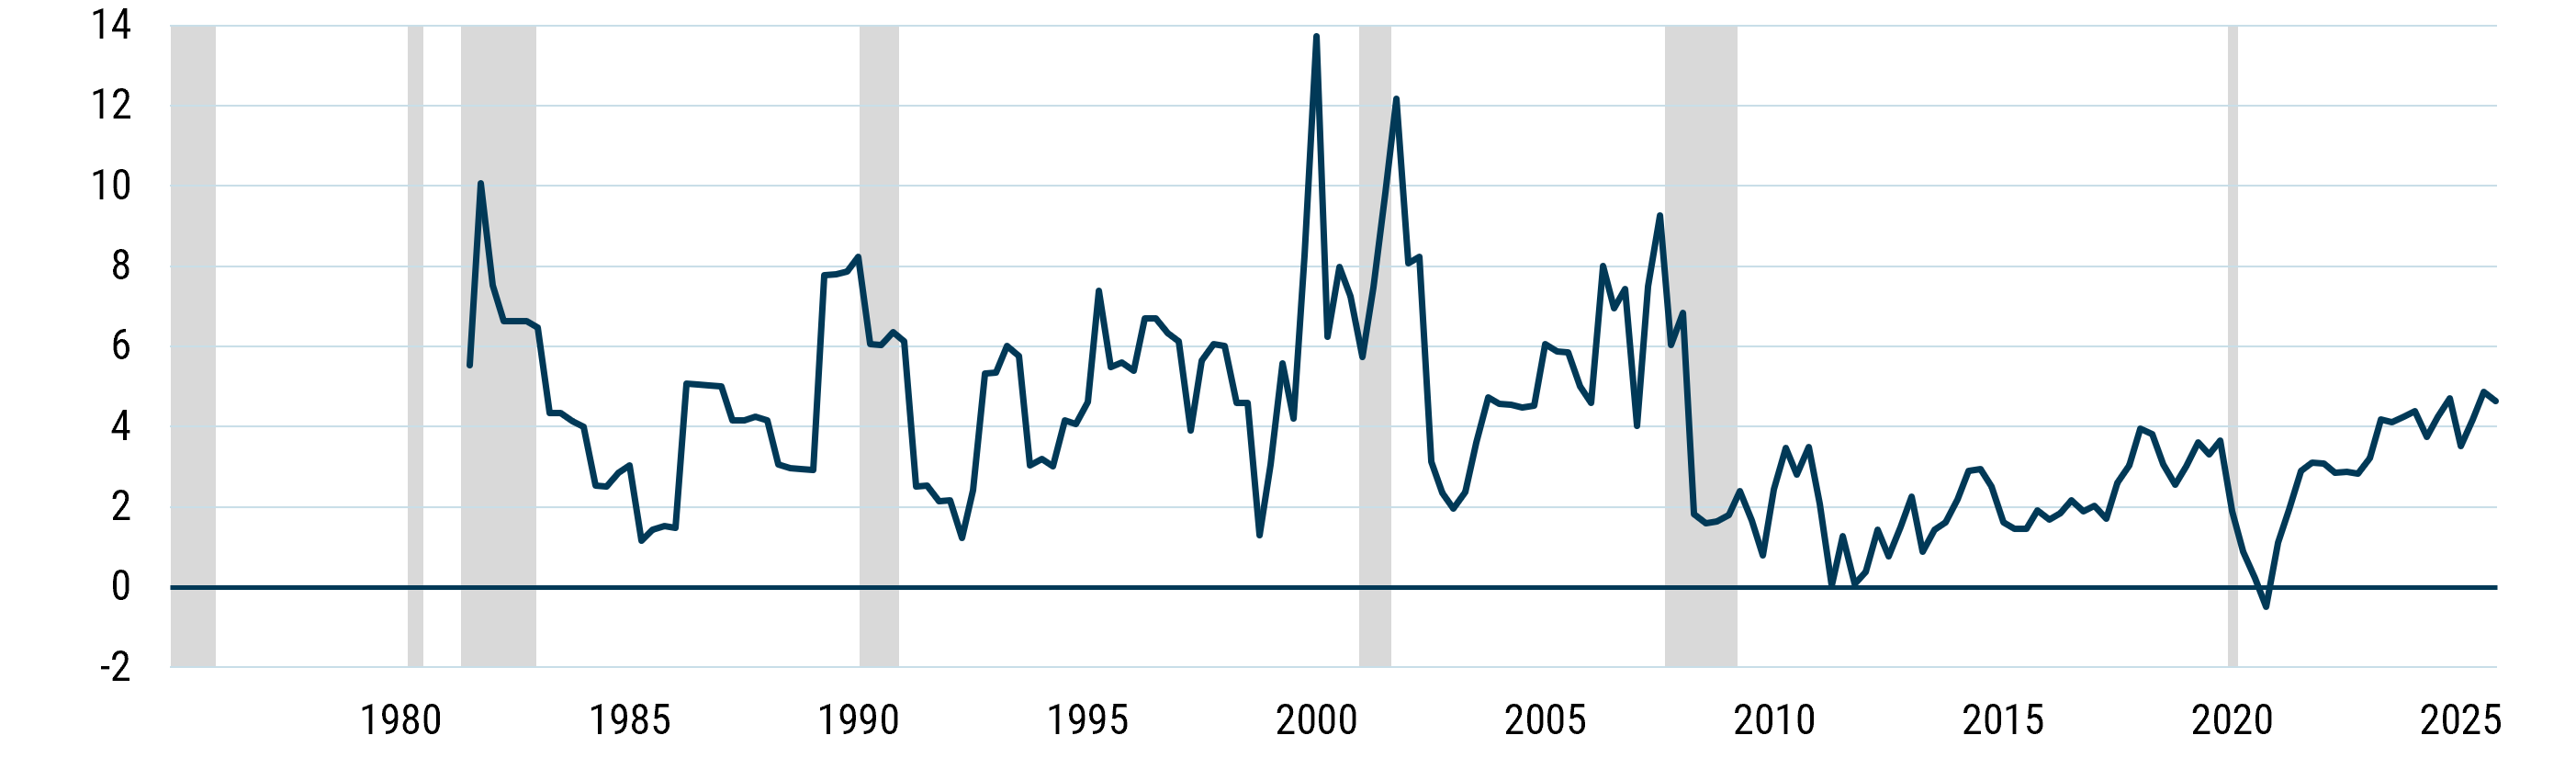
Data as of February 2026 | Source: GMO, Worldscope
Other academic authors can give us insight into why these investment patterns precede lower equity returns. One reason could be corporate managers' overconfidence. Studies like Jiang et al. (2019) directly measure corporate confidence by analyzing managers’ textual tone in financial disclosures. They find that when measured in the aggregate, a positive textual tone - demonstrated through a CEO’s quarterly address, for example - is a strong negative predictor of future total market returns. In other words, higher manager confidence precedes greater investment growth and lower earnings surprises, in aggregate. As managers become overly optimistic about future growth, this leads to overinvestment and, therefore, lower equity returns.
The paper from Jiang et al. (2019) also highlights an interesting observation. While we don’t wish to drill down into the analysis of earnings call sentiment and its impact on broader markets (that is a deeper issue worthy of a separate paper), we note that the most recent earnings calls from the main Hyperscalers have been extremely positive. For all the Hyperscalers (except Oracle), the most recent calls have been significantly more positive than their average over the previous 4 quarters.
Exhibit 4: Latest Earnings Call Sentiment vs. Previous 4 Quarters
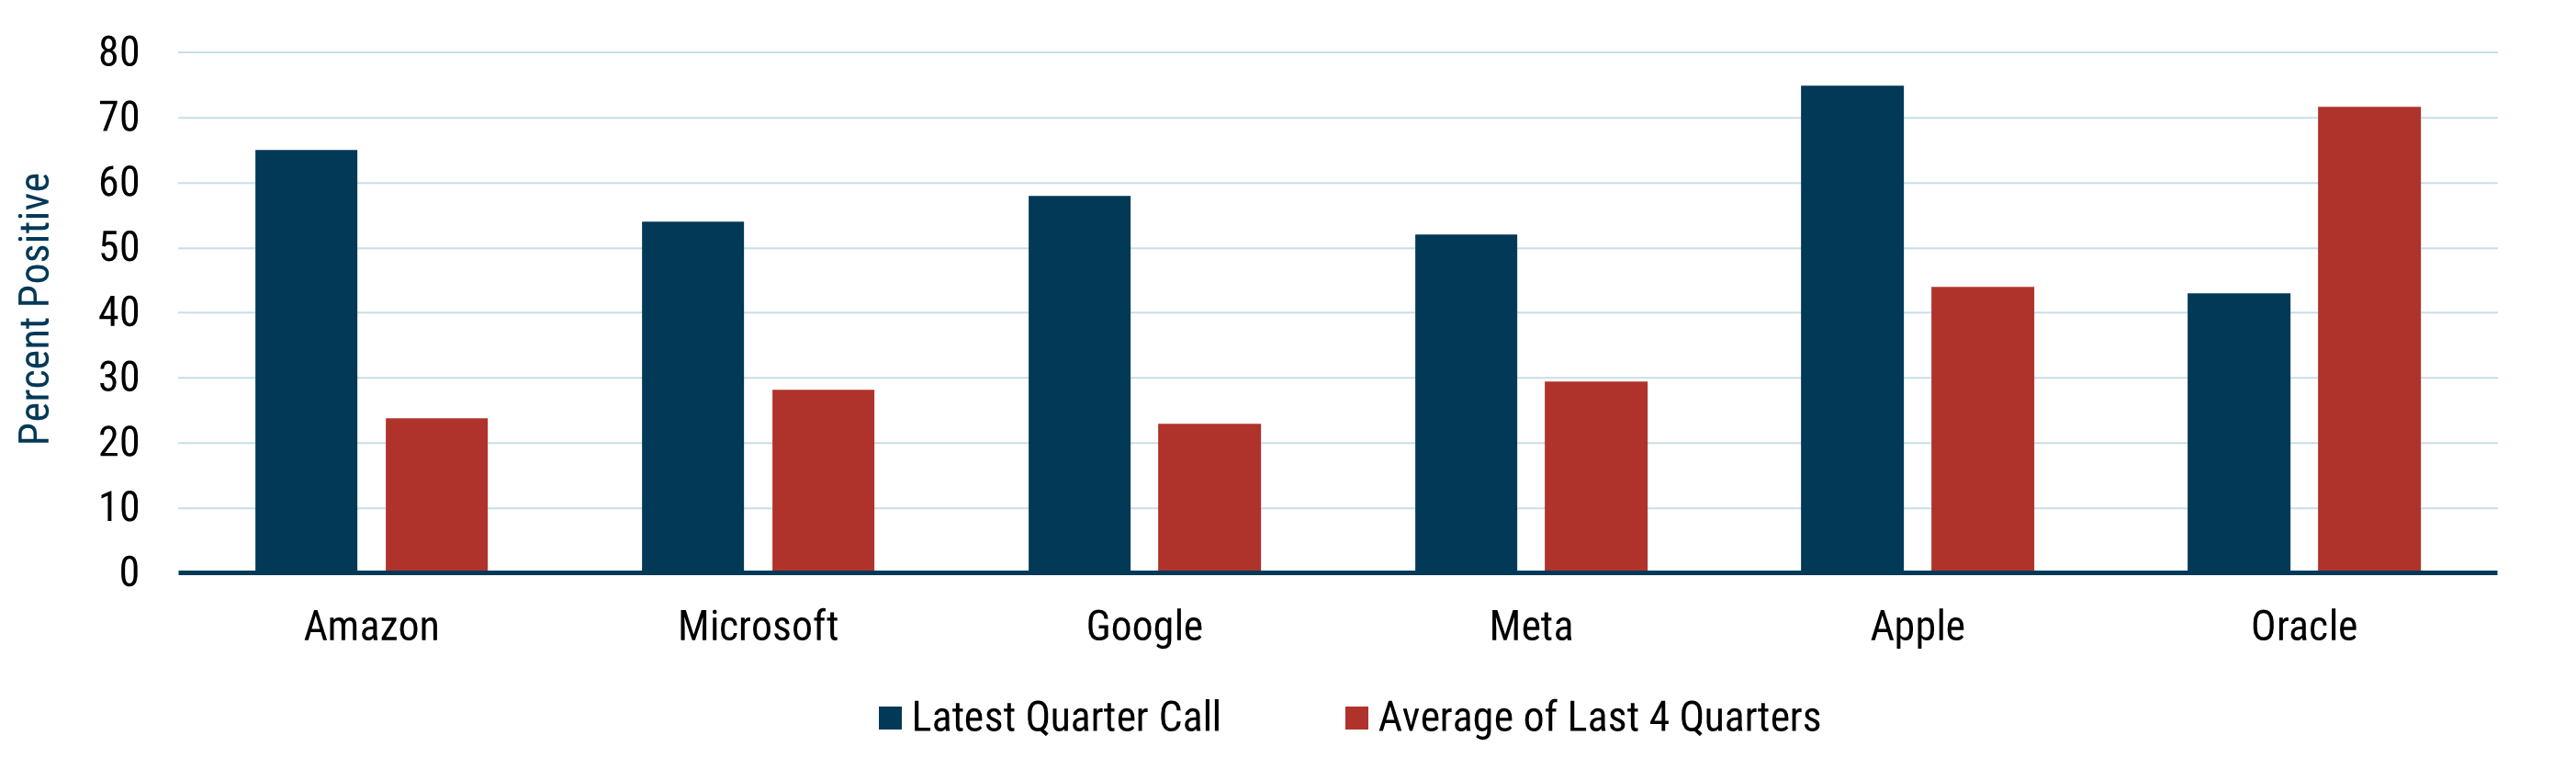
Data as of February 2026 | Source: GMO, FactSet, Alexandria
Why Might This Time Be Different?
While the historical evidence of the impact of the investment boom is strong, observers have put forward several arguments for why this time might be different. Some analysts have argued that the boom in AI spending isn’t about growth but more of a necessity. Due to fundamental technological changes, businesses such as Hyperscalers need to invest to remain relevant. This boom isn’t a medium-term cyclical investment, so much as a structural change. If firms don’t invest, they will become irrelevant. Others have pointed out that because the Hyperscalers are cash-rich with high margins, this investment is less likely to drain returns.
These arguments may well prove valid, and the current investment cycle could ultimately prove to diverge from historical precedent. Still, investors would do well to frame the current environment against the backdrop of past episodes where unusually high aggregate investment has often carried important signals about risk.
Implications for Investors
The AI boom is a macro theme that is driving markets in both positive and negative ways. While there is positive sentiment in the market surrounding the rise of AI, driven by the wave of Capex and economic investment it is fuelling, this may not be enough to sustain the bull market we are seeing. Several commentators have questioned the long-term profitability of many investments in the AI sector. What’s more, as we have shown here, history suggests that these investment waves are more exuberant. We have seen cycles in sentiment from extreme positivity to negativity. Changes in sentiment and the market's view of the sector's future profitability will be influential.
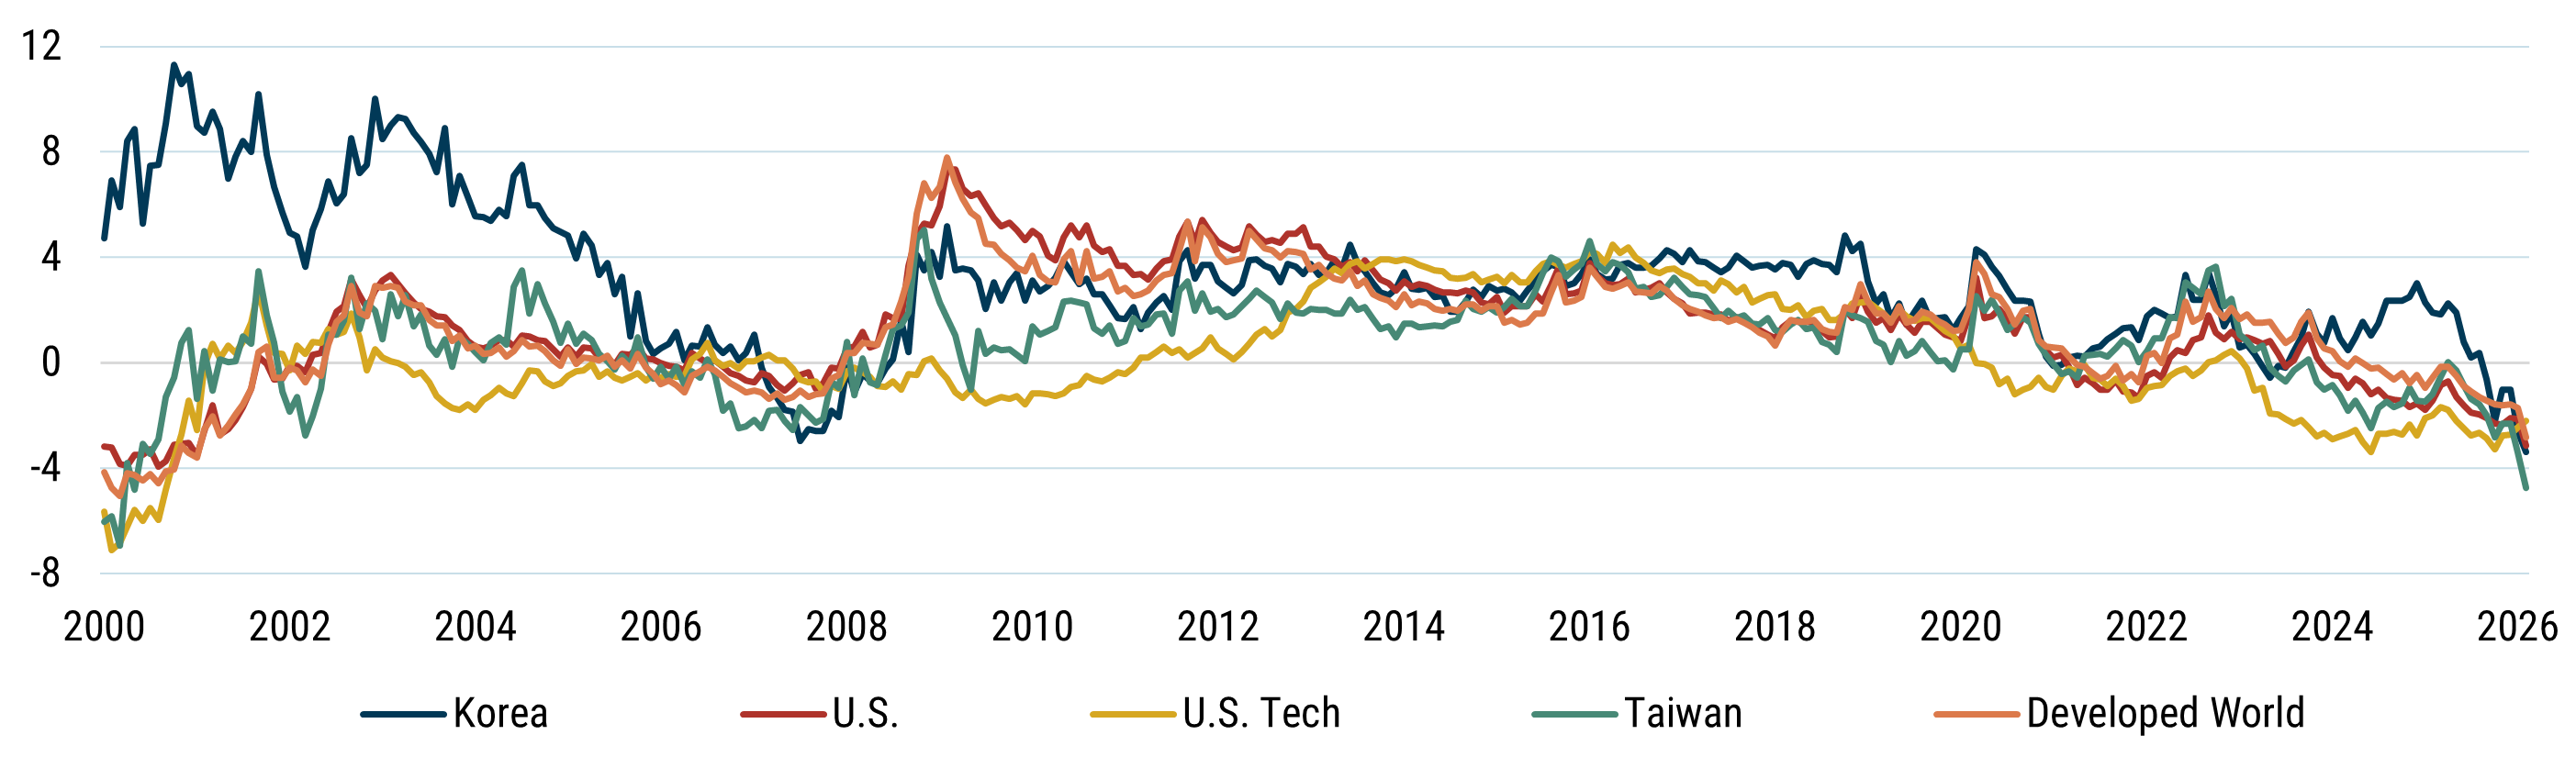
Within the GMO Systematic Global Macro Strategy, we do not take direct stock positions, though the AI boom heavily influences the portfolio's current positioning. The portfolio is currently positioned with a strong spread in AI countries: long the U.S., short U.S. tech, short Korea, and short Taiwan. What’s more, we see all of these markets as particularly expensive, with a long-term forecast (value) below the cash rate. Our shorter-term sentiment forecast is a key input to our models for positioning.
More importantly, because we see so many markets as expensive, the portfolio is quite short equities overall.
Exhibit 5: MSCI World – SGM Forecast
Data as of February 2026 | Source: GMO
Conclusions
There is little doubt that something unprecedented is happening in the world of AI, corporate investment, and equity returns. Investment is booming, and this is creating a surge of interest in the sector. Despite this, academic research (Arif and Lee, etc.) on increasing investment suggests this is more a time for caution. While AI may reshape the global economy, the surrounding investment cycle is still governed by the same macroeconomic and sentiment-driven forces that have shaped previous technological innovation and expansion periods.
Our positioning within the Systematic Global Macro Strategy is designed to capture the correction phase, where the tendency toward mean reversion is incorporated into our models. This new wave of investment is likely pointing towards lower market returns, but that doesn’t mean we can’t anticipate the wave, dive under it, position the portfolio accordingly, and look back as the water recedes towards the shore.
APPENDIX
Arif and Lee Investment variable construction
INVEST (corporate investment) is the weighted sum of firm-level investments in fiscal year t, aggregated to the market level using year-end market capitalisations as weights.
INVESTi,t = ∆NOAt-1 + R&Di,t / (1/2*(TAi,t-1 + R&DCi,t-1)+ TAi,t + R&DCi,t)
Where:
- NOA = net operating assets (non-cash assets – non-debt liabilities).
- TA = Non-cash assets are measured as total assets – cash and short-term investment, and non-debt liabilities are total liabilities + (minority interest – total debt).
- Additionally, ∆NOAt = NOAt — NOAt-1