Note: This article was originally written as a letter to clients on January 8, 2026. The views expressed are subject to change at any time based on market and other conditions.
Equity Dislocation celebrated its fifth birthday in October, and we are delighted that this was enjoyed in the positive context of returning 15.8% gross (13.4% net) for 2025. Indeed, as a market-neutral strategy that seeks to capitalize on the extraordinary dislocation between the valuation of value and growth stocks, we remain extremely pleased with longer-term performance. The strategy has delivered 69.3% gross (50.6% net) since inception on a cumulative basis, without any meaningful narrowing of the valuation gap. This success can be attributed to a combination of strong stock selection, driven by our proprietary valuation model, and effective risk controls.
EXHIBIT 1: EQUITY DISLOCATION STRATEGY SINCE LAUNCH
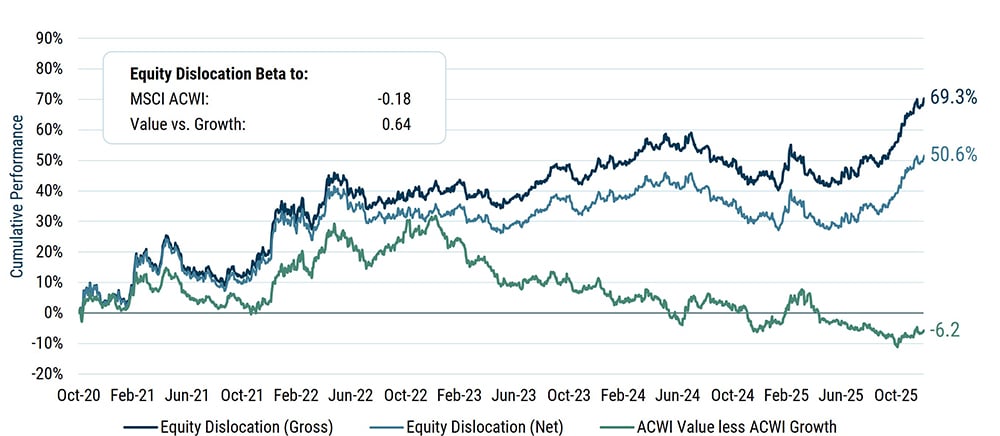
Data from 10/31/20 to 12/31/25 | Source: GMO
The above information is based on a representative account in the strategy selected because it has the fewest restrictions and best represents the implementation of the strategy. Net returns are net of management fees only.
Five-Year Retrospective
Before getting into a bit more detail on 2025 returns, we wanted to look back at how the strategy has performed in the various environments of the last five years.
Initially, it looked as if the Asset Allocation team’s thesis that the valuation gap would narrow was going to play out quite smoothly. As the world slowly returned to a post-Covid normality, value stocks that had been beaten down recovered nicely, while the growth darlings like Zoom and Peloton crashed back down to earth. From Equity Dislocation’s October 2020 inception through December 2022, MSCI ACWI Value beat MSCI ACWI Growth fairly comfortably, and the strategy had a return profile within expectations, returning 40.3% cumulatively gross of fees (34.1% net).
The emergence of Chat GPT into the mainstream at the start of 2023 reinvigorated investor enthusiasm for growth, however, putting a halt to value’s winning streak. MSCI ACWI Value has underperformed MSCI ACWI Growth for each of the last three calendar years by an average of more than 10% per annum. Despite this headwind, the strategy has managed to generate a modest positive cumulative return over this 3-year period.
We have noted previously that, even if the abnormally wide valuation spread does not narrow immediately, value can still outperform due to what we call the rebalancing effect: value benefits as some growth companies disappoint and become cheaper, entering the value index. Value also benefits as some value companies surprise on the upside and get repriced into the growth index. This effect is particularly pronounced when valuation spreads are wide because the valuation change associated with a move from value to growth, or from growth to value, is large. In the context of the Equity Dislocation Strategy, this rebalancing effect is demonstrated as strong security selection. It is this strong security selection, combined with effective risk controls, that has allowed us to generate a positive return over the last three years.
We believe that this profile can be maintained, with the strategy managing remarkably well through periods of growth outperformance, while still delivering the excellent returns that we would expect in periods of value dominance. (For example, the last two months of 2025 saw value rotate back into the ascendancy—MSCI ACWI Value beat MSCI ACWI Growth by 5.0%, with the Equity Dislocation Strategy up 8.7% gross of fees and 8.3% net for the same period).
From a diversification perspective, it is also worth noting that the strategy has exhibited a modest negative beta of -0.18 to MSCI ACWI over the period. We do not attempt to target negative beta. The strategy remains broadly dollar neutral (100% long/100% short) and so could be expected to be market and beta neutral. In reality, the overvaluations of growth stocks leave them much more susceptible to any kind of downturn, as we saw in 2022. That year was the only one of the last five years to deliver a negative return for equities, with MSCI ACWI down -18.4% and MSCI ACWI Growth trailing far behind at - 28.6%. The Equity Dislocation Strategy returned 16.6% gross of fees (14.2% net) in 2022, and we believe that, similarly, it is likely to deliver meaningful, diversifying negative beta just when you need it in a growth-led sell-off.
Exciting Outlook
As we write in early January 2026, our 20% exposure to the Equity Dislocation Strategy remains the biggest high-conviction position in the Asset Allocation team’s flagship unconstrained Benchmark-Free Allocation Strategy. Quite simply, we believe that there is still considerable money to be made as the spread between value and growth inevitably narrows.
We have included Exhibit 2 in our previous annual letters. When we launched the strategy, the relative valuation of the cheapest 50% of U.S. stocks over the most expensive 50% was at the 2nd percentile. Following two strong years for value in 2021 and 2022, the spread had narrowed to the 14th percentile. However, growth’s dominance in 2023 and 2024, along with a modest win in 2025, has reversed all of that. The spread now sits very close to where we started, at the incredibly attractive 4th percentile. For value to return to its median historic relative valuation in the U.S., it needs to outperform growth by 70%. Globally, value would have to outperform by roughly 50% to return to a fair relative valuation.
EXHIBIT 2: VALUE IS EXTREMELY CHEAP
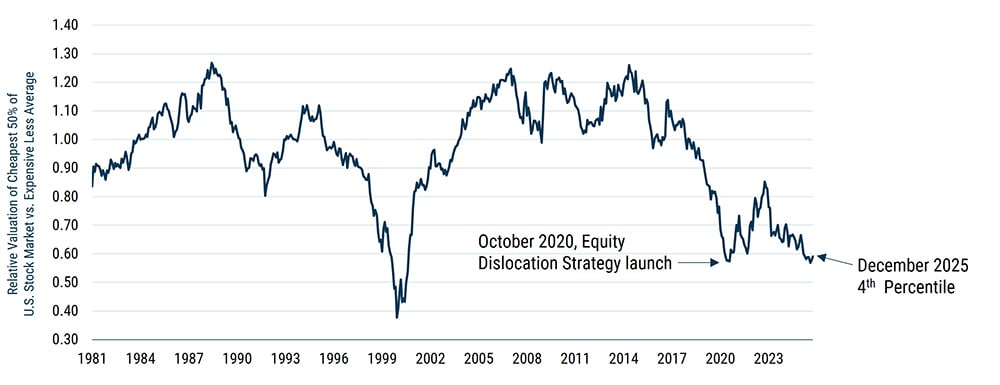
Preliminary as of 12/31/25 | Source: GMO
Stock valuations are calculated on a blend of Price/Sales, Price/Gross Profit, and Price/Economic Book.
Drivers of 2025 Performance
At a very high level, it was gratifying that both the long portfolio and the short portfolio contributed handsomely to performance. The long portfolio returned 33.0% gross, outpacing the MSCI ACWI Value return of 22.0% gross. The short portfolio also added meaningful alpha, having been up only 17.4% compared to the MSCI ACWI Growth return of 22.4%.
In developed markets outside of the U.S., value beat growth fairly comfortably and the strategy performed as expected, with some 10.1% gross added to absolute performance. Some of the top performers were textbook deep value positions, as four of the top ten contributing long positions were Financials. Our meaningful yet well-diversified exposure to Automobiles and Auto Components was also significantly positive despite tariff-related volatility throughout the year.
Growth modestly outperformed value in emerging markets, and the region detracted -1.0% from absolute performance. Although the long portfolio did very well, up 48.6% gross, the short book was up 63.6% gross. You probably would not have guessed that this result was in no small part due to three Korean Industrial stocks that enjoyed an average return of 165%. (For example, Doosan Enerbility, in the fast-moving game of nuclear power plant construction, was up a truly remarkable 270%.)
The strategy successfully added 3.4% to absolute performance in the U.S., a real triumph given that MSCI USA Growth beat MSCI USA Value by 8.0%. Of course, our thoughtful risk control measures, coupled with our focus on quality in security selection, gave us a head start on this naïve measure as we did not overly suffer from the surge in some of the mega-cap tech. Although the long portfolio in the U.S. enjoyed strong performance, most of the alpha was added by the short portfolio.
The most interesting sector was Information Technology, where we were short 28 U.S. securities. Despite it being a very strong year for equities, with the MSCI USA Growth Index up 20.9%, 18 of those stocks had negative performance while they were in the portfolio, and another two stocks had single-digit performance.
One of the worst performers in the group for the year, which averaged an 80-bp short position and added 0.4% to absolute performance, was HubSpot. If you are anxious to know what severe economic challenges HubSpot faced to send its shares crashing more than 40%, we will have to disappoint you—HubSpot grew its customers and revenues by broadly 20% during the year without compromising margins. Quite simply, high expectations for huge earnings beats meant that even strong results were viewed as insufficient, leading to sharp sell-offs. This is a key reason why we are not obsessing over identifying the catalyst for future growth stock underperformance—the weight of expectation built into valuations will inevitably lead to investor disappointment at some point.
The other eight U.S. Information Technology stocks that we held short delivered an average performance of more than 63%. Palantir, which was the single biggest detractor from absolute returns at the total portfolio level, was up a spectacular 135% for the year and is, somewhat bewilderingly, trading at a price/sales ratio well in excess of 100. Indeed, one of the reasons we remain excited about the Equity Dislocation Strategy is that there are plenty of stocks that continue to surf a wave of speculative excess. Exhibit 3 illustrates just how much this increased risk appetite has driven the market since the lows of “Liberation Day.”
EXHIBIT 3: SPECULATIVE GROUPS CONTINUE TO LEAD THE MARKET
High momentum and lower quality groups rallied most following Liberation Day market lows
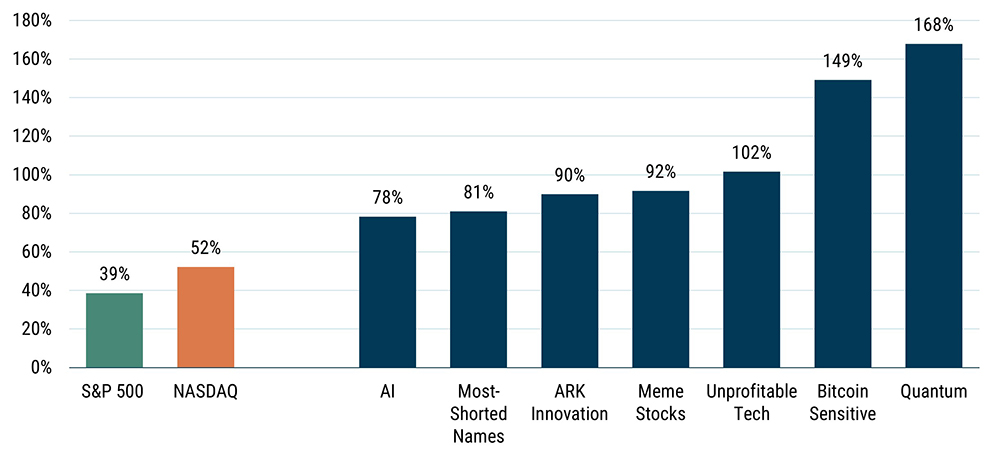
Returns for period from 4/8/25 – 12/31/25 | Source: Goldman Sachs
Most-Shorted Names is the Goldman Sachs Liquid Most Short Index (GSXUMSAL), composed of 70 stocks with the highest short interest relative to equity float, optimized for liquidity and capping Biotech at 10%. Meme Stocks is the Goldman Sachs high retail sentiment basket (GSXUMEME), which consists of U.S.-listed equities that are most popularly mentioned on retail communities. The basket is liquidity-optimized but may include stocks with potential borrow constraints. The Unprofitable Tech basket is composed of equities in tech-related industries that did not report a profit in the last 12 months and are not expected to do so in the next 12 months. Goldman Sachs attempts to exclude companies exposed to winning themes such as AI, Nuclear, Quantum Computing, and Cryptocurrency, as well as highly shorted companies. The Goldman Sachs U.S. TMT AI Basket (GSTMTAIP Index) consists of companies that are pursuing artificial intelligence or can help enable new technologies across software, semiconductors, tech hardware, media, internet, and IT services. The basket is liquidity optimized to trade $500mm in a day at 10% ADV. Bitcoin Sensitive is the Goldman Sachs Bitcoin basket (GSCBBTC1) and consists of U.S.-listed TMT stocks that are fundamentally related to Bitcoin across various segments (bitcoin mining, digital payment, crypto investment, and blockchain tech). The basket tends to track Bitcoin across cycles and is liquid to trade $100mm at 10% of volume.
Closing Thoughts
Ultimately, 2025 was a very satisfactory year, both in absolute terms and versus a naïve MSCI ACWI Value minus MSCI ACWI Growth. The value vs. growth spread in the U.S. has widened even further, and despite the narrowing of developed ex-U.S. spreads, our excitement about the Equity Dislocation Strategy’s prospects has only increased.