Executive Summary
It’s not just interest rate changes that affect the markets, changes in the Fed balance sheet can also be a source of negative returns to equity and bond markets. Systematic macro strategies can be a compelling approach to diversify this risk, generate alpha, and mitigate downside. We view today’s environment as a time when macro investors can profit by focusing on valuation, moving their assets, and avoiding trouble spots.
The macro environment is changing. These changes are becoming more rapid, and more permanent. Inflation is starting to look less transitory and wage pressure is starting to look real. Most importantly, central banks everywhere are starting to become much more hawkish about the future of monetary policy and how they intend to keep inflation at bay. With this, central banks are talking about the potential for raising rates and balance sheet reductions. Both appear inevitable, and both will impact markets.
Much has been written about the expected impact that rate rises will have on assets. In summary, the potential for increases in rates doesn’t bode well for future asset prices. Valuations have already been pushed to extremes and rate rises may add downside pressure. Arguably, we can take this as given.
But what about the reduction in central bank balance sheets? Given the massive injection of liquidity that we have seen, what impact has this had on the markets and what will be the impact of removing these funds? This question seems to have received much less attention, and undeservedly so. Even with a passing glance, the relationship between the Fed balance sheet and S&P 500 P/E (Exhibit 1) should spur a legitimate question about how much expanding the balance sheet has contributed to pushing up equity valuations. What happens when this reverses?
Exhibit 1: Have Changes in the Fed Balance Sheet Inflated Markets?
Fed Balance Sheet and the S&P 500 P/E
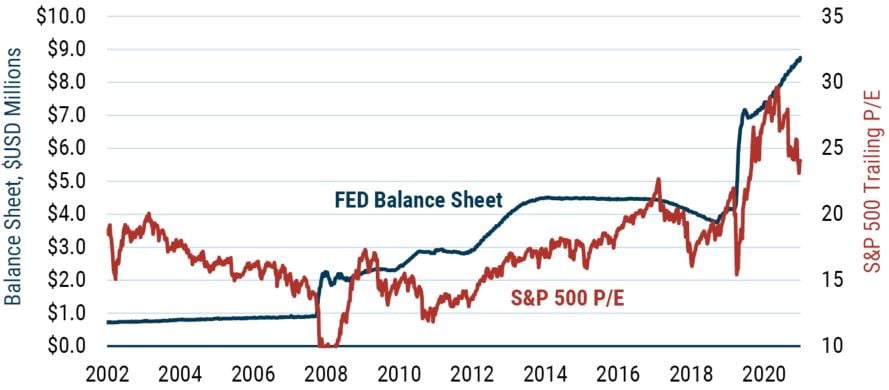
As of 12/31/2021 | Source: Federal Reserve Economic Data
In an upcoming article in the Financial Analysts Journal by Professor Talis Putnins from the University of Technology, Sydney, the author addresses this question by analyzing how the expansion of the Fed balance sheet has impacted equity markets. (The draft is available on SSRN.com). The article shares many of our concerns about the sustainability of inflated asset prices. We on the GMO Systematic Global Macro team have run similar analysis to the author to evaluate the effects on macro – and our own Systematic Global Macro strategy – to see if macro funds are similarly exposed to risks from a change in the balance sheet.
As a starting point, what does the article show? Using weekly data from January 2009 to October 2020, the author looks at the market responses to the Fed expanding or contracting its balance sheet (both univariate and controlling for other market variables) and draws some very interesting conclusions for investors. The author shows that markets respond positively (negatively) to expansions (contractions) of the Fed balance sheet. As central banks have injected liquidity, markets have reacted positively, and this has pushed up prices. This seems to be the strongest and most statistically significant in weeks 3 and 4 after the Fed actions. The reaction profile of markets from the article is shown in Exhibit 2 below. What it shows is that after week 0 (the week the Fed increases its balance sheet), market returns have been positively correlated to the size of the balance sheet change, and the effect seems to run for about 5 weeks. Increasing (decreasing) the balance sheet drives up (down) the market.
Exhibit 2: Lead/Lag Correlations of U.S. Market Reactions to Changes in the Fed Balance Sheet
Correlation of S&P500 Returns (∆S&P500t+k, ∆FedAssetst)
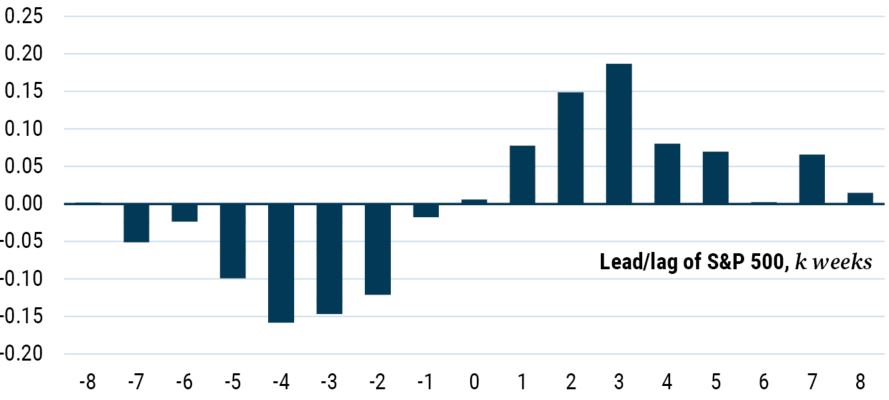
Source: Talis Putnins, 2021
Chart has been reproduced with permission from the author.
In addition, the author looks at just how much the Fed’s intervention has pushed up stock markets in recent times. The analysis suggests that about “one-third to one-half of the S&P 500’s 31% rebound from March to May 2020 can be attributed to the Fed’s aggressive balance sheet expansion during March and April of 2020.” The author then uses an econometric method (called a VAR model) to look at unexpected increases in the balance sheet. Based on this analysis, he concludes that stock markets are more sensitive to balance sheet contractions, and points out that unexpected changes in the balance sheet are more impactful on markets than expected changes.
This is an important issue for investors. The analysis shows a clear risk and certainly seems to support the notion that central bank activity may have been one of the factors that has helped push up the U.S. market. But now central banks are reversing their views on liquidity – and quickly. The Fed is beyond just talking about contracting its balance sheet – it’s now debating the speed with which it will do so. In summary, for long-only investors, this poses a significant risk to the downside. We think it is the key macro risk investors should be considering.
Do Balance Sheet Changes Impact Macro Returns?
While this analysis is an important consideration for long-only investors, what does this mean for a macro fund that invests using a long/short approach? Is this something that could be disruptive to alpha as well as beta, or can macro be a place to hide? Our analysis suggests that macro can offer protection from this downside risk.
To see if macro funds are exposed to movements in the balance sheet, we ran the same type of analysis as Professor Putnins. However, rather than using the returns to the U.S. equity market, we reran the analysis using the GMO Systematic Global Macro (SGM) returns and the HFRX Macro series using the same time period for comparison.. We found the results not to be meaningful – as a group, macro funds don’t seem to be exposed to movements in the balance sheet. Shown below are the correlations between the lead/lag returns of the two-return series and changes in the Fed balance sheet, which is similar to Professor Putnins’ method. The results show that the relationship between the Fed’s actions and both the HFRX and SGM (orange and red, respectively) appears to be just noise.
Exhibit 3: Lead/Lag Correlations of Macro Reactions to Changes in the Fed Balance Sheet
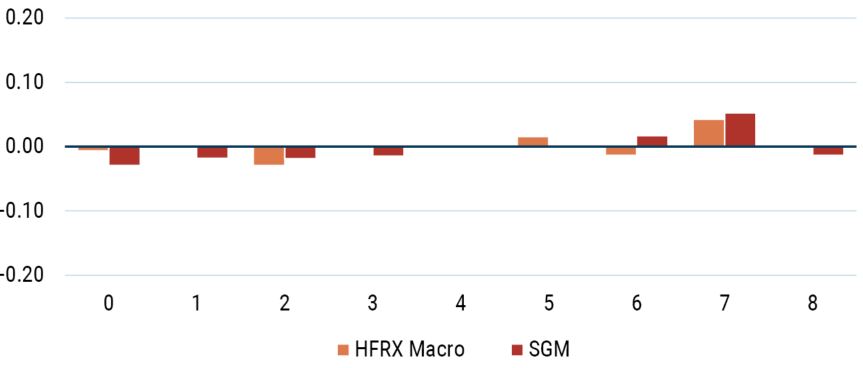
As of February 2022 | Source: HFRX, GMO
These results for macro do not surprise us. Part of the reason for this is touched on in Professor Putnins’ paper, which notes that the equity market actually responds to the movements of rates. If the Fed buys bonds, rates fall, the discount rate falls, and equities rise. In the case of macro, on the other hand, one of the properties we know about SGM (and several market neutral macro factors) is that the correlation to yield changes is extremely low. Looking at our SGM returns compared to changes in U.S. 10-year bond yields, we can see this low correlation (Exhibit 4). The same analysis using HFRX Macro returns gets a similar result. Taking it a step further, over a full market cycle, SGM tends to be lowly correlated to most asset classes, including both bond returns and the equity market in general, as Exhibit 5 details. The bottom line here is that when the Fed shrinks its balance sheet, it poses a significant risk to equity and bond returns, but SGM and macro funds can act as a diversifying hedge to this risk.
Exhibit 4: SGM Has Insignificant Correlation to Bond Yield Changes
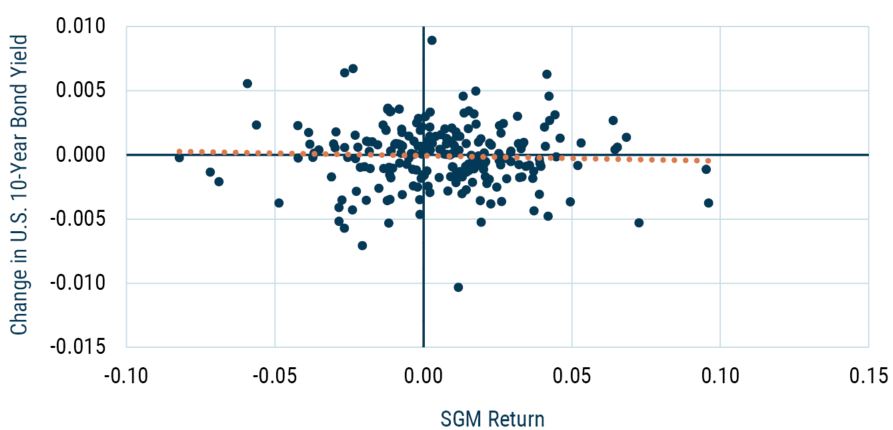
As of January 2022 | Source: FactSet, GMO
Exhibit 5: SGM Has Low Correlation to Various Benchmarks (March 2002 – March 2022)
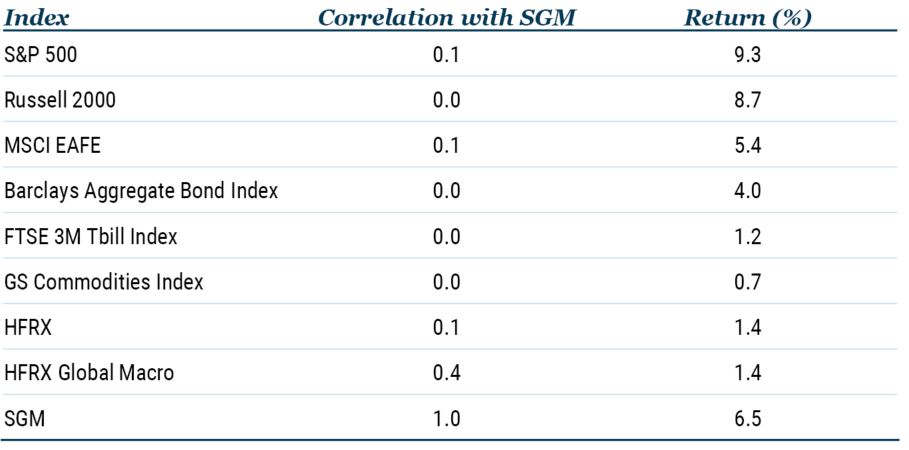
Inception date: 3/31/2002 | Source: GMO, J.P. Morgan, Bloomberg Barclays, FTSE, MSCI, Frank Russell, Goldman Sachs, Hedge Fund Research
Summary
So, what is the key takeaway for investors? For long-only investors, what central banks do with their balance sheets is very important. At a time when there seems to be a multitude of issues for asset prices, this adds yet another concerning matter. There seems to be little doubt that central banks will unwind their balance sheets – though the speed with which they are going to move is less than certain. Markets are already looking overextended and are starting to struggle, and this adds yet another downside risk. Beta everywhere is at risk.
For investors in macro, this seems to be a much less impactful issue. From a simple risk perspective, our analysis shows that SGM and other macro funds are significantly less sensitive to movements in interest rates than equity or bond markets. In an environment of uncertainty where we are faced with a potential reversal in liquidity, this provides a source of uncorrelated diversification.
What’s more, there is currently an outstanding opportunity for alpha in our SGM portfolio. Value is at the core of our approach, and at the moment we view most assets, including the U.S., as expensive. As a result of the magnitude of these value dislocations, the opportunities for macro alpha – which derives most of its return from relative value and cross-sectional trades – are the best we have ever seen in the 20-year history of running the SGM portfolio. In contrast, the forecast return to macro beta is the worst we have experienced in 20 years. We have seen time and time again that dislocated assets eventually revert. A central bank reversal in liquidity could contribute to this reversion, which would be supportive of our valuation-based positions.
As central banks prepare to unwind their balance sheets, GMO’s SGM portfolio and macro funds in general provide uncorrelated sources of return and so can diversify this risk. Macro continues to be an important solution for investors.
Talis Putnins, 2021:
Free Markets to Fed Markets: How Modern Monetary Policy Impacts Equity Markets
This paper is upcoming in the Financial Analysts Journal. A draft is available at:
https://papers.ssrn.com/sol3/papers.cfm?abstract_id=3621460
The authors would like to thank Professor Talis Putnins for allowing the reproduction of his chart in this article, and for his helpful comments.
Download article here.