Executive Summary
As we enter the second quarter of 2022, new uncertainties arising from the war between Russia and Ukraine were reflected in widening bid/offered spreads for the EMBIG-D index, presenting certain challenges for our valuation metrics. As with the sudden arrival of Covid-19 in 2020, underlying sovereign credit fundamentals in our metrics are in flux, suggesting caution in interpreting the results. Like Covid-19, much of the uncertainty has to do with the duration – in this case – of the war. The longer the war and resulting supply shocks, the more durable the fundamental shifts, which to date have favored commodity exporters and hurt importers, as they have certain tourism-dependent countries.
- External debt valuations appeared to improve as widening spreads have not yet been offset by higher expected credit losses. As in the acute initial phase of the Covid crisis, where ratings agencies lagged in downgrading credits, the sudden change in environment will likely result in ratings actions of an uncertain net magnitude. Thus, we caution interpreting the high credit multiple as an unambiguous buy signal. Meanwhile, the sharp rise in U.S. interest rates has improved the level of rates; however, a flatter and now inverted yield curve also suggests caution in extending duration.
- Within local debt, the picture is muddied by the expulsion of Russia from the GBI-EMGD index and the higher inflation environment. At the start of the quarter, Russia represented 7.2% of the GBI-EMGD and offered a very attractive FX valuation. At the end of the quarter, EM FX valuation is weakened by the rise in the inflation expectations but supported from a pure valuation and balance of payments perspective, ending at the lower end of the neutral range. In rates, new uncertainties around the length of inflation spikes challenge our real rate estimation; certainly, nominal rates have adjusted higher quickly, but so far, not by enough to overcome higher inflation forecasts. Having said that, the real yield differentials between EM and DM rates remain wide to offer, on balance, a mild to attractive picture for EM local debt.
In this piece, we update our valuation charts and commentary, with additional detail on our methodology available upon request. 1
External Debt Valuation
The EMBIG-D benchmark spread widened by 31 bps in Q1, ending the quarter at 400 bps. As seen in Exhibit 1, the fair market multiple is the benchmark’s credit spread to the spread that would be required to compensate for credit losses. This ratio rose over the course of the quarter. The multiple stood at 3.0 on March 31, 2022, up from 2.8 on December 31, 2021. We estimate the credit multiple threshold range by analyzing the relationship between the subsequent two-year EMBIG-D credit spread returns and the credit multiple historically. A level that is higher than the upper range of the threshold (currently 2.8) has historically been associated with positive credit returns, while a level below the lower range of the threshold (currently 2.0) is associated more with negative credit returns over the next two-year period. This threshold range estimate is recalibrated on an annual basis. A level within this range would be considered neutral, and the market valuation ended the quarter above the upper end of this neutral range.
Exhibit 1: Long-Term View of the "Fair Market Multiple" for Emerging External Debt
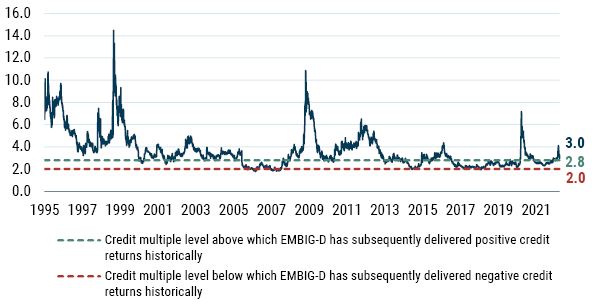
As of 3/31/2022 | Source: GMO calculations based on Bloomberg and J.P. Morgan data
Credit spread widening was part of the reason for the increase in the multiple over the quarter, as the multiple’s denominator – the fair value spread or expected credit loss – rose by only 6 bps to 138 by the end of March. It should be noted that on the last day Russia was in the index, March 30, the spread was 147 bps. Regular readers will recall that this fair value spread is a function of the weighted-average credit rating of the benchmark, along with historical sovereign credit transition data and an assumption about recovery values given default. 2 In terms of the first quarter, the fair value spread was strongly influenced by the downgrade in Ukraine (B to B- in February). Additionally, Sri Lanka was downgraded from CCC+ to CCC in January (and subsequently entered default status in April), and Peru was downgraded from BBB+ to BBB in March. In notable upgrades, oil-exporting Angola advanced from CCC+ to B-.
In rates, U.S. Treasury yields rose sharply and flattened/inverted during the quarter, with the 10-year yield rising by 83 bps and having a negative impact on benchmark returns. We measure the “cushion” (which we proxy as the slope of the forward curve) in Treasuries by the slope of the forward curve of the 10-year swap rate, depicted by the light-font lines in Exhibit 2. While long-end U.S. Treasury yields trended upward during the quarter, the slope of the 10-year forward curve inverted, from 24 bps to -7 bps as of the end of March (the entire curve shifted higher by about 50-80 bps). This indicates the market is pricing in less of a cushion for rising rates, as the forward curve represents the path that would make an investor indifferent to holding Treasuries and cash. We view the decline slope as reducing the prospective relative valuation of 10-year risk-free rates versus cash relative to the previous quarter.
Exhibit 2: 10-Year U.S. Treasury Swap Curves at Quarterly Intervals
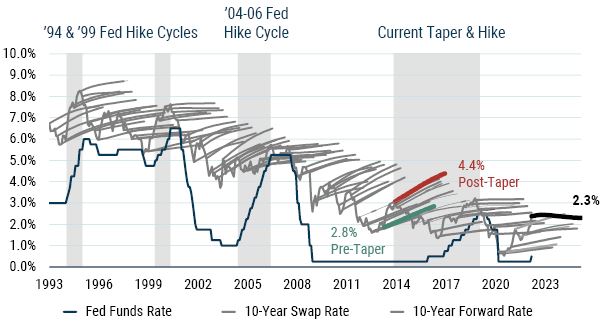
As of 3/31/2022 | Source: GMO
Local Debt Markets Valuation
In local EM markets, we use a similar valuation metric to consider the relative attractiveness of the asset class. Our overall GBI-EM FX return barometer reversed course over the quarter and is now approaching the bottom end of the neutral range. Two main factors can explain this trend: 1) As Russia was removed from the GBI-EMGD at the end of the quarter, so was RUB within our framework. As RUB was very attractive under this framework and had a high weight in the benchmark, this led to a lower GBI-EMGD expected spot FX return; and 2) As inflation keeps being revised upward, the third pillar of the model, economic cycle, contributes more negatively to the expected FX return forecast. However, the real yield differential with G3 rates, while reduced, remains wide, and USD valuations remain supportive for local EM FX.
Exhibit 3 shows a time series of our EM FX model estimate of the GBI-EMGD benchmark’s spot FX valuation. Recall that our model analyzes trends in macroeconomic fundamentals such as balance of payments composition and flows, valuation of the currency, and the economic cycle. It uses regression analysis to produce an estimate of total expected FX returns for each country in the benchmark. These are then combined into a single value of total expected FX return using a market cap-weighted average of currencies in the benchmark. Next, we deduct the carry (interest-rate differential) from the estimated value of total FX expected return (both aggregated proportionally to market cap and index levels) to get to an expected EM FX spot return for GBI-EMGD. Finally, we estimate a neutral range based on the backtest of the overall model to assess whether EM currencies are cheap, rich, or fairly valued. A value that is higher (lower) than the upper (lower) value of the neutral range could potentially indicate “cheap” (“rich”) currencies. A value that is within the neutral range would be considered “fair.” EM currencies, though not outright rich, ended March approaching the rich end of the neutral range. When we decompose our EM FX valuation signal into proxies of its three components (long-term valuation, balance of payment, and economic cycle), we still find that EM FX is cheap from a long-term valuation perspective and very cheap from a balance of payment perspective. What continues to hold EM FX back somewhat versus the pre-2008 period is the lower growth and higher inflation environment, as mentioned above (third pillar of the model). But as growth recovers and inflation begins to come down, we are mindful that this pillar could also turn around.
Exhibit 3: GBI-EMGD Expected Spot FX Return Given the Fundamentals
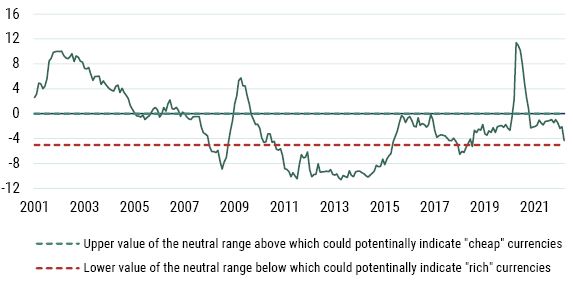
As of 3/31/2022 | Source: GMO
As for EM local interest rates, we consider differentials in real yields to gauge the relative attractiveness of EM against DM (see Exhibit 4). In this regard, the story that has been in place for many quarters (years, actually) remains as we can still see a substantial positive gap between EM and DM real yields. However, that gap tightened during the quarter as emerging real yields fell by 76 bps to 1.71%. Specifically, the spread between EM and U.S. real yields tightened by 12 bps during the quarter to 495 bps, while the spread between EM and G3 tightened by 2 bps to 440 bps. Having been stable for several years, the 5-year average of the spread between EM and U.S. real yields rose in Q1, from 245 bps to 259 bps. By our calculations, the real yield in the U.S. fell to -3.2% in March from -2.6 % in December, while the European real yield and the Japanese real yield also remained in negative territory.
Exhibit 4: Inflation-Adjusted Bond Yields
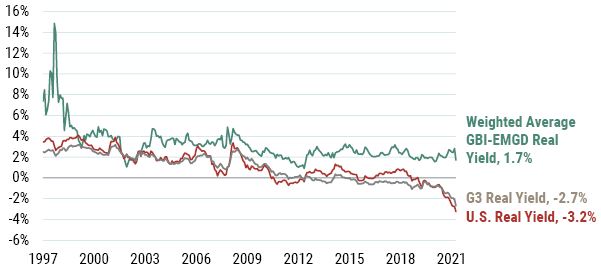
As of 3/31/2022 | Source: GMO
Liquidity
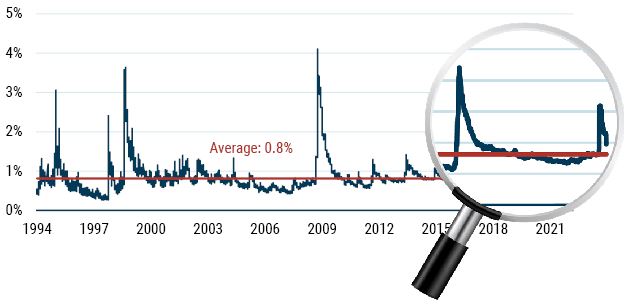
One key feature of EM is low baseline and occasionally very poor liquidity. We consider this a feature of EM and GMO’s portfolios seek to manage this risk while extracting well-compensated illiquidity premia as appropriate. We note that while significant volatility in spreads occurred around the initial shock of Russia’s invasion of Ukraine in February, overall bid-ask spreads have since normalized and continue to indicate elevated transaction costs conditions (see Exhibit 5).
Exhibit 5: EMBIG-D Bid-Ask Spread (% of price), Since December 1993
As of 3/31/2022 | Source: GMO
Investing from a Non-USD Perspective
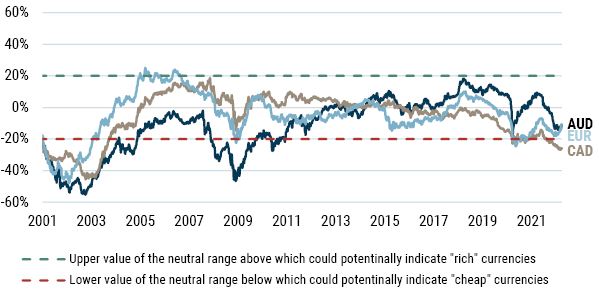
The preceding discussion addresses asset class valuations from a USD-based investor’s perspective. For investors from other perspectives (below) we discuss the valuation of the USD relative to the EUR, CAD, and AUD (Exhibit 6) and current hedging costs (Exhibit 7). We note that hedging costs have generally declined for all major base currencies and have been generally quite stable through the extraordinary macro conditions of the past year. Currently, we view all three major non-USD base currencies as becoming increasingly cheap. This also points to the fact that the USD looks expensive pretty much against all other developed market currencies. Our fixed income quantitative team sees this as a signal of a potential long-term downward trend of the USD based on the long-term PPP valuation model.
In summary, we note the favorable credit environment for external debt but emphasize the uncertainty of current events and rate movements on this outlook. The EM FX valuation outlook offers a mixed picture given EM FX looks cheap from the perspective of pure valuation (Pillar 1) and balance of payment (Pillar 2) but expensive from an economic cycle’s perspective (Pillar 3). Last, a stretched USD valuation could suggest a secular downward trend with the related medium-term expectations of stronger EM currency valuations down the road. Finally, real yield differentials for EM relative to DM, while lower, remain wide versus history, making EM local debt relatively attractive from that perspective.
Exhibit 6: Historical Currency Valuation since 2001
As of 3/31/2022 | Source: Bloomberg, J.P. Morgan, GMO
Exhibit 7: Annual Roll Yield Difference when Hedging USD to AUD, CAD, and EUR Base
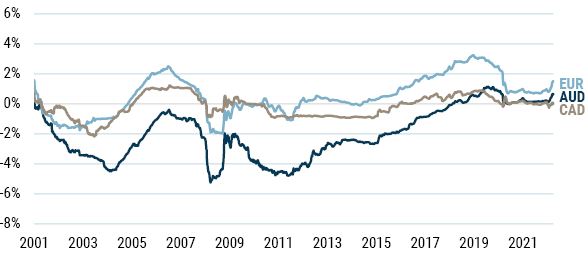
As of 3/31/2022 | Source: Bloomberg, J.P. Morgan, GMO
Download article here.
Subscribe to GMO Research
For more detail on the methodologies referred to throughout this piece, please contact your GMO representative.
We’ve recently enhanced this process to accurately reflect the ratings of quasi sovereign issuers instead of assuming sovereign ratings for all benchmark constituents. The overall effect is minor given the small percentage of quasi-issuers that have a different rating than the sovereign. Specifically, to calculate the weighted-average credit ratings of the benchmark, the bonds for each country are first divided into sovereign and quasi-sovereign categories. For each quasi-sovereign issuer, we use the S&P credit ratings specific to that entity if available; otherwise, its corresponding sovereign credit ratings are used. The weighted average is a market-value weighted average of these individual ratings corresponding to each bond.