Executive Summary
- Before the current downturn, the market was offering up very attractive relative equity opportunities as some pockets of the market were much cheaper than others.
- Bear markets often play out in three phases, with cheap assets outperforming in Phases 2 and 3. This potentially presents an opportunity for the valuation-sensitive investor willing to buy cheap assets today.
- U.S. and non-U.S. markets have fallen roughly in tandem in local currency terms maintaining their historically wide valuation spreads; Europe, UK, and Japan Value stocks are cheap in absolute terms while Emerging Market (EM) Value stocks are extremely cheap.
- The U.S. dollar has strengthened against a basket of EM currencies, leaving EM currencies 1.4 standard deviations cheap relative to history.
- In a sharp drawdown, correlations among assets rise. Once peak volatility fades, however, these dynamics will renormalize. Now is the time to act on your portfolio allocation.
It has been an extraordinary four weeks in markets worldwide. In the past 20 trading sessions, the S&P 500 has seen more 3%+ daily swings than it had in the previous 5 years. Equity markets globally, with few exceptions, have plunged, delivering the fastest -30% moves on record for most indices. Fixed income markets are turbulent, with liquidity so sparse that U.S. Treasuries – the safest of assets – have seen bid-ask spreads widen beyond 1 point.1 Then there’s the cheap stuff.
When Cheap Gets Cheaper
Prior to the downturn, we were excited by the extraordinary spreads between cheap and expensive assets. At the beginning of the year, EM Value stocks looked poised to deliver double-digit returns over the S&P 500. We also predicted Small Cap Value stocks would trounce cap-weighted indices in the U.S. and in the rest of the developed world.2 The gap between Value and Growth looked extremely wide across global markets, reaching levels unseen outside of the Tech Bubble. Yet cheap assets kept getting cheaper.
It is not a particularly pleasant feeling to own an asset whose price has dropped. It is doubly uncomfortable doing so when that asset was not covering itself in glory during the good days. But we do not decide whether to own an asset or not based on how it has felt to hold it historically; we do so on our best judgment of the future returns we believe the asset can deliver. And many of the cheap assets of yesterday, pandemic notwithstanding, seem quite likely to outperform.
Perhaps this gives you pause. Assets tend to be cheap for one of two reasons – either because their future growth expectations are low, or because their perceived risk is quite high. Often, both. Holding a basket of potentially risky companies during a period of heightened uncertainty, with market volatility as high as it is, can feel terrifying. As far as history is concerned, however, cheap assets have been a winning proposition during bear markets.
The Three Phases of Bear Markets
Recognizing that not all bear markets follow the same pattern, Jeremy Grantham likes to describe the evolution of cheap assets during a typical bear market as having three phases.
- In the first phase, all assets fall with cheap performing in line or a bit worse than the broad market.
- In the second stage of a correction, even though the market continues to sell off, cheap assets begin to outperform.
- In the final stage, whether a bear market goes into overdrive or recovery, cheap starts delivering positive absolute performance.
This isn’t a story that just applies to traditional Value.3 Cheap assets generally behave in this triphasic manner. The unwind of the Tech Bubble showed that pattern holding, for instance, in regional asset allocation. As markets started to wobble in early 2000, EM Value equities (which were quite cheap, having been pummeled during the Asian and Russian Financial Crises) sold off significantly more aggressively than U.S. equities (which, as you know, were wildly overpriced). By the end of 2000, as the Tech Bubble break became clear and markets plummeted globally, this dynamic had changed. EM Value, though still sagging slightly for a moment, soundly beat the U.S. Even with the initial sell-off considered, EM Value was matching the U.S. by the end of 2001, beating it by the end of 2002, and leaving it in the dust by 2003. Four years after the Tech Bubble began to unwind, U.S. stocks left their investors 15% behind where they had started. EM Value ended the period 40% ahead (see Exhibit 1).
Exhibit 1: Tech Bubble Crash Performance
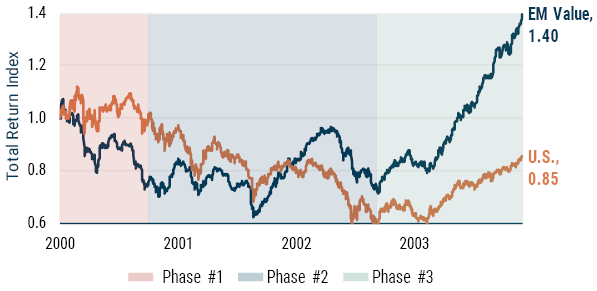
Data from 1/31/00 - 12/31/03 | Source: GMO, Bloomberg, MSCI, Worldscope, Compustat
Examples of the cheap-loses-then-wins dynamic in bear markets abound (see Exhibit 2). Japanese Value lost a lot of ground during the Japanese bubble yet had massive returns for years as the bubble unwound. Small Cap Value stocks, particularly hard-hit at the early stages of the 1973 bear market, likewise outpaced the broad market as returns stabilized. And that same style doubled the dose of outperformance in 2000, when both Small and Value had record-beating discounts to the U.S. market as a whole.4
Exhibit 2:
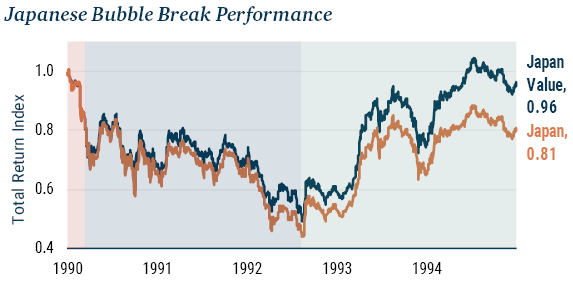
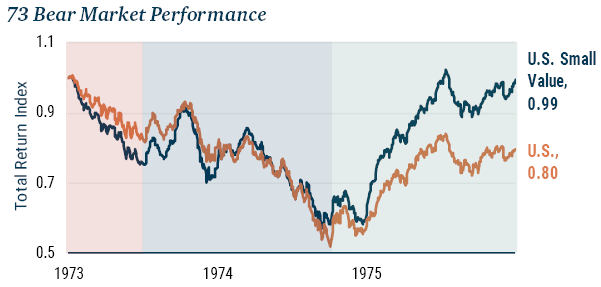
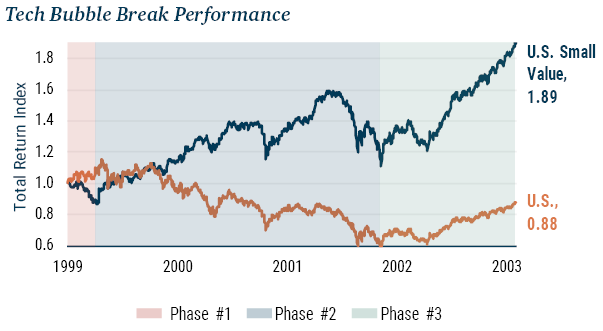
Source: GMO, Bloomberg, MSCI, Worldscope, Compustat
The Current Correction: Cheap International Equities and an Expensive Dollar
What matters for investors today is not history, however, but the current correction. Cheap assets are down generally, and they have yet to enter “Phase 2.” The silver lining is, of course, that we can add to cheap assets, such as Value stocks within Europe, UK, and Japan (MSCI EAFE) and U.S. corporate credit, at significantly more attractive levels than we could before.
Emerging markets, to us, are even more compelling, especially when we analyze this year’s price action. Though MSCI EM – and MSCI EM Value within it – has lagged a bit year-to-date, this is in large part due to the extraordinary dollar rally that has occurred simultaneously with the equity markets’ meltdown. Exhibit 3 shows the performance of the 10 largest countries in MSCI EM alongside that of the U.S. in local currency and in USD. It’s easy to see that the dollar has not been an insubstantial contributor to relative performance.
Exhibit 3: YTD Total Returns for EM and U.S.
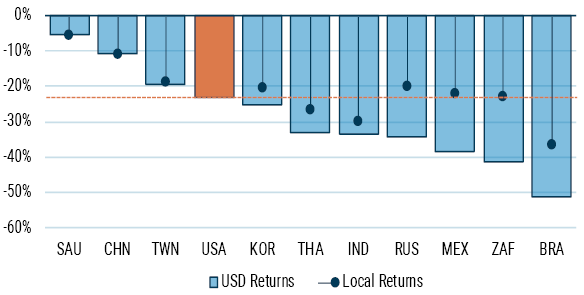
As of 4/4/20 | Source: GMO, Bloomberg, MSCI, Worldscope, Compustat
Note: Saudi Arabia (SAU) and China (CHN) do not have floating exchange rates.
All countries with floating exchange rates in Exhibit 3 have seen some devaluation of their currencies against the greenback, with the Taiwanese dollar suffering the least (close to 1%) and the Brazilian real the most (a 21% depreciation!). Without the dollar move, in fact, MSCI EM would be ahead of the U.S. market year-to-date.
Though the dollar move is real, and it hurts, it is not without precedent. In fact, two separate factors have contributed to the USD rally that has taken place. The first one is the correction itself. When a global risk-off event takes place, investors tend to flee “risky” currencies in favor of the dollar, leading to a temporary appreciation of the latter. This is easy to see by looking at how sensitive the returns of the MSCI EM currency basket are to the local returns of MSCI EM equities: a 5% drop in the latter has tended to be accompanied by approximately 1% of currency depreciation (see Exhibit 4).
Exhibit 4: MSCI EM Local Returns vs. EM FX Returns (Weekly)
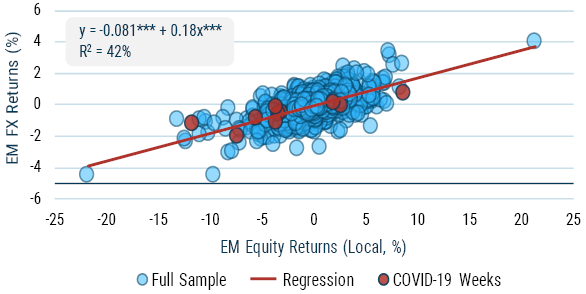
As of 4/4/20 | Source: GMO, Bloomberg, MSCI, Worldscope, Compustat
These moves seem to have become sharper since the GFC. Due to the rising demand for dollars from foreign institutions5 at a time when regulations have made dealers significantly less capable of providing dollar liquidity, flight-to-safety events have led to even stronger USD appreciation than they did in the past. Some of this hard currency strength will probably (and has already started to) subside as central banks globally become more active in trying to provide dollar liquidity to local institutions.
The second contributor to dollar strength this year was the sudden oil price war that exploded into the fray mid-March, sending commodity currencies (such as the real and the ruble) into a tailspin. Though we do not have any profound insight into when oil prices will recover, we are still somewhat sanguine on EM currencies themselves. Today, the USD looks quite expensive (see Exhibit 5), flagging as unattractive against practically all the EM currencies we track.6 As we have noted before in this piece, the tailwind of valuations should not be underestimated, even in a bear market.
Exhibit 5: Valuation of MSCI EM Currencies
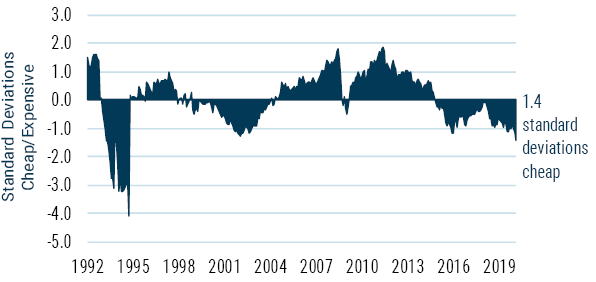
As of 3/31/20 | Source: GMO, Bloomberg, MSCI
Conclusion
COVID-19 has disrupted life and markets both, ending one of the longest bull markets (and probably one of the longest economic expansions) on record. As is typical in bear markets, correlations have spiked as assets have corrected, with cheap and expensive securities both selling off by similar amounts. While the events surrounding this bear market are unique, we still think history is a useful guide, and that this is not likely to last forever. Low valuation assets – in security selection and in asset allocation – have typically outperformed the market both as drawdowns deepen and as they end. Today, by allocating to cheap regions (such as emerging markets), we believe investors are likely to benefit both from the dynamics of cheap assets as bear markets progress and from currency tailwinds as the dollar strength typical of the onset of a crisis fades. We are confident that the assets we hold today will outperform traditional benchmarks, and we believe that they will do so whether the markets recover or continue to drop.
Download article here.