Investors still seem too comfortable
Today we see the biggest deviation in GMO’s Comfort Model since the internet bubble
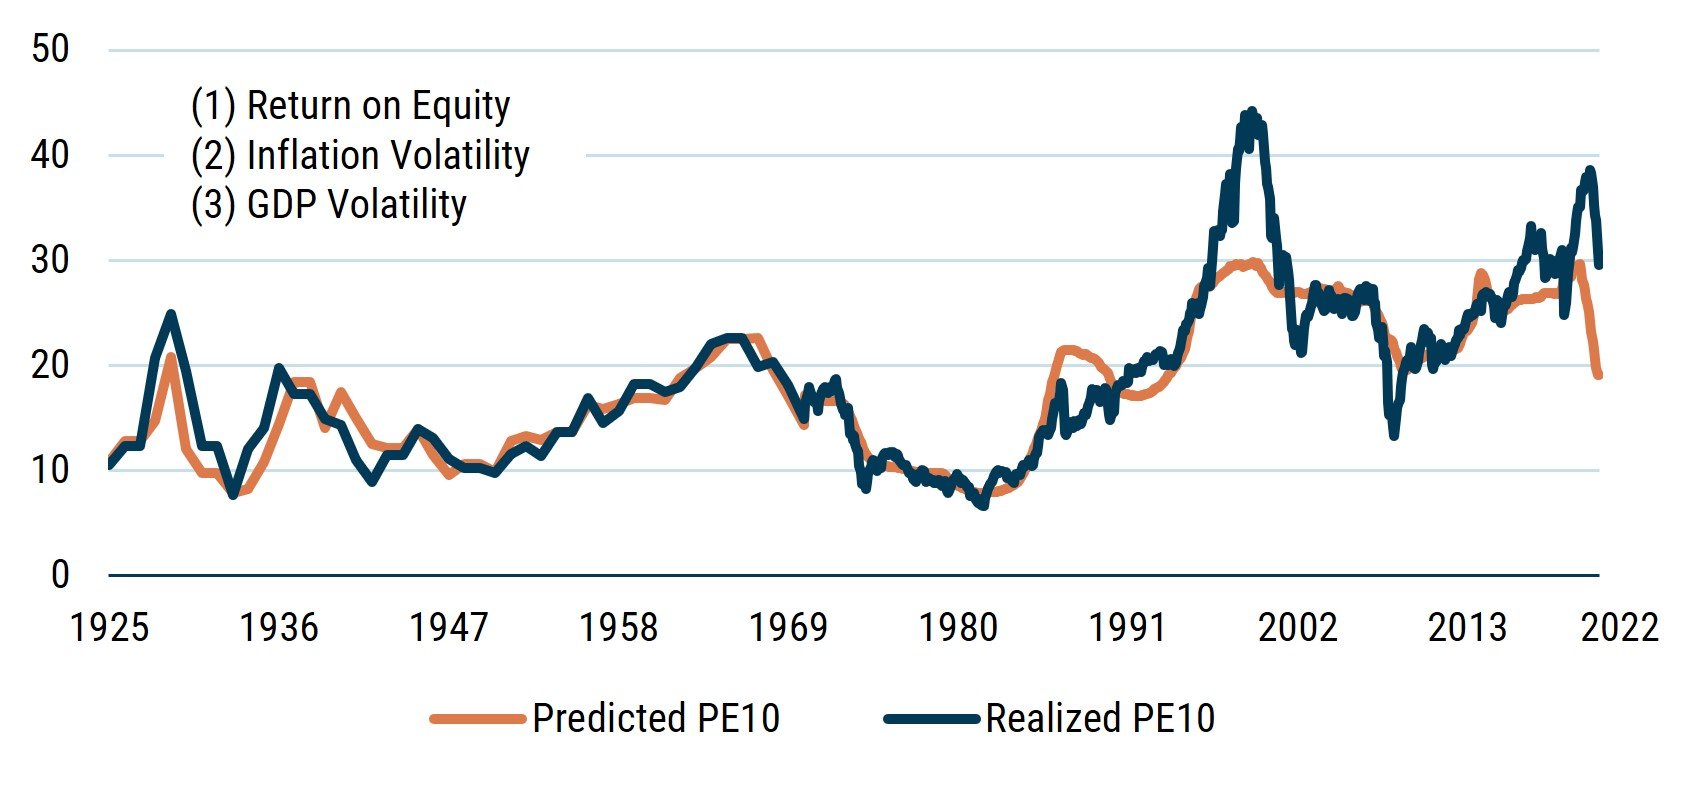
As of 6/30/2022 | Source: GMO
As Robert Shiller has written, market participants are always in search of an explanatory narrative. Just tune into CNBC or Bloomberg TV any day and you’ll hear different terms bantered about: “TINA” (i.e., there is no alternative) was around for a while. The United States was the cleanest “dirty shirt,” leaving U.S. stocks more attractive than others around the world. Now inflation is making us question the “Fed put.” These narratives may be great for pundits, but for us, they are incomplete answers.
In the late 1990s, Ben Inker and Jeremy Grantham created an explanatory model, called the Comfort Model, which sought to explain the current P/E 1 of the market. 2 The model is based on the simple premise that the conditions which make investors comfortable are high profits, stable economic growth, and inflation of around 2%. The higher the profits, the more stable the economic growth, and the closer inflation is to 2%, the more comfortable investors are. With greater comfort, investors are more likely to pay a higher multiple on the market and vice versa. The explanatory power of the model is incredibly high with an R-squared of more than 80% over a period spanning almost 100 years. (Jeremy Grantham has even remarked that he would not believe such a high R-squared unless he saw the data himself!)
For much of the decade leading up to COVID-19, a combination of excellent profitability and some of the least volatile economic conditions in history implied that the U.S. stock market would trade at substantially higher valuations than long-term averages. But now, with economic growth much more volatile and inflation farther from the market’s 2% happy place than we have seen in 40 years, things suddenly look far less comfortable for investors. In fact, the Comfort Model peaked in March of 2021 and P/E ratios peaked later in 2021, shortly before Jeremy Grantham wrote “Let the Wild Rumpus Begin” in January of this year. While the fall in the S&P 500 this year has brought down valuations somewhat, the fall in investor “comfort” in recent months has been even more extreme, and the Comfort Model today is showing the widest disparity between its predicted P/E and the market’s actual P/E since the late 1990s. At that time, the Comfort Model suggested that P/E ratios should have been at their highest ever, but the frenzy of the internet bubble took the market multiple to even more extreme levels than the model suggested it would. Today is notably different, with the Comfort Model suggesting a more subdued P/E of 19x and the market remaining at a fairly lofty P/E of about 30x. 3 Should today’s investors react to conditions as they generally did in the century leading up to now, the U.S. stock market may well have significantly further to fall.
With this compelling data, what is an investor to do? In our Asset Allocation portfolios, we are maintaining a less-than-normal weight in risk assets. We have added some equities at the margin – including to developed non-U.S. equity markets. We’ve added to our Resources Strategy as we seek to maintain inflation-resilient portfolios. We have also added to our High Yield Strategy as spreads have widened to much more attractive levels. Our biggest bet continues to be long GMO Value and short GMO Growth – our Equity Dislocation Strategy – which we continue to believe has further to run. However, as the Comfort Model suggests, we expect better buying opportunities and have plenty of dry powder for when that time comes.
Download article here.
We are using a 10-year Cyclically Adjusted P/E.
The Comfort Model is explained in further detail in our 2Q 2017 Quarterly Letter, “Why Are Stock Market Prices So High?” by Jeremy Grantham.
As of market close on 6/30/2022.
Disclaimer: The views expressed are the views of Matt Kadnar through the period ending July 2022, and are subject to change at any time based on market and other conditions. This is not an offer or solicitation for the purchase or sale of any security and should not be construed as such. References to specific securities and issuers are for illustrative purposes only and are not intended to be, and should not be interpreted as, recommendations to purchase or sell such securities.
Copyright © 2022 by GMO LLC. All rights reserved.
We are using a 10-year Cyclically Adjusted P/E.
The Comfort Model is explained in further detail in our 2Q 2017 Quarterly Letter, “Why Are Stock Market Prices So High?” by Jeremy Grantham.
As of market close on 6/30/2022.