Executive Summary
The first and easiest leg of the bursting of the bubble we called for a year ago is complete. The most speculative growth stocks that led the market on the way up have been crushed, and a large chunk of the total losses across markets that we expected to see a year ago have already occurred. Given the starting conditions of extraordinary speculative euphoria, this was all but certain. The negative surprises of last year, from war in Ukraine to the global inflation spike, were quite unnecessary to ensure a significant downturn.
Now things get more complicated. While the most extreme froth has been wiped off the market, valuations are still nowhere near their long-term averages. Further, in the past, they have usually overcorrected to below trend as fundamentals deteriorated. Such an outcome still remains highly likely, but given the complexities of an ever-changing world, investors should have far less certainty about the timing and extent of the next leg down from here. In fact, a variety of factors – especially the underrecognized and powerful Presidential Cycle, but also including subsiding inflation, the ongoing strength of the labor market, and the reopening of the Chinese economy – speak for the possibility of a pause or delay in the bear market. How significantly corporate fundamentals deteriorate will mean everything during the next twelve to eighteen months.
Beyond the near term, for long-horizon fundamental investors, the biggest picture remains that long-run issues of declining population, raw materials shortages, and rising damage from climate change are beginning to bite hard into growth prospects. The resource and geopolitical shocks of last year will only exacerbate those issues. And over the next few years, given the change in the interest rate environment, the possibility of a downturn in global property markets poses frightening risks to the economy.
The State of the Bubble: Things Get More Complicated
Well that was exciting! There have been far too many boring years in my 55-year career and 2022 was not one of them! Right up front we can all agree on one thing: stocks, whether blue chip or speculative, are a whole lot cheaper than they were a year ago and buying them now will give a much less disappointing return than would have been the case then.
So let’s review the bidding. The S&P 500 needs a rally of 33% to recover last year’s losses in real (inflation-adjusted) terms, 1 the Nasdaq an intimidating 61%, and ARKK, Cathie Wood’s ETF, as a proxy for aggressive growth stocks, would need to triple! Some of the very largest cap and most reliable growth names – the likes of Amazon, Alphabet, and Meta, the wonder companies of the past decade – have to rise 70% to 150% to regain their 2021 peaks. And the damage in a single year to broadly diversified stock/bond portfolios is the worst in nearly a century. At the beginning of last year, in “Let the Wild Rumpus Begin,” we predicted that total losses across the three major asset classes of stocks, bonds, and real estate could reach $35 trillion in the U.S. alone, including $17 trillion in stocks and $6 trillion in bonds. Well, so far, with real estate still making up its mind, losses in U.S. stocks have been over $10 trillion and in bonds over $5 trillion, in addition to an unexpectedly large loss of $2 trillion in cryptocurrency. Certainly, a decent chunk of the losses we predicted have already occurred, a down payment if you will.
Year-end reviews are generally ascribing these pretty serious losses to the combination of the war for Ukraine, described as unexpected, and the surge in inflation, also described as unexpected in its severity and persistence. (A few commentators also throw in Covid-19 and the unexpected bottlenecks and reduced growth Covid caused in the global economy, especially in China.) The key here is of course the word “unexpected.” The irony for me is that I expected just this kind of broad market decline without any such unexpected help. My reasoning was simple. Explosions of investor confidence in persistently rising prices, such as existed two years ago, are rare and have only occurred in the U.S. three times in the equity market – 1929, 1972, and 2000 (and even then, 1972 was marginal) – and a single time in the housing market, in 2006. In the equity market examples, in order to reach bubble proportions, the three all needed long economic upswings, record or at least handsome margins, a strong employment situation, and behavior from the Fed and the government that was supportive of speculation. In short, a nearly perfect environment for investors. From these economic, financial, and psychological peaks there was probably only one way things could proceed: they could only deteriorate, and that is precisely what they all did.
The interesting feature of these incremental “unexpected” mishaps of the last year is that they are likely to intensify and complicate the last phase of our current market downturn. As my last note “Entering the Superbubble’s Final Act” tried to make clear, the first phase of an extreme bubble breaking is in my opinion almost certain – and rightly or wrongly that was how I saw the 2000 and 2007 breaks in their first phases. To prick these bubbles all you have to do is have investors question whether their nearly perfect economic and financial conditions can indeed be extrapolated forever. 2
Almost any pin can prick such supreme confidence and cause the first quick and severe decline. They are just accidents waiting to happen, the very opposite of unexpected. But after a few spectacular bear market rallies we are now approaching the far less reliable and more complicated final phase. At this stage housing markets, which are always slower to react, have not fully rolled over yet; neither has the economy gone into recession, nor have corporate profits yet been severely hit. The length and depth of continued market decline from here depends on how precisely the deterioration from perfect conditions will play out.
War in Ukraine is not straightforward to say the least. Ukraine, Russia, and Belarus play big roles in grain and oilseed and even bigger and more dangerous roles in fertilizer. The unsettling of geopolitics that the invasion caused and the near impossibility of calculating the follow-on effect of limiting Europe’s energy – not to mention risks resulting from the price and availability of food and energy in some vulnerable developing countries – all contribute to a rare level of uncertainty. Some of these uncertainties might resolve into pleasant surprises and so there might be an unexpected (for bears at least) muddling through to recovery. But on the pessimistic side, many of us might agree that seldom have so many severely negative potentials been out and about. “Polycrisis” may well be the word of the year. Should any one of these factors get out of control it might cause a severe global recession.
One important factor is that the bursting of the global housing bubble, which is only just beginning, is likely to have a more painful economic knock-on effect than the decline in equities is having, for extreme bubble pricing in stocks has been confined to the U.S. only. Other equity markets vary from fair price to normal or moderate overpricing. In real estate, by contrast, even though 2021’s near 20% gain in U.S. house prices – the largest annual gain in the record books – left the house price multiple of family income in the U.S. (now 6x, up from 4.5x in 2011, according to Census Bureau data) above its previous record in 2006 at the height of the housing bubble, that ratio is still way below the 10x to 20x multiples in cities from Vancouver, London, and Paris to Shanghai, Sydney, and Taiwan.
Housing busts seem to take two or three times longer than for equities – from 2006 for example it took 6 years in the U.S. to reach a low – and housing is more directly plugged into the economy than equities through construction starts and associated expenditures. Housing is also much more important for the middle class, whose wealth is often mainly in housing, who use far greater leverage through established, traditional mortgages than they ever do in stocks, and who are these days sitting on large gains resulting from 40 years of falling mortgage rates pushing up housing prices. Many of them see their houses as a major store of value and the bedrock of their retirement plans, and to see that value start to melt away will make them very nervous. (Mortgage costs expand to fit the available affordability. Thus, as interest rates fall you take bigger mortgages because you can and as the mortgages grow in size house prices rise too.) So don’t mess with housing! But we have. And real estate markets that had come to be thought of as impregnable, Australia and Canada for example, have finally started to decline, with Canada down a shocking 13% last year. Other overpriced markets on mainly variable rates are very likely to follow.
The long list of things that have gone wrong – that could interact and cause some component of the system to break under stress (perhaps an unexpected component) – makes for depressing reading. The complexities have multiplied, and the range of outcomes is much greater, perhaps even unprecedented in my experience. That having been said, the odds of a major U.S. market decline from here cannot be as high as they were last year. The pricking of the supreme overconfidence bubble is behind us, and stocks are now cheaper. But because of the sheer length of the list of important negatives, I believe continued economic and financial problems are likely. I believe they could easily turn out to be unexpectedly dire. I believe therefore that a continued market decline of at least substantial proportions, while not the near certainty it was a year ago, is much more likely than not.
My calculations of trendline value of the S&P 500, adjusted upwards for trendline growth and for expected inflation, is about 3200 by the end of 2023. I believe it is likely (3 to 1) to reach that trend and spend at least some time below it this year or next. Not the end of the world but compared to the Goldilocks pattern of the last 20 years, pretty brutal. And several other strategists now have similar numbers. To spell it out, 3200 would be a decline of just 16.7% for 2023 and with 4% inflation assumed for the year would total a 20% real decline for 2023 – or 40% real from the beginning of 2022. A modest overrun past 3200 would take this entire decline to, say, 45% to 50%, a little less bad than the usual decline of 50% or more from previous similarly extreme levels.
But this is just my guess of the most likely outcome. The real risk from here is in the unusually wide range of possibilities around this central point. I would suggest wide and asymmetric error bars around any such forecast. Regrettably there are more downside potentials than upside. In the worst case, if something does break and the world falls into a severe recession, the market could fall a stomach-turning 50% from here. At best there is likely to be at least a further modest decline, which by no means balances the risks. Even the direst case of a 50% decline from here would leave us at just under 2000 on the S&P, or about 37% cheap. To put this in perspective, it would still be a far smaller percent deviation from trendline value than the overpricing we had at the end of 2021 of over 70%. So you shouldn’t be tempted to think it absolutely cannot happen. (For an example of a real nightmare, in 1974 the S&P troughed at below 7 times earnings!)
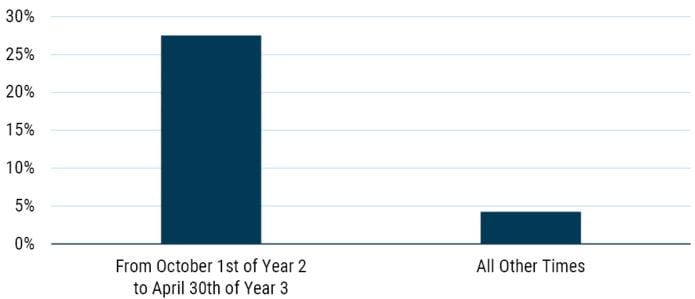
Now for timing. There are some complicating factors that seem quite likely to drag this bear market out. Let’s start with that irritating factor, the Presidential Cycle, so simple sounding that no one in the fee charging business can afford to be associated with it. And that is presumably why it continues to work. The important fact here – see Exhibit 1 – is that for 7 months of the Presidential Cycle, from October 1st of the second year (this cycle, 2022) through April 30th of the third year (2023), the returns, since 1932, equal those of the remaining 41 months of the cycle! This has a less than one-in-a-million probability of occurring by chance, pretty remarkably, and it has been about as powerful in the last 45 years as the previous 45 years. We are now in this sweet spot, which once again is up nicely so far. The logic and nuances are spelled out in Appendix 1. Suffice it to say that this positive influence may help to support the market for a few more months.
Exhibit 1: Presidential Cycle
S&P 500 Annualized Real Total Return, 1932-2022
Source: Global Financial Data, GMO
Other factors suggesting a long or delayed decline include the fact that we start today with a still very strong labor market, inflation apparently beginning to subside, and China hopefully regrouping from a strict lockdown phase that has badly interfered with both their domestic and international business. But the most ancient and effective predictor of future recession, the 10-year minus 3-month yield spread (see Exhibit 2 below), is now clearly signaling recession within the next year. This spread has gone negative only 8 times in the past 50 years and all 8 times have been followed by recessions. To rub it in, there have been no other recessions. That is, every one of them was preceded by a negative reading. Not bad.
Exhibit 2: 10y - 3m U.S. Treasury Yield Curve and NBER Recessions
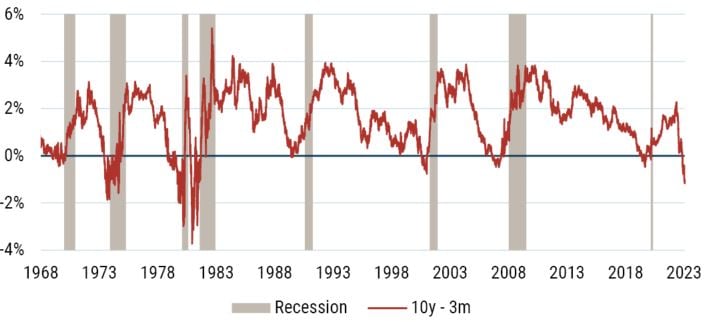
Source: FRED
One important contributor to the resilience of the economy so far has been the enormous accumulation of excess cash that resulted from the Covid-19 stimulus. Different methods of estimating these excess savings give slightly different figures, but most analysts put the peak of excess savings at $2-3 trillion in late 2021. This excess savings balance has been slowly drawn down over the course of 2022, but less than half now remains. Once it runs out, by some estimates around mid-year, this particular support for the economy will be gone. (It is worth noting that this kind of stimulus, which increases cash reserves in individuals’ accounts, has a moderate effect on the economy but a much more immediate effect on stock prices, as we saw. Institutions and hedge funds beat a rapid retreat from markets last year, but individuals by contrast hung tough, bought the dips enthusiastically, and continued to put money into the market. So having the gigantic cash reserves of 2022 run out may well have direct market consequences also.)
The next step is to look at the relationship between recessions and market troughs. You can look at all bear markets, routine to savage, and conclude that the market low has lagged the start of recession by an average of 7 or 8 months. I think though that doing so is to make a classic error. The great psychological bubbles are very different from ordinary bull markets and produce very different results for everything (see Appendix 2). In this case I am only interested in 1929, 1972, 2000, and the 2006 housing bubble. In these cases the market lows took their time. In 1929 it was years after recession started – let’s dismiss this as an extreme case. But even the other three took 11, 15, and 19 months. 3 If we conservatively assume 1 year, and we believe a recession will likely not start for 6 months to a year, you can see how easily we can conclude that the final low for this market might be well into 2024.
Yet another market entrail that has many bulls excited is the potential for a first interest rate cut in the next few months, which is counted on to drive the market upwards. But once again, you should focus only on the four great U.S. bubbles. The fundamentals had so much negative momentum that for three of them (1929, 2000, 2007) the largest part of the market decline occurred after the first rate cut (see Exhibit 3). But to remind all us investors what a tricky world it is, in 1974 the market did turn up, after a horrific 62% real decline in two years, exactly as the first rate cut took place. (That rate cut was delayed by the surge in inflation caused by the infamous oil shock.) Yet despite these mixed results and the painful recent experiences of the 2000 and 2008 bear markets, we continue to hold onto the hope that the first rate cut will be guaranteed to kill the bear. We really are an incredibly optimistic species that these very negative examples, despite being clear and recent, are so easily ignored.
Exhibit 3: Rate Cuts After Great U.S. Bubbles
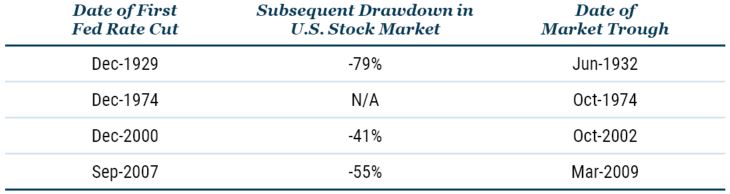
Source: Global Financial Data, Federal Reserve
About now I should confess that I am rather rattled as a contrarian by the enormous increase in pessimism and realism since my letters of a year ago and two years ago, with influential firms like Morgan Stanley and Goldman Sachs pointing to recession and lower earnings that do not yet seem to be in the price of stocks. Equally disturbing, it is said to be one of the most widely predicted recessions ever. It is all enough to make a god-fearing contrarian wake up in the night sweating. I do take consolation from earnings estimates that remain wonderfully unaffected by all the possible negatives, but still I’d prefer a lot more optimism, which a year ago was nearly universal.
The January Rally
The recent rally brings up another embarrassingly simple factor, the January effect. January features relative strength in characteristics beloved of individuals. Institutions love large capitalization and quality, and these characteristics provably outperform their beta for the remaining 11 months. But historically individuals prefer small caps, stocks that are obviously cheap, and confusingly, stocks that got hammered the year before. The latter presumably because they have just finished tax loss selling and have that money in hand – plus any year-end bonuses and distributions. Additionally, this year they still have the balance of the stimulus money. (And anecdotally at least, quite a few institutional players are distracted over the holiday season.) So you might have guessed that the bounce in the previous year’s speculative losers might be powerful this year.
I read about the recent 20% rally in Bitcoin and friends, which was allegedly for exotic reasons. More likely to me this is merely crypto’s usual style of behaving like the most speculative stocks, almost all of which had a terrible 2022. (If you want an extremely speculative example, take my loved and hated Quantumscape. It was about the first of the superspecs to peak, in December 2020, having previously just gone from $10 to $132 in 3 months, worth over $50 billion with no sales but brilliant research. It then declined to last year’s low in December of $5.10, down 96%! But on January 13th it closed at $8.30, up 62% from the low.) This type of rally after a bloodbath is not unusual and may very well not outlive January. But it is yet one more factor that may help postpone the market lows for a while.
The Real Nightmare: Longer-Term Negatives Start to Impact
My job description at GMO for the last decade or so is long-term underrated problems. This has proved a fertile field and I must admit a very interesting one. It led me to fuss about longer-term climate impacts over 15 years ago – to considerable eyerolling. It also helped us scoop the competition, starting in 2008, that we were beginning to run out of many important resources. Then after 2009 we picked up the slowing growth rate of workforces in developed countries and China, many of which went on to outright decline. The collective effect of resource and labor shortages was to reduce long-term economic growth, which I suggested in 2009 was likely to be about 1.5% in the U.S. and 1% in Europe rather than the 3% plus then assumed for the U.S. by the establishment. 4 I also got to introduce the idea of toxicity severely reducing our planet’s suitability to life in every form including ours. All of these factors seemed important but not yet critical, certainly not for the general business community. They were things for investors to really worry about in, say, 10 years or so. Well, time passed, climate issues deteriorated at a disturbingly fast pace, and the population bust got worse.
Now it seems climate damage is on every front page, as droughts, floods, and hurricanes make agriculture more difficult, driving up food prices and seemingly causing weekly billion-dollar weather events. Quite suddenly the long-term issues have become immediate issues that require policy and economic responses. These responses in turn have rapidly made it clear that we do not remotely have the resources to green the global economy with current technology. The reserves of lithium (the price of which rose over 75% last year), copper, cobalt, and nickel for example are totally inadequate and are not being developed in sufficient scale – in fact resource capex has been dropping for years. Projected labor shortages have gone from little noticed academic articles to regular opinion pieces and just in the last year even the rapid and nearly global drop in fertility, which was totally ignored, has started to make the more enlightened press on a regular basis. This gloomy list will be examined in more detail in a follow-up paper.
Regrettably for investors, these factors interrelate with our more obvious problems – Ukraine and Covid – and with each other. Bottlenecks and shortages have become recurring and on average steadily more severe. As one is temporarily overcome and prices crash, others spring up. Most of these factors have one thing in common: they work to push prices up, which brings the whole messy set of shifting relationships right into the middle of typical short-term market concerns. They make it unlikely that inflation will revert to the non-issue of the 2000 to 2020 era. Periodic shortages and bottlenecks of everything obviously push up prices and drive down output. Above all they need enlightened planning, which in an era of deteriorating democracy and geopolitics is at a premium. These are the forces that make the tail of the economic, financial, and market distribution so scary. For the market to be able to muddle through the closing stages of this bubble’s bursting without severe damage will require some luck for investors and some wisdom from policymakers.
PS – Investing in a Particularly Tricky World
Despite the generally unattractive nature of the U.S. equity market and the extremely tricky global economy, there are still a surprising number of reasonable investment opportunities even if they are not sensational. Exhibit 4 is GMO’s 7-Year Asset Class Forecast. It shows that emerging markets are reasonably priced and the value sector of emerging is cheap. Admittedly they came into this broad decline a year ago much cheaper than the U.S. yet have gone down similarly. This is disappointing but quite typical. The first phase of a bear market typically is a broad markdown with only generalizations used for differentiation. Subtleties of relative value are left for later. My favorite example was 2002, the third year of the great tech bust, in which the S&P 500 was down 22% and the highest beta, but much cheaper, emerging equities were down only 2%!
Exhibit 4: GMO 7-Year Asset Class Forecasts*
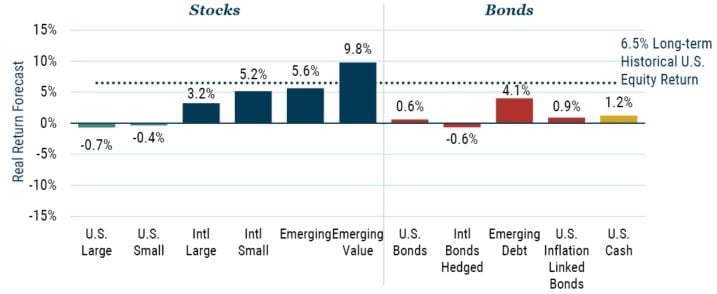
As of December 31, 2022
*The chart represents local, real return forecasts for several asset classes and not for any GMO fund or strategy. These forecasts are forward-looking statements based upon the reasonable beliefs of GMO and are not a guarantee of future performance. Forward-looking statements speak only as of the date they are made, and GMO assumes no duty to and does not undertake to update forward-looking statements. Forward-looking statements are subject to numerous assumptions, risks, and uncertainties, which change over time. Actual results may differ materially from those anticipated in forward-looking statements. U.S. inflation is assumed to mean revert to long-term inflation of 2.3% over 15 years.
Also still attractive is the spread between value and growth equities in the U.S., despite a strong last 18 months for value, as shown in Exhibit 5. Unusually, last year the third quartile of value – those moderately cheaper than the market – did extremely well and are now unattractive. Conversely, “deep” value, having done less well, is still very attractive on a relative basis. To capture this opportunity, GMO has a strategy called Equity Dislocation, which goes long the very cheapest U.S. stocks and short an equal amount of the most overpriced, and which delivered a respectable double-digit positive return last year.
Exhibit 5: value is still very Cheap
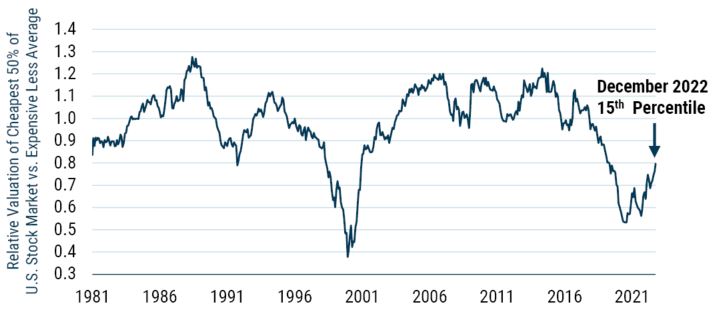
As of 12/31/2022 | Source: GMO
Composite valuation measure is composed of Price/Sales, Prices/Gross Profit, Price/Book, and Price/Economic Book.
For those with a longer horizon than average, say 5 years and above, I believe stocks related to addressing the problems of climate change and the increasing pressure on many raw materials have a substantial advantage over the rest of the economy as the world’s governments and corporations begin to accept the urgency of these problems, like the U.S. government did so emphatically with the Inflation Reduction Act. GMO, not surprisingly given my decade-long persistent emphasis on these areas, has two strategies, Climate Change and Resources, which have very sound 5- and 10-year records, respectively.
Appendix 1
The Presidential Cycle
Politicians have always liked to be re-elected. Decades ago, they worked out what factor moves the vote the most. It is provably the state of the labor market in the 6-month run up to the election. Even brilliant performances before that do not count; they are apparently lost in the mists of time. Administrations aim to achieve precisely this objective, and to do so they must stimulate the economy 12 to 18 months earlier because the economy is large and complicated and has plenty of inertia. So, on or around the 4th quarter of year 2 – this cycle, 2022 – they start some extra stimulus. I say “extra” because there are always other considerations at work. The interesting part for U.S. investors is that the stock market is far more sensitive to this extra stimulus than the economy and employment are (as we saw with the Covid stimulus in 2020 and 2021). Thus, to get a modest, but politically important, twitch in labor numbers, we see for the stock market the remarkable data shown earlier, in which since 1932 the 7-month stimulus window delivers six times the monthly returns of the rest of the cycle. My favorite aspect of this effect though was that the UK market had, from 1932 through 2012 when I last looked, a bigger jump on the U.S. presidential cycle than even the U.S. had! (Europe had half the effect and even Japan had half of that.) The U.S. administration, with 85 years of help from a “completely independent” (ahem) Fed, clearly rules the global waves. There are no prizes for guessing which was the only Fed era where this political market cycle absolutely did not exist – Paul Volcker’s.
Appendix 2
Tyler Cowen and The Paucity of Data Points
Tyler Cowen, the well-known economist, asked me a series of difficult questions in a recent podcast, 5 one of which highlighted the small number of previous data points on superbubbles. I answered that I was always very impressed by the unique nature of 1929, 2000, and even 1972 and by their important and painful outcomes, and that three examples in the U.S., plus the housing bubble, plus the mother of all bubbles in Japan with 1989 peaks in both land and stocks seemed to me a considerable and sufficient body of data to form a reasonably confident opinion. In fact, with even fewer examples it had given us at GMO the confidence to completely exit the Japanese market in the late 1980s and most of our U.S. growth stocks in 1998-99 as those bubbles formed. We also took extreme risk-reducing measures for the housing bubble in 2007. So today we have obviously more data points and richer experience than we did before those three prior events. However, I grant the point that the fewer the data points the more significant the data had better be. Sometimes the data is so good that a single data point will suffice. If a large meteorite approached of the scale that cost the Earth some 80% of all its life about 60 million years ago, I doubt even economists would belittle it on the grounds of being one lousy data point! “Ah,” you will say, with some justification, “that is based on science, and the laws of physics do not change, even if our understanding of them does.” But I would reply that we have six classic, gigantic bubbles now, excluding our current, very worthy number seven, and human nature, on which they are based, presumably does not change either. 6 In fact it has probably changed less than our understanding of the laws of physics. Our intellectual fallback, in any case, has always been value and the inescapable truth that if you triple the price of an asset, you will divide its future returns by three, and that fact alone may be enough to guarantee the miserable outcomes from those historic and dizzying market heights. It also provides sufficient data for investors to try to sidestep some of the pain. At least for me it does.
Download article here.
The inflation adjustment is important. Back in the 70s and 80s we were all expected to adjust everything. After all, it is just as much a loss of your real asset value. I have been surprised that as inflation jumped to 8% in the U.S. and 10% in Europe, market declines were still typically discussed in unadjusted terms. We were, I guess, just out of practice.
Even Ben Bernanke himself, similarly carried away apparently, said at the top of the U.S.’s then one and only housing bubble – a stunning 3-sigma, 1-in-100 year event, based on price to family income – that “the U.S. housing market has never declined,” meaning, of course, that it never would. How he and his troupe of economists could miss the sheer extravagance of a 3-sigma event remains one of the great mysteries of my career and suggests some very odd features about the style of the Fed, for whom, in my experience, all major events are “unexpected.”
1973: 11 months. 2000: 19 months. 2007: 15 months
Institutions such as the OECD, IMF, and World Bank
This is counting the Japanese stock and real estate bubbles that peaked in 1989 as two separate bubbles – they are the only case in history of fully fledged stock and real estate bubbles coinciding.
Disclaimer: The views expressed are the views of Jeremy Grantham through the period ending January 24, 2023, and are subject to change at any time based on market and other conditions. This is not an offer or solicitation for the purchase or sale of any security and should not be construed as such. References to specific securities and issuers are for illustrative purposes only and are not intended to be, and should not be interpreted as, recommendations to purchase or sell such securities.
Copyright © 2023 by GMO LLC. All rights reserved.
The inflation adjustment is important. Back in the 70s and 80s we were all expected to adjust everything. After all, it is just as much a loss of your real asset value. I have been surprised that as inflation jumped to 8% in the U.S. and 10% in Europe, market declines were still typically discussed in unadjusted terms. We were, I guess, just out of practice.
Even Ben Bernanke himself, similarly carried away apparently, said at the top of the U.S.’s then one and only housing bubble – a stunning 3-sigma, 1-in-100 year event, based on price to family income – that “the U.S. housing market has never declined,” meaning, of course, that it never would. How he and his troupe of economists could miss the sheer extravagance of a 3-sigma event remains one of the great mysteries of my career and suggests some very odd features about the style of the Fed, for whom, in my experience, all major events are “unexpected.”
1973: 11 months. 2000: 19 months. 2007: 15 months
Institutions such as the OECD, IMF, and World Bank
This is counting the Japanese stock and real estate bubbles that peaked in 1989 as two separate bubbles – they are the only case in history of fully fledged stock and real estate bubbles coinciding.