Introduction to the 3Q 2021 Quarterly Letter
By Ben Inker
This quarterly is a piece written by my Asset Allocation co-head John Thorndike. In it, he explains the rationale behind our strong preference for non-U.S. stocks despite the stellar performance the U.S. stock market has delivered over the last decade. The research behind the piece is an example of the bread and butter of our historical asset allocation analysis. In this short companion piece I wanted to explain a bit why we are so enamored of this type of analysis, which examines not just historical returns, but the underlying components of those returns.
Historical analysis of markets is crucial for trying to understand future potential returns. The trouble is that a standard way of doing this type of analysis – calculating average returns for an asset over time – can be extremely misleading. It is tempting to assume that over a long enough period of time historical returns are representative of what returns can be expected going forward, but that may not be the case. We believe It is only by taking the further step of delving into the components of that return that it is possible to come up with a reasonable estimate of what returns might be expected going forward. This is probably easiest to see in bonds, so in this piece I will show how a historical view of bond returns can give a grossly misleading impression of what investors might expect going forward. Exhibit 1 shows the rolling 10-year returns to the U.S. 10-Year Treasury Note.
Exhibit 1: 10-Year Trailing Return to Treasury Note
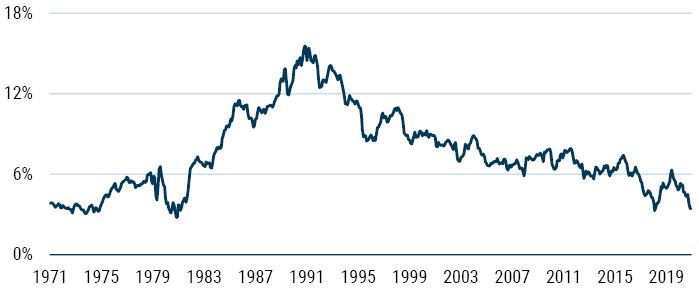
Data from 1961-2021; 10-Year returns start in 1971 | Source: Federal Reserve, GMO
The average decade gave you a return of around 7.6% with a standard deviation of 2.9%. The last decade has seen just about the lowest return over the period, at 3.4%, and judging only from this exhibit one might be tempted to say the odds are the next decade will be better – after all, 99% of all the historical 10-year periods in the last 60 years gave a higher return. Is a 7.6% return a fair expectation for future returns from 10-Year Treasuries? Would 3.4% be a conservative forecast? By analyzing the sources of returns we can get a better idea of why the first forecast would be absurd and even the second is almost certainly unrealistically optimistic. Exhibit 2 shows the drivers of return for 10-Year Treasuries since 1961.
Exhibit 2: U.S. 10-Year Bond Return 1961-2021
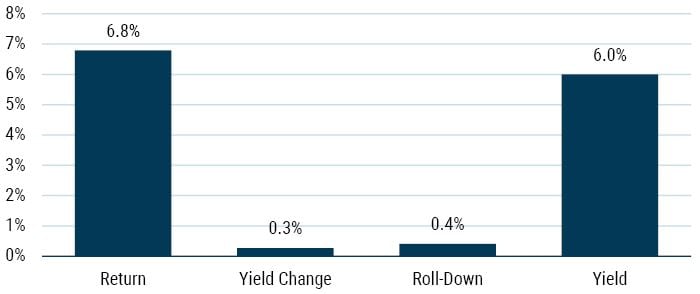
Data from 1961-2021 | Source: Federal Reserve, GMO
Yield change has been a positive piece of returns over this period, but it would be unwise to assume this will continue to be the case simply because it has been true on average historically. The rather large elephant in the room here is the yield component, which has averaged 6.0% over the last 60 years, whereas a 10-Year Treasury Note today yields less than 1.6%. A simple forecast methodology inspired by this component of return breakdown would be the current yield plus average roll-down, or 2%.1 As Exhibit 3 shows, this simple forecast methodology would have explained 71% of the historical variation of bond returns over the subsequent decade, and today’s forecast is lower than any realized 10-year return in this dataset.
Exhibit 3: 10-Year Trailing Return to Treasury Note against Simple Forecast
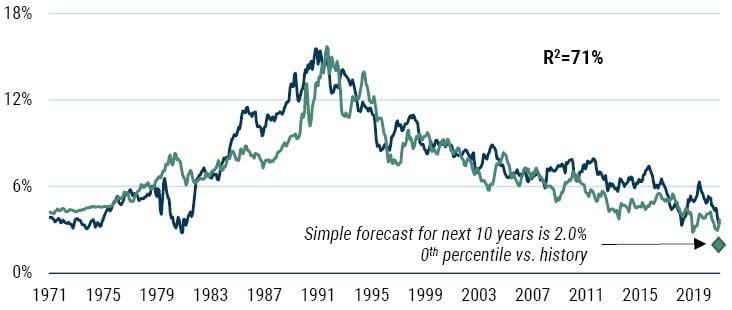
Data from 1961-2021; 10-Year returns start in 1971 | Source: Federal Reserve, GMO
It’s worth pointing out that this lowest-ever forecast for bonds does not require any assumption of mean reversion in valuations. It is no secret we tend to build in an assumption of mean reversion in the medium term to our asset class forecasts. History suggests that valuations are generally mean-reverting over time, but valuations are a crucial driver of future expected returns for assets even if valuations do not mean revert. Investors would be wise to keep that in mind because bonds are by no means the only asset today where valuations are far higher than their history, from which, of course, most long-term return assumptions are drawn.
I will admit that the same fact that makes the bond example so instructive also makes the components of the return result less surprising. Bond math is inexorable enough that the current bond yield tells us most of what we need to know, and few investors base their bond forecasts on the simple historical return analysis that I’m suggesting would be so misleading. But investors do often use just this type of analysis both in the case of more complex asset classes such as equities or commodities and for multi-asset strategies such as 60/40 or risk parity. When applied in those cases, this analysis has, of course, the same flaws.2 Analyzing the components of return and estimating them going forward is certainly more complex than simply looking uncritically at historical returns. But as John’s piece will show, it is every bit as important to analyze the drivers in those more complicated cases instead of assuming the raw returns are telling us what we need to know.
Winners, Losers, and the Case for Owning Each
by John Thorndike
Executive Summary
We reiterate our preference for non-U.S. equity markets based on an analysis that shows that U.S. fundamental performance has been ordinary in the context of history and insufficient to justify the market’s extraordinary valuation return.
- Equity market performance can be decomposed into changes in valuations and a “fundamental return” that comprises growth and reinvestment of income.
- U.S. equity market performance led the world for the 10 years ending September 30, 2021, which has left the U.S. market trading at a significant valuation premium relative to non-U.S. stocks.
- Many investors believe that the U.S.’s greater fundamental performance justifies the market’s much higher valuations. Over the past 10 years, U.S. companies delivered fundamental performance 45% higher than the rest of the world, impressive indeed. Over the same period, the U.S. stock market valuation multiples rose more than 85% faster than the rest of the world – far outpacing their fundamental upside.
- Japanese companies delivered better fundamental performance than U.S. companies over the last decade, yet Japan trades at two-thirds of the valuation multiple of the U.S. market.
- Fundamental performance in European and Emerging Markets was disappointing; however, history suggests that fundamental performance tends to revert to trend, so we can reasonably expect better fundamental returns over the next decade.
- In our view, the much lower starting valuations of non-U.S. markets will provide a tailwind for future returns.
- We continue to believe equity investors will be rewarded for allocating as much of their equity exposure to non-U.S. markets as their risk tolerance allows.
Introduction
GMO’s Asset Allocation portfolios express three strongly held views: 1) value stocks globally are cheap relative to growth; 2) non-U.S. equity markets are cheap relative to the U.S.; and 3) traditional fixed income yielding less than inflation offers little benefit to portfolios. Recently, we’ve written extensively about the relative value opportunity for owning value stocks.1 This quarter, we turn to our preference for owning stocks in non-U.S. markets. We look at the winners and losers of the last 10 years by analyzing both the returns of equity markets and the fundamentals of the companies that comprise them. No one reading this quarterly will be surprised to see the U.S. equity market as the leading performer over the last decade, but some may be surprised to learn that Japanese companies delivered the best fundamental performance over that same period. We wrap up by considering the potential for last decade’s laggards to produce a better showing in the decade to come. Readers will see that non-U.S. markets are home to both winners and losers from the last 10 years while offering starting valuations that should position these markets to outperform the U.S. in the decade to come.
U.S. Exceptionalism has been Driven by Multiple Expansion
No review of equity market performance over the last decade can start without acknowledging just how strong performance has been for U.S. stocks. During the 10-year period from September 2011 to September 2021, the MSCI U.S. index grew at a 16% annualized pace, generating gains of nearly three and a half times capital. Over the same period, non-U.S. stocks, as measured by the MSCI All Country World ex-U.S. index, grew at less than half that pace (an otherwise respectable 7.5% annualized return) and delivered less than one-third of the gains of the U.S. market (see Exhibit 1).
Exhibit 1: The u.s. has had an extraordinary decade
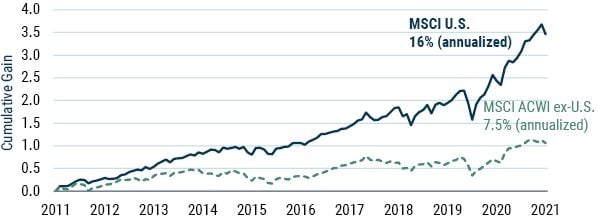
As of 9/30/2021 | Source: MSCI, GMO analysis
Not only did the U.S. market simply trounce the rest of the world, its gains over this period also stand in stark contrast to its own performance during the preceding 10 years, especially when measured in real terms, that is after subtracting the rates of inflation during each time period.2 From September 2011 to September 2021, the MSCI U.S. index outpaced inflation by 14.6% a year, whereas from September 2001 to September 2011, the same index gained only 0.5% a year. In other words, the U.S. exceptionalism of the last decade followed a lost decade for U.S. stocks.
To understand what drove this decade-over-decade difference in U.S. equity market returns, we can decompose the stock market’s performance into two components: the index’s fundamental return and its change in valuations. Changes in valuations are observable, and their contribution to performance is straightforward to calculate. While many investors will look at the price-earnings ratio, we prefer to use a composite valuation metric that compares price to standard accounting values (sales, gross profits, and book value), smoothed earnings (a 10-year, inflation-adjusted average), and our proprietary measure of book value.3 The fundamental return is calculated as a residual: it’s the index total return after accounting for changes in valuations.
One can think of the fundamental return as the return generated by the companies in the index. It comes from two sources: First, there’s growth from the reinvestment of retained earnings. Second, there’s concentration of ownership that occurs when investors reinvest dividends or the company buys back stock. These two factors – growth and reinvestment of income – are the long-term drivers of equity market performance.
As Exhibit 2 shows, the difference between the U.S. market experiencing a lost decade from September 2001 to September 2011 and an exceptional decade over the subsequent 10 years is almost entirely attributable to changes in valuations. During the earlier period, valuation declines of 3.9% a year nearly negated the 4.4% fundamental return that companies delivered during that time. In the more recent period, fundamental performance was slightly better at 4.8% annualized, while valuations gained 9.8% a year. So, of the 14.1% improvement in annualized returns delivered by the U.S. market in the most recent decade relative to the decade before, 13.7% came from changes in valuations and only 0.4% came from changes in the returns delivered by the companies comprising the index.
Exhibit 2: u.s. fundamental performance has not been exceptional
Changes in multiples can be the difference between exceptional and lost decades
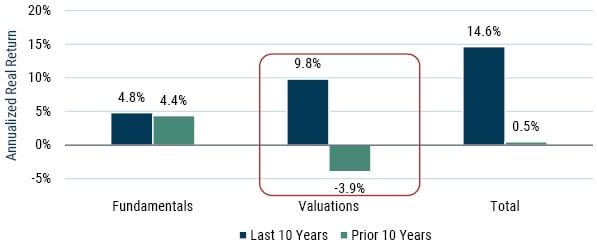
Source: MSCI U.S. index, GMO analysis
Fundamentals are an average of sales, gross profits, smoothed earnings, and GMO’s Economic Book Value.
Multiple expansion of nearly 10% a year for 10 years resulted in valuations more than doubling. For example, the index increased from a multiple of 17x 10-year average real earnings on September 30, 2011 to 37x on September 30, 2021. Why is the market now willing to pay such higher multiples for U.S. companies when the companies themselves look to be delivering fundamental returns that are more or less the same as they delivered in the prior decade? Lower interest rates are a natural culprit, although if low interest rates were the sole driver of high equity market valuations, one would expect to see much higher valuations in Europe and Japan. The argument for high U.S. valuations tends to come down to a belief that American companies are special – the only winners in a world of losers.
Japan’s Fundamental Performance Outpaced the U.S.
Just how special was the 4.8% fundamental return generated by U.S. companies over the last 10 years? The answer depends on how the result is framed. For example, our team uses a range of 4.5% to 5.7% real as its estimate of expected equilibrium equity returns.4 From this vantage point, recent U.S. fundamental performance hasn’t been special at all; it has been perfectly normal. However, when compared to fundamental performance from non-U.S. companies over the same period of only 3.3%, the U.S. result looks quite good indeed (see Exhibit 3). In the context of negative real yields on high-quality fixed income and sub-normal performance from overseas competitors, one can understand why investors would be tempted to apply a premium valuation to U.S. companies that continued to deliver historically normal fundamental results.
Exhibit 3: U.S. Fundamental Performance Has Been rather normal
Non-U.S. companies have generated sub-par fundamental returns
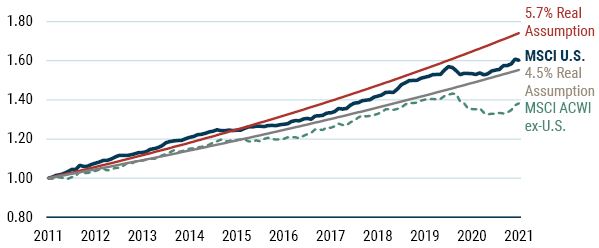
Source: MSCI, GMO analysis
Fundamentals are an average of sales, gross profits, smoothed earnings, book value, and GMO’s Economic Book Value.
When we disaggregate the rest of the world into regions, however, the argument that the market is rationally paying up for the sole source of normal fundamental performance becomes challenged. Corporate performance across the Emerging Markets (EM) and MSCI’s EAFE ex-Japan index (mostly comprising European companies) has averaged 3% a year for the last 10 years. Over the same period, however, fundamental performance in Japan has been 5.4% annually. Not only has Japan produced what we would consider to be normal fundamental performance over this period, Japanese companies have outperformed American companies (see Exhibit 4).
Exhibit 4: Fundamental Performance By Region
Emerging Markets and Europe have disappointed, but Japan outperformed the U.S.
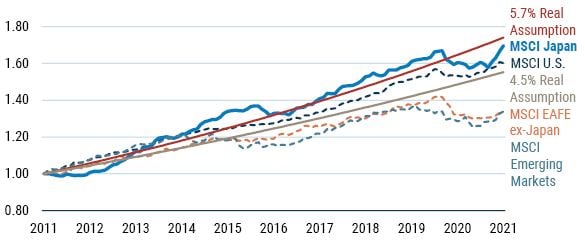
Source: MSCI, GMO analysis
Fundamentals are an average of sales, gross profits, smoothed earnings, book value, and GMO’s Economic Book Value.
If investors are rewarding fundamental winners with high valuations, has Japan seen the same multiple expansion that we’ve seen in the U.S.? No. And that’s not because Japan started at a particularly high multiple 10 years ago: both Japan and the U.S. traded at around 17x cyclically adjusted earnings in September 2011. The difference comes from current valuations. Japan today trades at about two-thirds the valuation of the U.S. market despite Japanese companies delivering best in class fundamental returns over the prior decade (see Exhibit 5).
Exhibit 5: The Price of Normalcy
Japan has delivered U.S.-like fundamental performance, but trades at a significant discount
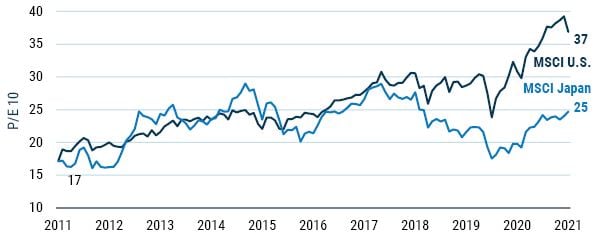
Source: MSCI, GMO analysis
Why hasn’t Japan re-rated along with the U.S. over the past few years? We suspect the answer has something to do with what Robert Shiller refers to as Narrative Economics. Shiller argues that the stories investors tell themselves influence market pricing and behavior. Think of the narratives that come to mind when considering Japan’s economy and corporate sector. Lost decades. Bloated balance sheets. Poor profitability. Stakeholder, not shareholder, capitalism. Who wants to rocket-ship that market to the moon? No one. It’s easier to create a narrative that the recently strong Japanese fundamental performance was just a fluke than it is to consider that perhaps Japanese companies have quietly performed quite well for longer than one might have realized.
Contrary to popular narratives, Japanese fundamentals have been on par with the U.S. – and consistent with our estimates of equilibrium – for most of the last 20 years. Exhibit 6 plots fundamental performance for Japan and the U.S. over rolling 10-year periods from January 1990 to September 2021. The first data point, marked 2000 on the chart, shows that Japanese companies didn’t deliver any fundamental gains in the 1990s. Periods such as 1994-2004 saw Japanese companies destroy fundamental value. By mid-2006, however, corporate Japan was back to breakeven on a 10-year basis, and it hasn’t looked back.5 Indeed, since September 2011, Japan’s 10-year fundamental performance has been better than the U.S. in just over half of our monthly measurements and above our lower bound for normal (4.5% real) two-thirds of the time. It seems Japan’s “lost decades” ended decades ago.
Exhibit 6: Japan has already changed
Lost decades ended decades ago
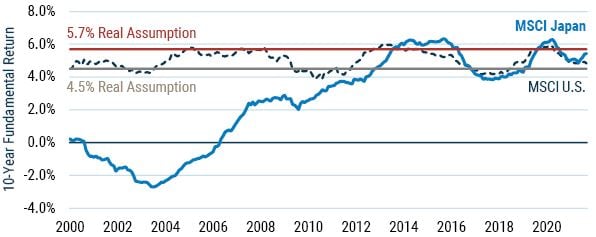
Source: MSCI, GMO analysis
Fundamentals are an average of sales, gross profits, smoothed earnings, book value, and GMO’s Economic Book Value.
It’s as easy to conjure up a story of U.S. exceptionalism as it is to assume Japanese malaise. The U.S. market, after all, includes some truly amazing businesses. For example, Apple, Amazon, Microsoft, Google, and Facebook (the “Big Five”) generated annualized fundamental performance of 16.3% over the last 10 years. Companies that can reinvest capital at high rates for long periods of time deserve to trade at higher multiples, and many investors seem to assume that the strong growth of these dominant companies justifies the premium multiple applied to the U.S. market. The problem with that narrative is not that these five companies don’t deserve their valuations.6 The problem is that when you look at the U.S. market excluding these five names, its fundamental return was only 4.2% annualized over the last decade. That’s less than what we consider normal and, coincidentally, halfway between the superior performance of Japan and the disappointing results from EAFE ex-Japan and EM. Yet, the U.S. market excluding the Big Five still traded at a 32.5x CAPE at the end of September, a 30% premium to Japan. Outside of the Big Five, U.S. equity market investors are paying exceptional prices for quite dull fundamental performance.
While narratives can matter in the short term, valuations and fundamentals will matter for the long term. For investors who want to invest in companies that have generated attractive fundamental performance over the last decade, both the U.S. and Japan fit the bill. For investors who care about the price they pay for such fundamentals, Japan appears to offer a clear advantage.
Europe and EM Are Poised to Benefit from Mean Reversion
What should we make of the lackluster fundamental performance over the last 10 years from companies in EAFE ex-Japan and EM regions? Do their stocks deserve a place in investors’ portfolios? We think so.
History suggests that regions and countries experience mean reversion in their fundamental performance. Economic intuition suggests the same, as competitive capitalism should cause capital to flee areas of low return (thereby improving the prospects for the capital that remains) and seek out areas of high return (thereby dampening the prospects for all). Unfortunately, our ability to look for mean reversion of regional fundamentals from decade to decade is limited by data availability, especially in EM.7 To relax this constraint, we turned to the data for individual countries to see what we could learn. Regressing fundamental returns in one decade against fundamental returns in the prior decade for 37 countries with data spanning from the 1970s to the 2010s, we found a negative relationship (see Exhibit 7). That is, the lower a country’s fundamental performance was in one decade, the higher it tended to be in the subsequent decade. This isn’t the strongest relationship one may ever see,8 but if it holds, one might expect these regions to deliver fundamental performance over the coming decade that’s consistent with our equilibrium assumptions.
Exhibit 7: Mean Reversion at Work
Fundamentals have been negatively correlated decade-over-decade
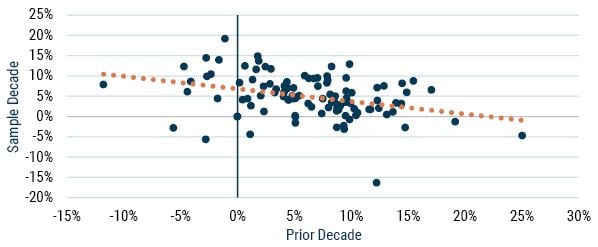
Source: MSCI, GMO analysis
37 countries; 1970s–2010s
Fundamentals are an average of sales, gross profits, smoothed earnings, book value, and GMO’s Economic Book Value.
While it’s no guarantee that the companies in these regions will be the fundamental winners of the 2020s, what is clear to us is that their current valuations are the lowest across regions as we look at markets today. And lower valuations provide better starting points for long-term performance, in part because shareholders reinvest cash flows at higher yields. Today, EAFE-ex Japan markets are priced at a 40% discount to the U.S. market, and EM trade at less than half the CAPE of the U.S. (see Exhibit 8). With reasonable prospects for improving fundamentals and the most attractive starting valuations, we think investors will reap rewards from owning the laggards of the last 10 years.
Exhibit 8: U.S. stocks trade at a significant premium
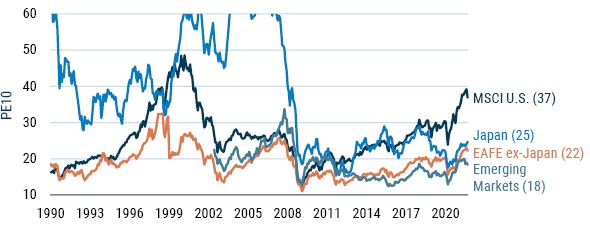
Source: MSCI, GMO analysis
Vertical axis truncated at 60; Japan’s P/E 10 peaked at over 76x in January 2006.
Non-U.S. Equity Markets Offer Multiple Ways to Win
While the U.S. stock market has been far and away the leading equity market over the past decade, U.S. companies played second fiddle to Japanese companies when it came to generating fundamental returns over the period. Fundamental returns, which come in the form of growth from retained earnings and increased ownership from the reinvestment of shareholder distributions, represent the long-term drivers of equity market performance. On this metric, Japan and the U.S. have performed quite similarly not just over the last 10 years, but also the 10 years prior. The same cannot be said for companies in EAFE ex-Japan and EM, where fundamentals over the last decade were disappointing. History and economic intuition suggest, however, that improved fundamental performance over the next 10 years is not just possible for these regions, but probable. On the other metric that matters for equity market performance – changes in valuation multiples – the U.S. stands out. Multiple expansion has accrued to the benefit of U.S. shareholders over the last 10 years, leaving developed non-U.S. companies trading around two-thirds of the valuation of the U.S. and EM at less than half the price. With Japan looking capable of sustaining its fundamental performance and the rest of the non-U.S. world poised for improvement, and with non-U.S. markets much more attractively priced than U.S. stocks, we continue to believe equity investors will be rewarded for allocating as much of their equity exposure to non-U.S. markets as their risk tolerance allows. We are.9
Exhibit 9: Global All Country Equity Allocation Strategy
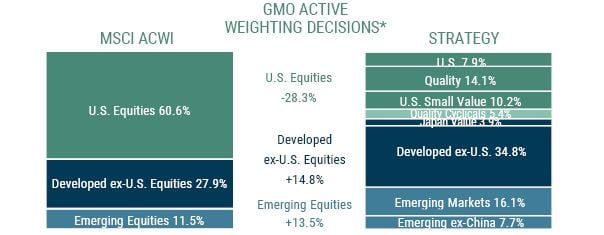
As of 10/31/2021 | Source: GMO
*Active weighting decisions are based on security level holdings and are subject to change without notice. The information is based on a representative account in the Strategy selected because it has the fewest restrictions and best represents the implementation of the Strategy. The groups indicated represent exposures determined pursuant to proprietary methodologies and are subject to change over time. Quality is predominantly U.S. but does hold some Developed ex-U.S. and Emerging. Totals may not add due to rounding. Cash is excluded for purposes of benchmark comparison. MSCI data may not be reproduced or used for any other purpose. MSCI provides no warranties, has not prepared or approved this report, and has no liability hereunder.
Download article here.
Footnotes for - Introduction to the 3Q 2021 Quarterly Letter
1 Roll-down is the return (which can be positive or negative, although it has usually been positive historically) that a bondholder achieves due to the fact that a bond that is held for a period of time is definitionally a shorter maturity bond when it is sold than it was when it was bought. If a 10-Year Treasury yields 1.6% and a 9-Year Treasury yields 1.55% and yields don’t move over the course of the next year, the return for a bondholder who bought the 10-Year at the start of the period will be the yield on the bond (1.6%) plus a capital gain associated with the now 9-Year bond selling at a lower yield – an approximate additional 0.4% capital gain in my example.
2 For those of you who think you do not rely on such simple analysis, remember that any time you are doing a historical simulation of a strategy and taking comfort in the result, that is exactly what you are doing.
Footnotes for - Winners, Losers, and the Case for Owning Each