
Listen to this White Paper
Executive Summary
Benchmark-Free has been a flagship strategy for half of GMO's history. As we approach our 50th anniversary in 2027, Ben Inker reflects on our first 25 years of Benchmark-Free investing:
-
At the height of the tech bubble, GMO proposed a solution to the benchmark-hugging that results from the investment industry’s inherent agency problems. By building a portfolio focused purely on absolute risk and return, we believed we could deliver returns at least as good as those of a traditional portfolio, with less risk of absolute loss.
-
After 25 years, despite some fairly harrowing periods of underperformance relative to traditional benchmarks, the Benchmark-Free strategy has delivered, achieving a cumulative return significantly higher than a traditional 60/40 portfolio along with substantially smaller absolute drawdowns.
-
We have gotten some things very right (e.g., avoiding significant pain in the worst two drawdown events of the last quarter century) and a few quite wrong (e.g., failing to anticipate a significant improvement in the trend profitability of the largest U.S. companies over the past 15 years).
-
Today offers an eerie parallel to 1999, making Benchmark-Free investing essential for navigating the next decade. You don’t need to take crazy amounts of risk to make decent returns going forward. But you may need to be willing to look different and shift your portfolio toward assets that aren’t nearly as sexy and trendy as the latest hot IPO.
Introduction
Twenty-five years ago, a client placed extraordinary trust in us, giving us the opportunity to launch a strategy unlike any we had managed before. In some ways, this was merely another example of clients taking a leap of faith with GMO; our international equity, fixed income, and quantitative investing efforts had once required similar confidence, as had our initial foray into asset allocation portfolios in the late 1980s and growth stock portfolios shortly thereafter. But this strategy felt different. It was not simply a matter of managing a portfolio to a different benchmark—it meant tossing aside the concept of an investable benchmark altogether. It also allowed us to manage a client portfolio the way we managed our own—an approach Jeremy Grantham has referred to as “my sister’s pension fund” investing. 1
Institutional asset management is plagued by agency problems that, in turn, have created whole categories of businesses such as index providers and investment consultants. As a result, investment managers are often pushed to “manage to the test,” building portfolios that reflect a tradeoff between the securities they actually like and those they feel obligated to own to avoid deviating from a benchmark or peer group. There is nothing inherently wrong with managing to a test when that test is a reasonable proxy for the problem the investor is truly trying to solve. But for multi-asset portfolios meant to represent an investor’s overall portfolio, the “test” had taken on a life of its own, forcing investors to make decisions that no longer served the portfolio’s ultimate purpose.
The Origins of Benchmark-Free
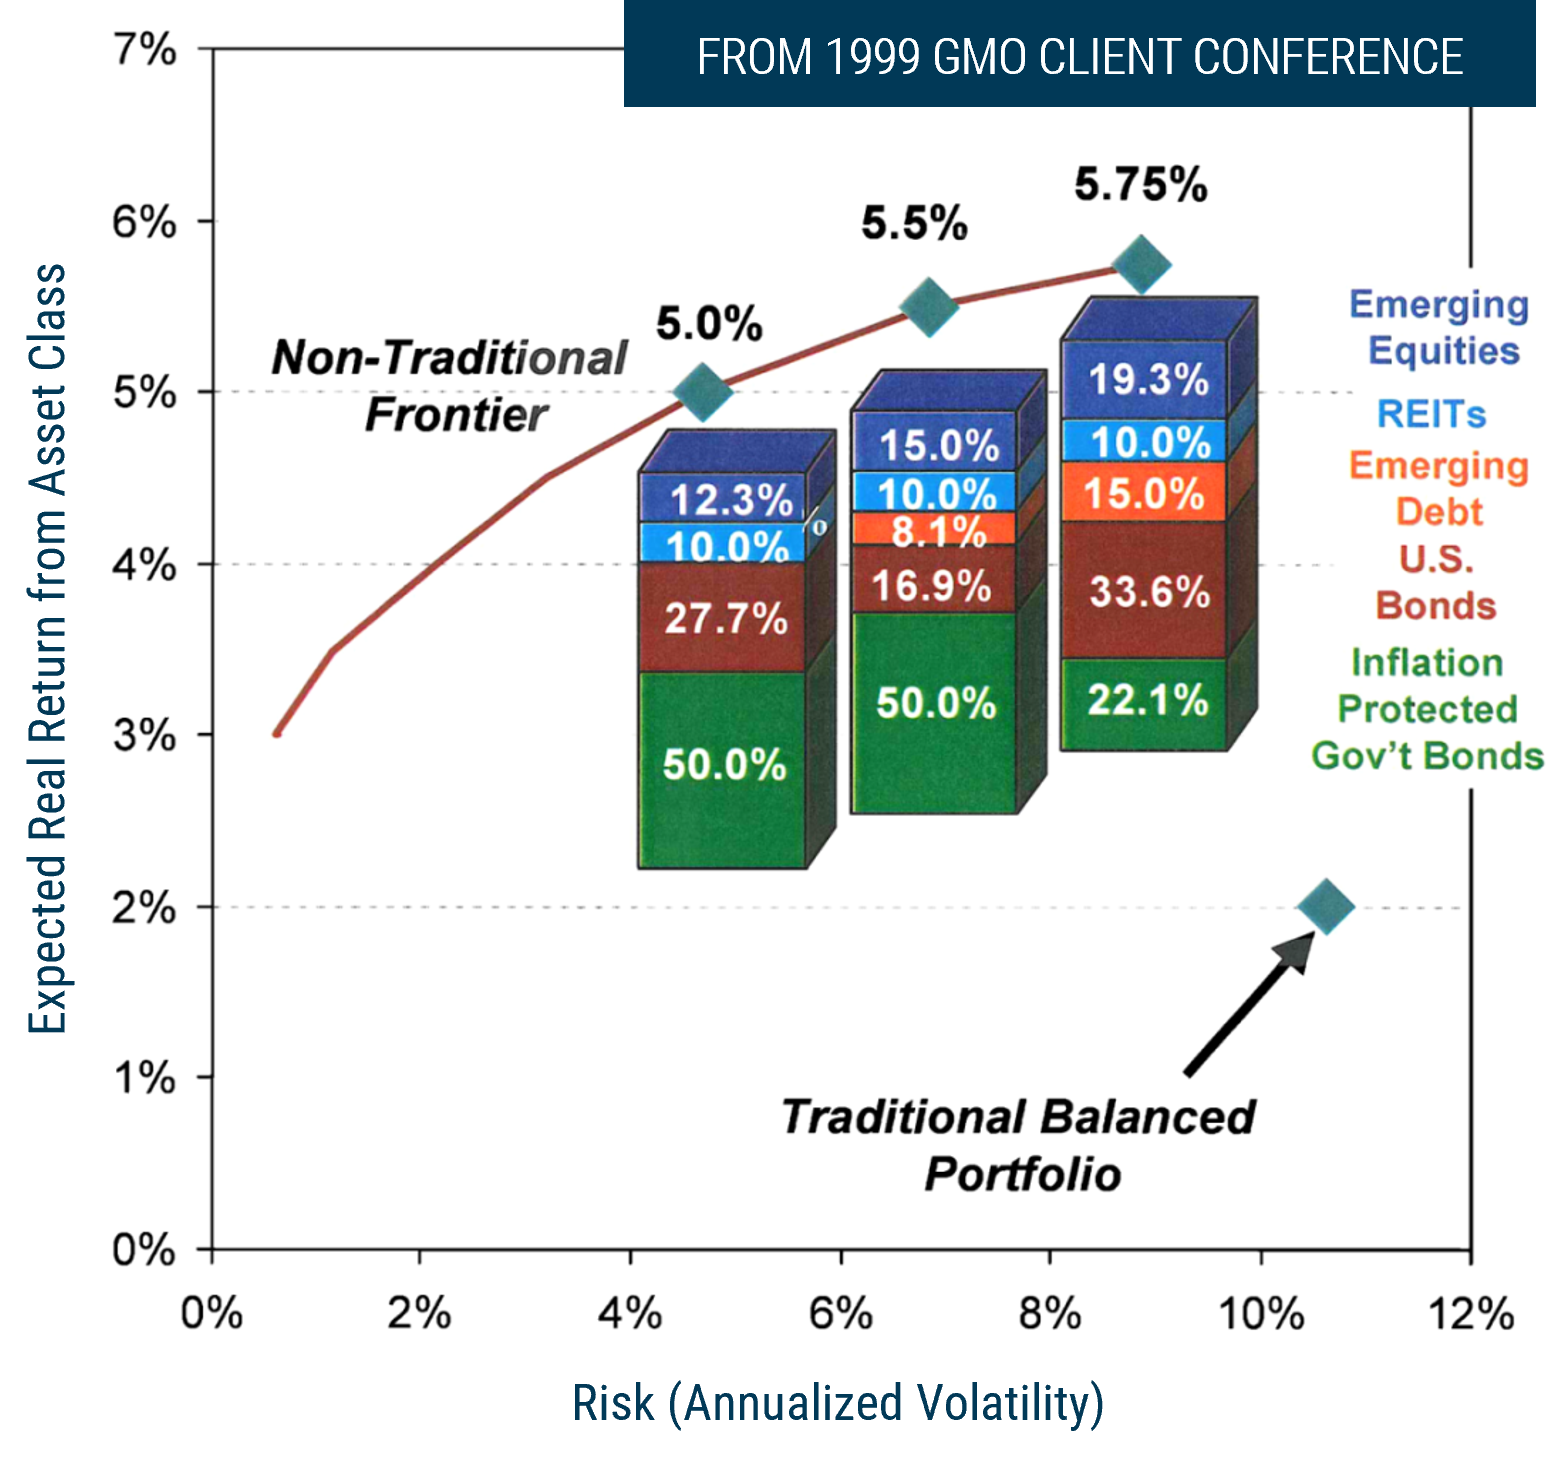
We first raised this concern with clients in the fall of 1999, when we argued that the S&P 500 and other large-cap growth companies around the world had become a dangerous investment bubble destined to deliver poor returns over the subsequent decade. Because those stocks had come to dominate traditional indices, we believed a traditional 60/40 portfolio was doomed to an extended period of poor absolute performance and had little hope of delivering the kind of real returns that institutions needed in order to achieve their long-term missions. Jeremy Grantham asked me to build an exhibit for our client conference that fall to illustrate both the problem and a possible solution to it (Exhibit 1).
Exhibit 1: Achieving a 5–5.75% Real Return Using a Non-Traditional Portfolio
Source: GMO
Based on GMO’s asset class return forecasts. These forecasts are forward-looking statements based upon the reasonable beliefs of GMO and are not a guarantee of future performance. Forward-looking statements speak only as of the date they are made, and GMO assumes no duty to and does not undertake to update forward-looking statements. Forward-looking statements are subject to numerous assumptions, risks, and uncertainties, which change over time. Actual results could differ materially from those anticipated in forward-looking statements.
Our concern was straightforward: based on our asset class forecasts at the time, a traditional 60/40 portfolio 2 looked priced to deliver about 2% above inflation over the next decade—well below the 5% real 3 return a foundation typically needs to preserve its corpus, as well as the similar returns that underlie the assumptions behind endowment spending and retirement savings. But while a traditional portfolio could not realistically hope to earn that much given starting valuations at the time, a 5% real return did not look especially difficult to reach. Given that U.S. Treasury Inflation Protected Securities (TIPS) were yielding 4% real, REITs yielded 9%, and emerging market equity and debt had yet to recover from their 1997–98 crises and remained attractively valued, there were actually plenty of cheap assets around. Our exhibit showed that if the goal was not to track a 60/40 benchmark but to instead achieve a 5% real return, it looked to be possible to make such returns with substantially lower volatility than a traditional multi-asset portfolio embodied.
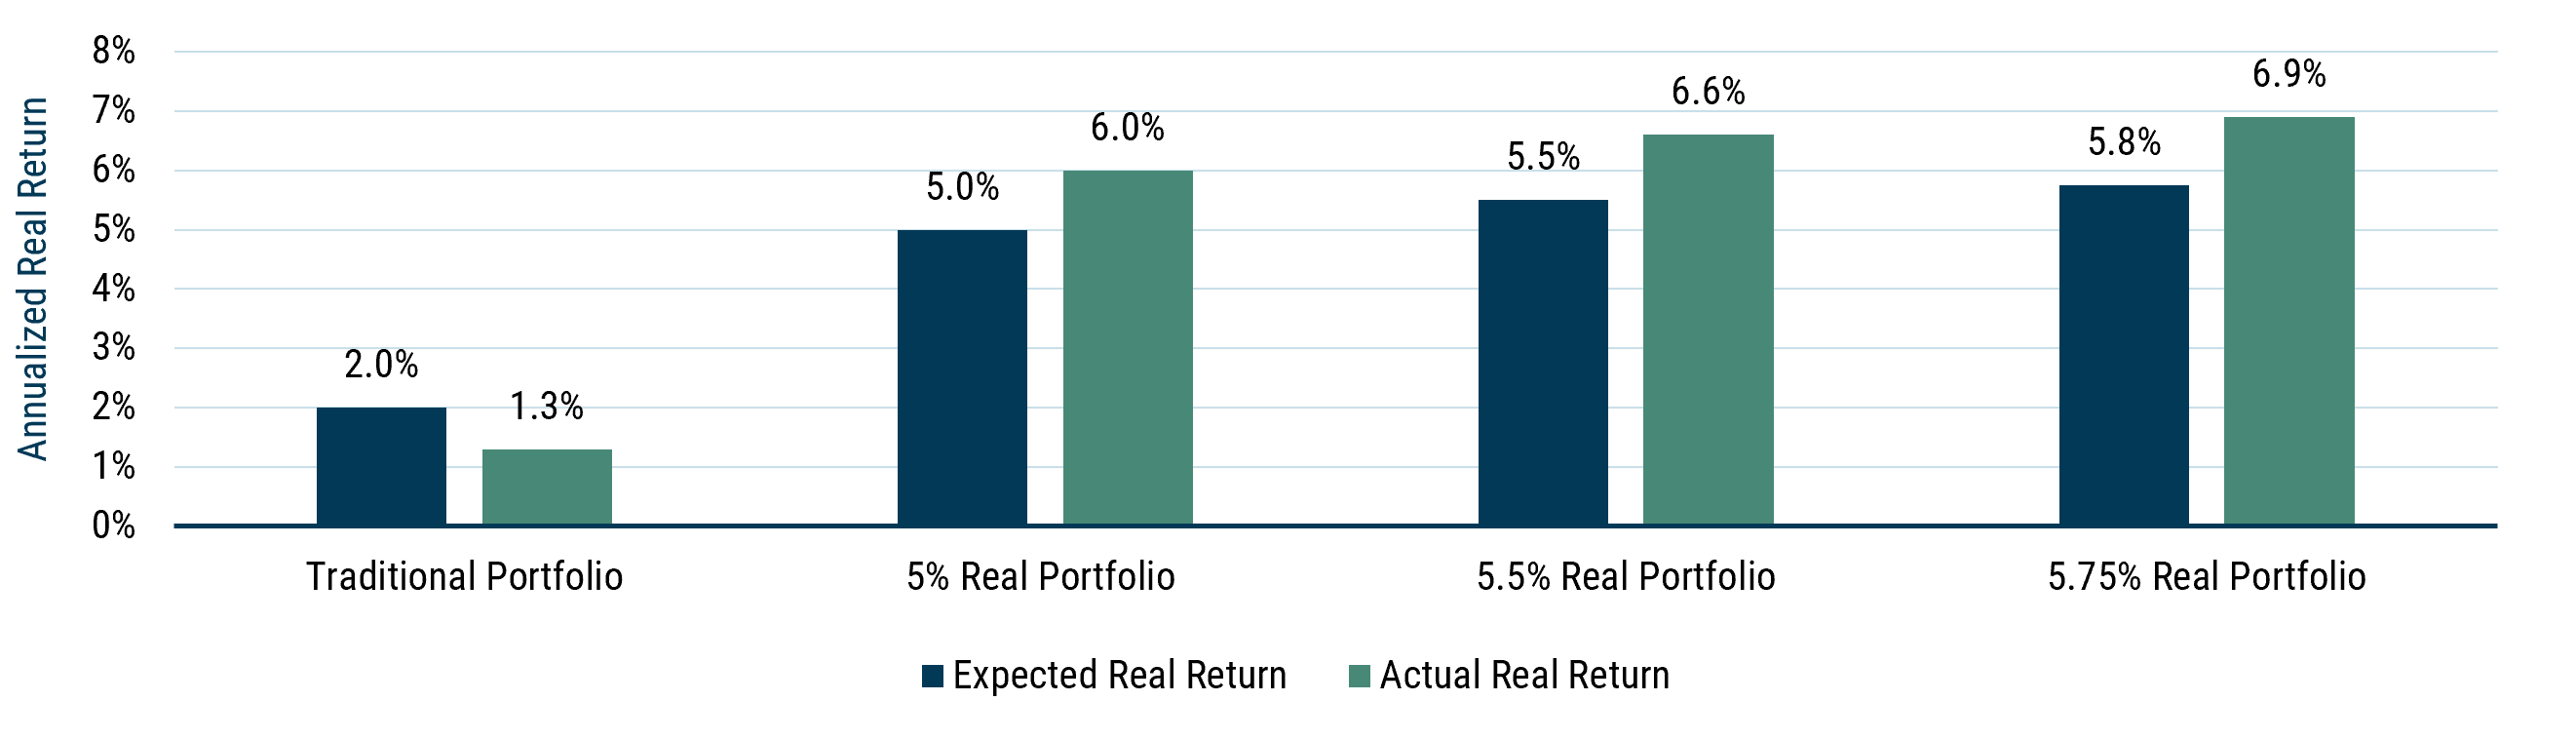
The exhibit turned out to be almost eerily prescient. Exhibit 2 shows the actual returns from September 1999 to September 2009 for each portfolio shown in Exhibit 1.
Exhibit 2: Results vs. 1999 GMO Conference Exhibit Forecast
Data from 9/30/1999 to 9/30/2009 | Source: GMO
The traditional portfolio is 60% MSCI ACWI/40% Bloomberg U.S. Aggregate Bond. The 5% real, 5.5% real, and 5.75% real portfolios are monthly rebalanced portfolios of the Bloomberg U.S. TIPS Index, the Bloomberg U.S. Aggregate Bond Index, the J.P. Morgan EMBI Global Index, the S&P U.S. REITs Index, and the MSCI Emerging Markets Index, all at the weights specified in Exhibit 1.
The problem we were pointing out was real—the traditional 60/40 portfolio did have poor returns over the subsequent decade—actually slightly worse than we expected, at 1.3% real versus our 2% real forecast. The portfolios we suggested, on the other hand, achieved somewhat higher returns than we forecast, comfortably exceeding the 5% real return hurdle that investors generally need. The problem was that we were exactly the wrong messengers to give investors this news. At that time, our asset allocation portfolios were seriously underperforming their benchmarks, and our persuasive power was understandably at an ebb. We knew that we could build portfolios to achieve our clients’ underlying goals—they were exactly the portfolios we were building for ourselves and our families. But we had little expectation that institutional investors facing the kind of agency problems that led to tracking-error-driven portfolio management would be willing to sign up for such outlandishly different portfolios.
So when the first client signed up in the summer of 2001, it was something of a surprise. Not entirely a shock—by then we were a year into a serious bear market, and in bear markets, investors have a tendency to rediscover their need for absolute returns—but it was still exciting to put these portfolios into practice for an actual client. 4 After another year of difficult market conditions, a few more clients signed up, and by 2003, we had enough to create a mutual fund 5 and offer the strategy to a broader group of clients.
The idea was always a simple one and it felt compelling, at least to us. By building a portfolio focused purely on absolute risk and return, we believed we could deliver returns at least as good as those of a traditional portfolio, with less risk of absolute loss. While the cost would be a much greater risk of relative underperformance vs. traditional benchmarks when those benchmarks were doing particularly well, for some it was a trade-off worth making. And after 25 years, despite some fairly harrowing periods of underperformance relative to traditional benchmarks, the results have panned out. The Benchmark-Free Allocation Strategy, whose goal has been to achieve a real return of 5% with risk similar to or less than that of a traditional 60/40 portfolio, has delivered 5.7% real net of fees since inception, against 4.0% real for 60/40. It has also lost only half as much on average during the five major 60/40 drawdowns since the launch of the strategy, with an overall maximum drawdown in the 25 years of 19.3% versus 35.7% for 60/40.
Benchmark-Free’s Differentiating Features
Benchmark-Free shares a few characteristics that all our asset allocation strategies exhibit, to wit:
- Top-down and bottom-up focus on valuation
- High conviction
- Broad (and innovative) toolkit
It also adds a fourth feature that changes how we think about the first three:
- Redefinition of risk and success to focus on absolute gains and losses instead of returns relative to a benchmark.
Valuation
GMO has unparalleled experience assessing valuations at both the security and the asset class levels. GMO’s Asset Class Forecasts, which we have been publishing since 1994, reflect our valuation-driven views and are a major input to portfolio construction for the Benchmark-Free portfolio. As a result, our asset allocation strategies typically rotate away from expensive assets (which have often experienced recent strong performance) and into cheaper assets (which may have struggled). In Benchmark-Free’s case, that rotation away from assets can become total, and indeed, there is no major asset that has been represented in Benchmark-Free for the entirety of its 25-year life.
High Conviction
Many allocation strategies that claim to be dynamic only make modest changes. Fearing tracking error, they only tweak the portfolio around the edges, making large allocations to the major benchmark constituents regardless of whether those assets are priced to deliver a reasonable risk/reward trade-off. At GMO, our asset allocation strategies will take very substantial bets for or against assets that we believe are extremely attractively or unattractively priced.
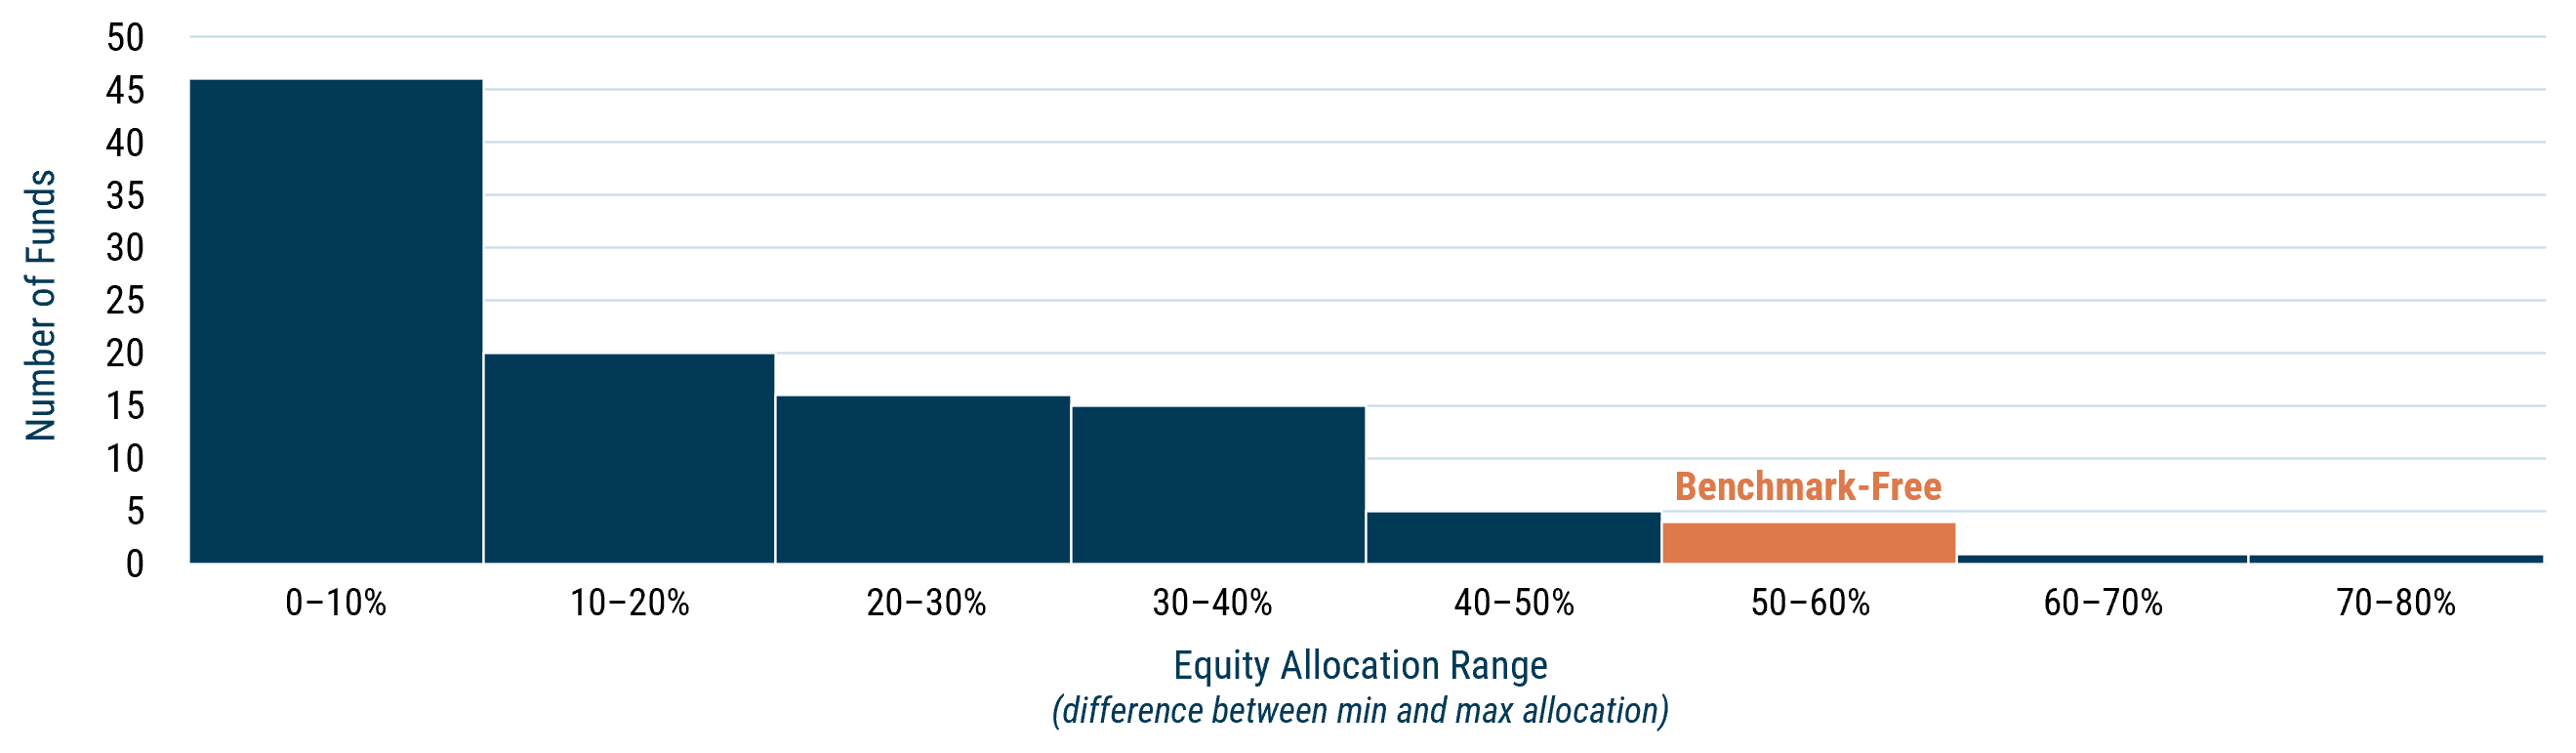
Benchmark-Free takes that conviction one step further by changing the framing of risk. Rather than starting from a particular benchmark and deciding how underweight or overweight we want to be in an asset class or style, we start from a blank slate. No asset class is automatically included in the portfolio. We look at the expected return and risk of each asset we have access to and build a portfolio of only those assets that offer a decent expected return for the risks they embody. When asset classes are priced to deliver good returns relative to their risk—as they were in 2003, 2010, or 2023—we will own relatively more risk assets. When asset pricing implies poor returns for risky assets, such as in 2007–08 or 2021, we will move the portfolio aggressively toward lower risk. The result is a portfolio that is much more active than the typical allocation fund (Exhibit 3).
Exhibit 3: Benchmark-Free Is More Active Than 95% of Allocation Funds
As of 9/30/2024 | Source: GMO, Morningstar
Based on funds in the U.S. Fund Global Allocation category with at least 5 years of history; extreme datapoints are truncated. The above information is based on a representative account in the strategy selected because it has the fewest restrictions and best represents the implementation of the strategy.
Broad (and Innovative) Toolkit
Benchmark-Free allocates beyond the standard assets represented in a traditional balanced portfolio. For example, the strategy has taken substantial exposures in U.S. TIPS, emerging country bonds, high yield, and securitized credit—all of which are excluded from the Bloomberg U.S. Aggregate Bond benchmark. We have consistently incorporated diversifying alternative strategies within Benchmark-Free’s opportunity set, and on occasions where traditional asset classes are simultaneously unattractively priced, such as at the end of 2021, the aggregate weight in alternatives has risen to over 50% of the total portfolio.
We also develop new strategies, if necessary, to fully express an investment view. For example, we designed and launched the Equity Dislocation Strategy in late 2020, seeking to profit from the extraordinary valuation dislocation between value stocks and growth stocks. The strategy is long cheap value stocks and short expensive growth stocks. Since its inception, Equity Dislocation has held the largest position and carried the most risk within Benchmark-Free. The strategy has generated a cumulative gross return of 106% since its inception, far outpacing a long MSCI ACWI Value/short MSCI ACWI Growth index approach, which made 0.2% over the same period. 6 We continue to hold this strategy as the value opportunity remains at historic extremes.
Focus on Outcomes—A Total Portfolio Mindset
Because Benchmark-Free focuses on generating real returns instead of beating a particular benchmark, it naturally has a different view of risk than most traditional portfolios. Rather than focusing on the volatility of an asset class and its correlation to the indices that make up the benchmark, we look at the fundamental drivers of lasting impairment of capital and aim to build a portfolio that delivers a strong expected return relative to those fundamental risks. We believe that the primary circumstances that lead to lasting impairments of capital are bad recessions, significant unanticipated inflation, and severe liquidity shocks. 7
Viewing portfolio risk through this framework naturally causes us to move away from the silos that characterize much investment thought today. Emerging country debt and U.S. small cap stocks are in completely different asset classes, but because both stand to lose significant amounts of money in a severe recession, they compete directly for capital in the portfolio since they embody that similar economic risk. On the other hand, emerging countries are more acutely sensitive to the ability to refinance their debts on a regular basis. So on liquidity risk, emerging debt is competing with long/short relative value strategies, which may be largely unaffected by a recession but are likely to lose money in a liquidity shock, as valuation discrepancies that look like arbitrage opportunities in calm times can not only blow out to very wide levels but become difficult or impossible to hold as financing is taken away. In building our Benchmark-Free portfolio, we want a blend of strategies that, in combination, will attempt to deliver a good expected return with manageable expected losses in those fairly rare but impactful downside scenarios.
We do not try to avoid taking those risks entirely. It is impossible to make money without taking risks—our goal is to take a prudent amount of risk that will give attractive gains in the good times while ensuring the losses in the bad times are not so large that they interfere with the portfolio’s ability to compound wealth. One key differentiator between our stance and that of risk parity and similar strategies is our belief that valuations are a key driver of not only asset class expected returns, but also their risk characteristics. Inflation-linked bonds seem, on the face of it, less vulnerable to unanticipated inflation than traditional bonds. But if the yield on such bonds is very low or negative, they can be even more vulnerable than traditional bonds, as investors learned in 2022. In that event, those bonds’ high sensitivity to changes in real rates more than offset their direct protection against changes in CPI. Cheap valuations, on the other hand, can create resilience to otherwise painful economic shocks. As an example, equities trading at low valuations are often surprisingly resilient to both recessions and inflation because their high earnings yields and significant dividends cushion losses.
Hits & Misses Over 25 Years
Over 25 years of investing, we have gotten some things very right and a few quite wrong. On the good side of the ledger, we managed to sidestep significant amounts of pain in the worst two drawdown events of the last quarter century when valuations warned us against taking risks that were poorly compensated. We also benefited from our willingness to aggressively move into undervalued assets in the early 2000s and over the last couple of years. Our biggest mistakes have been to fail to understand when fundamentals were about to move strongly counter to their historical patterns—to the plus side in the U.S., where profit margins that had been strongly mean-reverting for a century moved consistently higher throughout the 2010s and early 2020s; and on the negative side, when emerging market sales per share growth massively decelerated after about 2012.
What We Got Right |
What We Got Wrong |
| Early 2000s: Non-U.S. | 2010–Present: Extraordinary U.S. Fundamental Performance |
| 2008: First Truly Global Bubble (de-risked) | 2015–2021: Disappointing EM Fundamental Performance |
| 2022: Duration Bubble (de-risked) | |
| 2025–26: Non-U.S. Value |
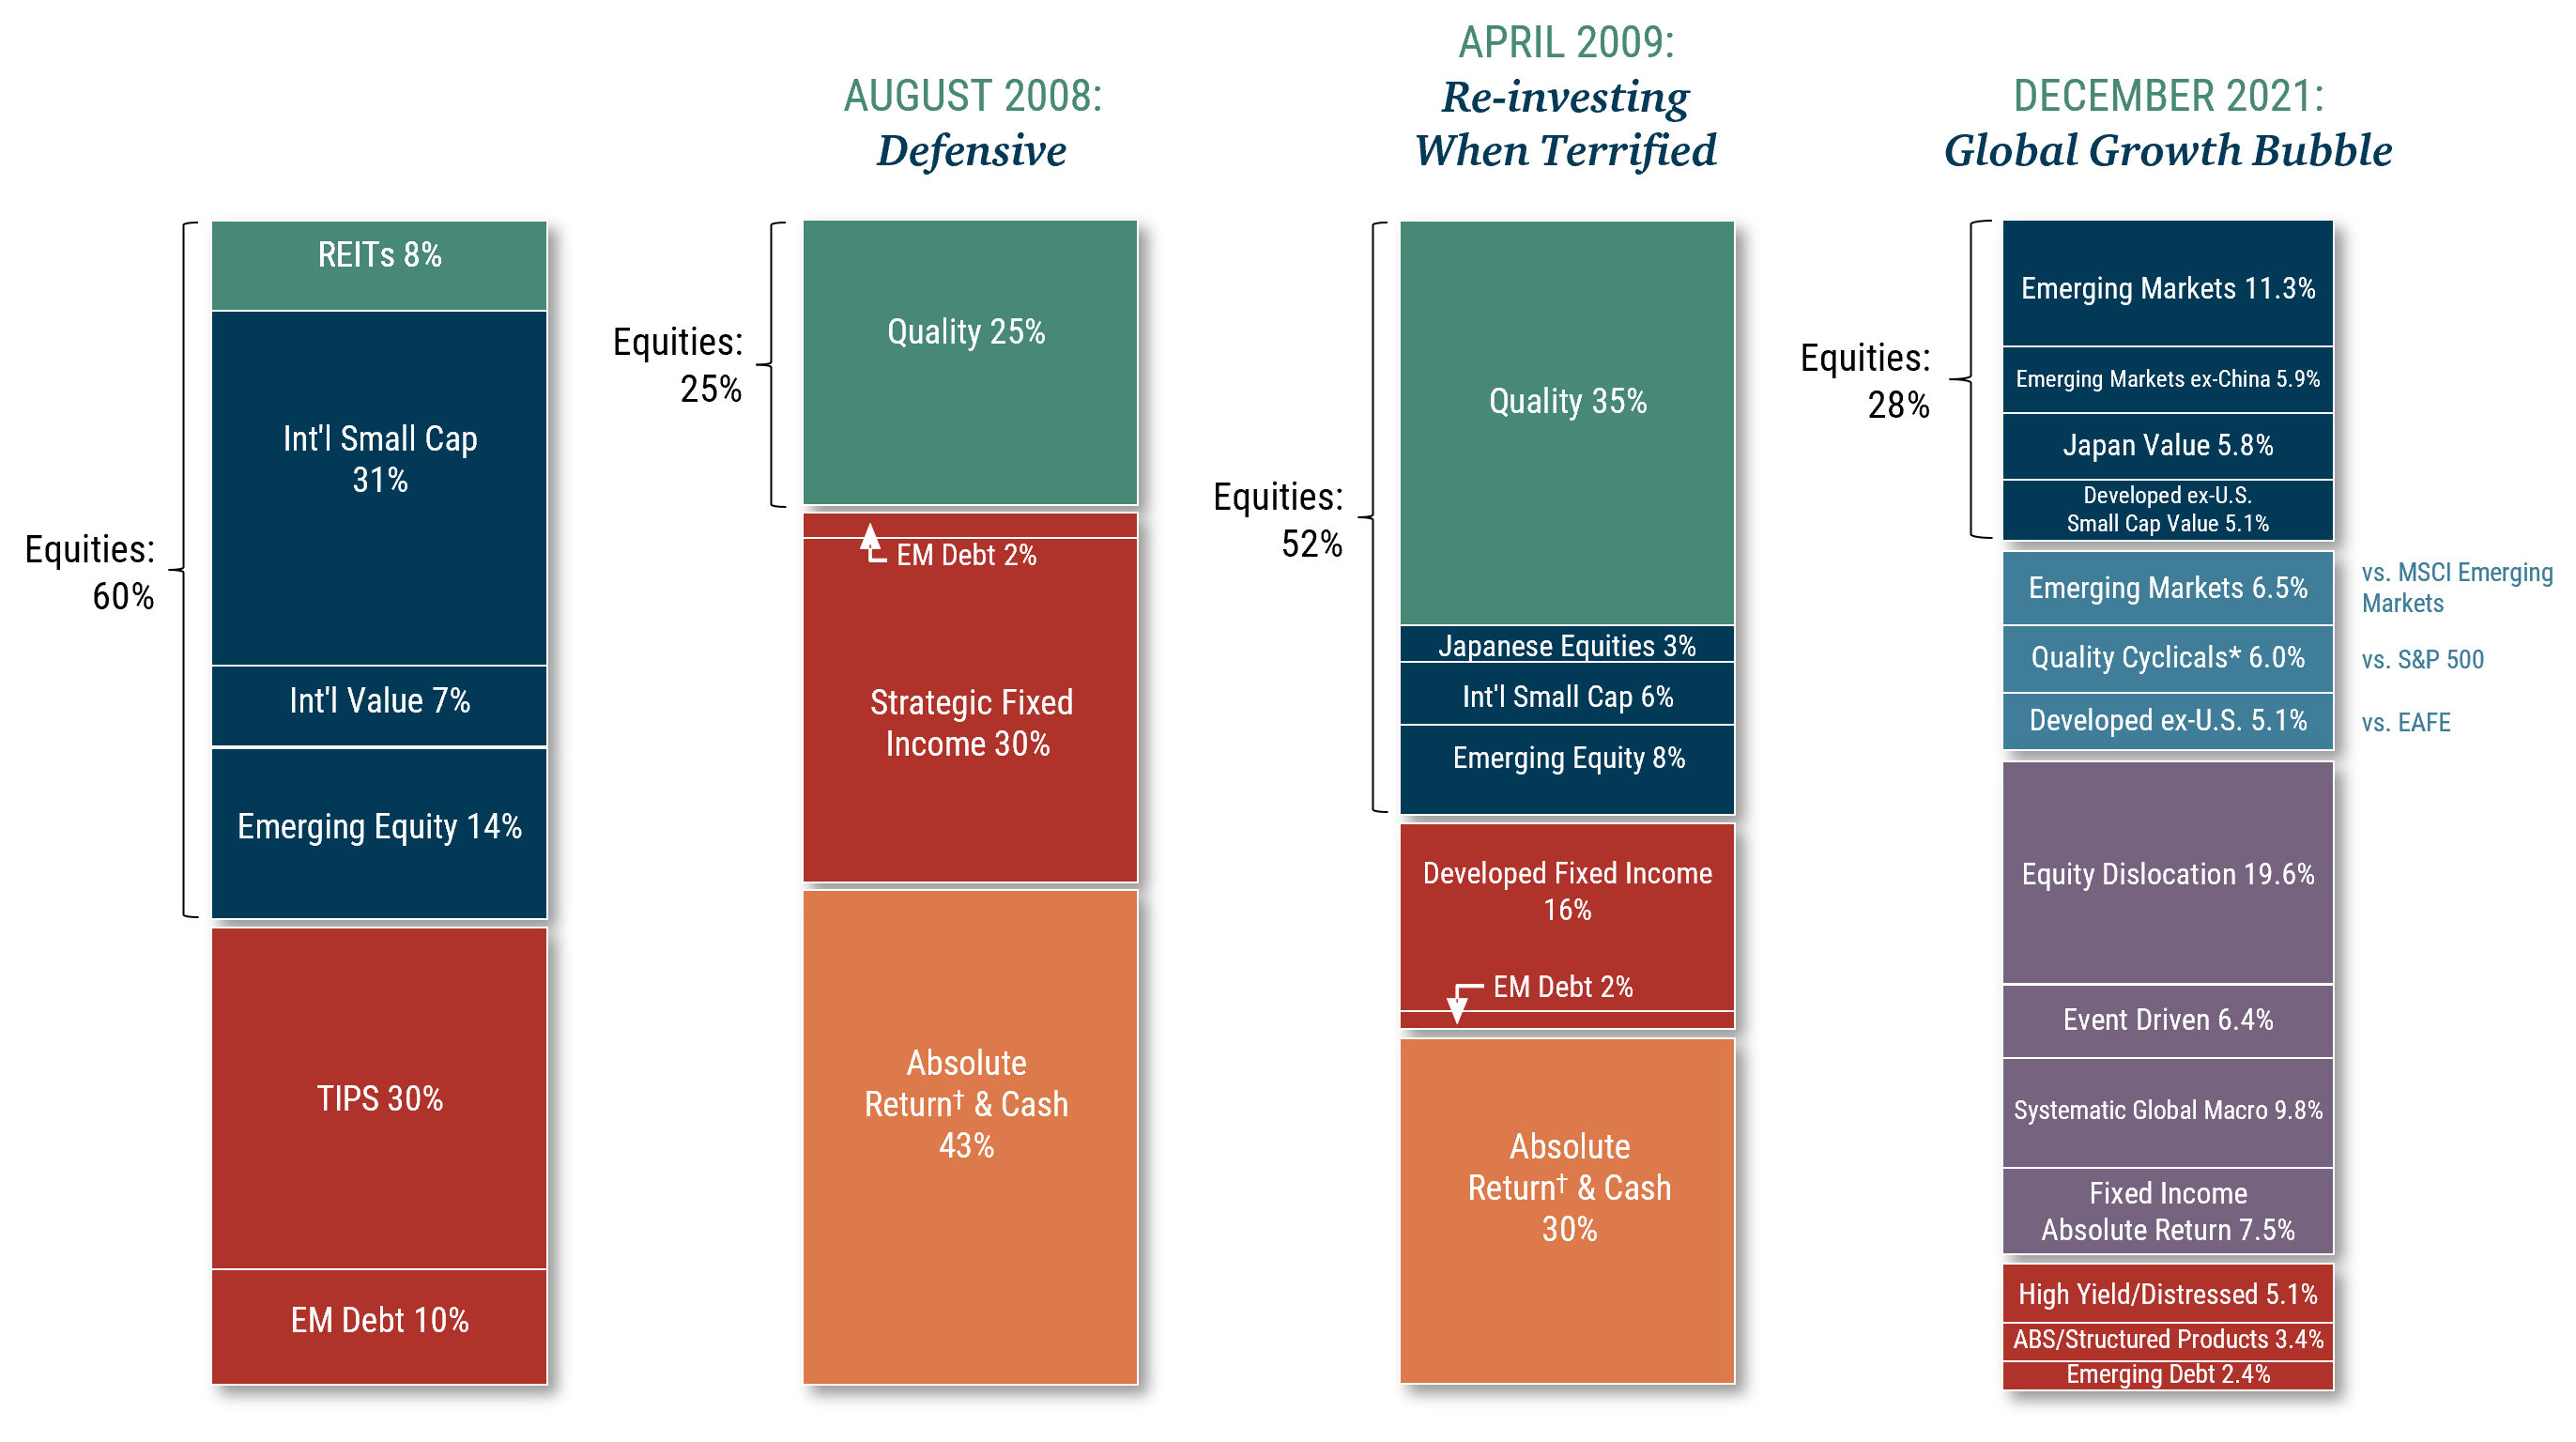
Exhibit 4: Willing to Be Dynamic and Unconventional
Benchmark-Free Allocation Strategy
Source: GMO
*Formerly Cyclical Focus Strategy.
†Combination of Alpha Only Fund and other private vehicles.
The above information is based on a representative account in the selected strategy because it has the fewest restrictions and best represents the implementation of the Strategy.
Benchmark-Free’s Biggest Hits
-
Early 2000s | Non-U.S. Bet: At inception, the strategy’s equity allocation was unconventional, with major exposures to non-U.S. stocks, including a large allocation to niche segments like small-cap and emerging markets. Those assets were quite cheap and delivered strong absolute returns over the next several years, with differentiated returns compared to a U.S.-biased portfolio. To put the scale of the performance difference in perspective, from the launch of Benchmark-Free to the summer of 2007, MSCI Emerging and MSCI EAFE Small delivered annualized real returns of 24% and 17.2%, against 2.2% real for the S&P 500. 8
- 2008 | First Truly Global Risk Bubble: By 2007, the loose monetary policy that enabled speculation in real estate had encouraged investors to bid up risk assets, creating what Jeremy Grantham dubbed the “Everything Bubble.” 9 We followed what the valuations were telling us and aggressively de-risked, reducing Benchmark-Free’s equity exposure to 25% by the summer of 2008. This tempered Benchmark-Free’s drawdown, and our early rotation back into risk assets also allowed us to capture a good portion of the rebound.
- 2022 | Duration Bubble: In 2021, long-duration assets (stocks and bonds) were very expensive. By the year-end, we had moved 60% of Benchmark-Free to liquid alternatives—strategies like equity long/short, merger arbitrage, and global macro. Though liquid alternatives strategies do take risk, they do so in a much shorter-duration way than traditional assets. Liquid alternatives seek to generate returns on top of cash, rather than on top of bond or stock benchmarks. These strategies delivered positive returns through 2022, when both stocks and bonds suffered double-digit drawdowns. We were then able to reallocate from liquid alts into newly cheaper risk assets.
-
2025–26 | Non-U.S. Value: The U.S. equity market has become concentrated and expensive, and the U.S. dollar has become expensive as well. Stocks outside the U.S. generally remain reasonably valued, and the pockets that we’ve emphasized most (deep value, Japan, and small cap value) performed exceptionally well even as the U.S. equity market has continued to deliver strong results. Japan is a case where we correctly predicted a secular improvement in fundamentals driven by changes in policy and corporate culture; these changes are ongoing.
Benchmark-Free’s Most Painful Misses
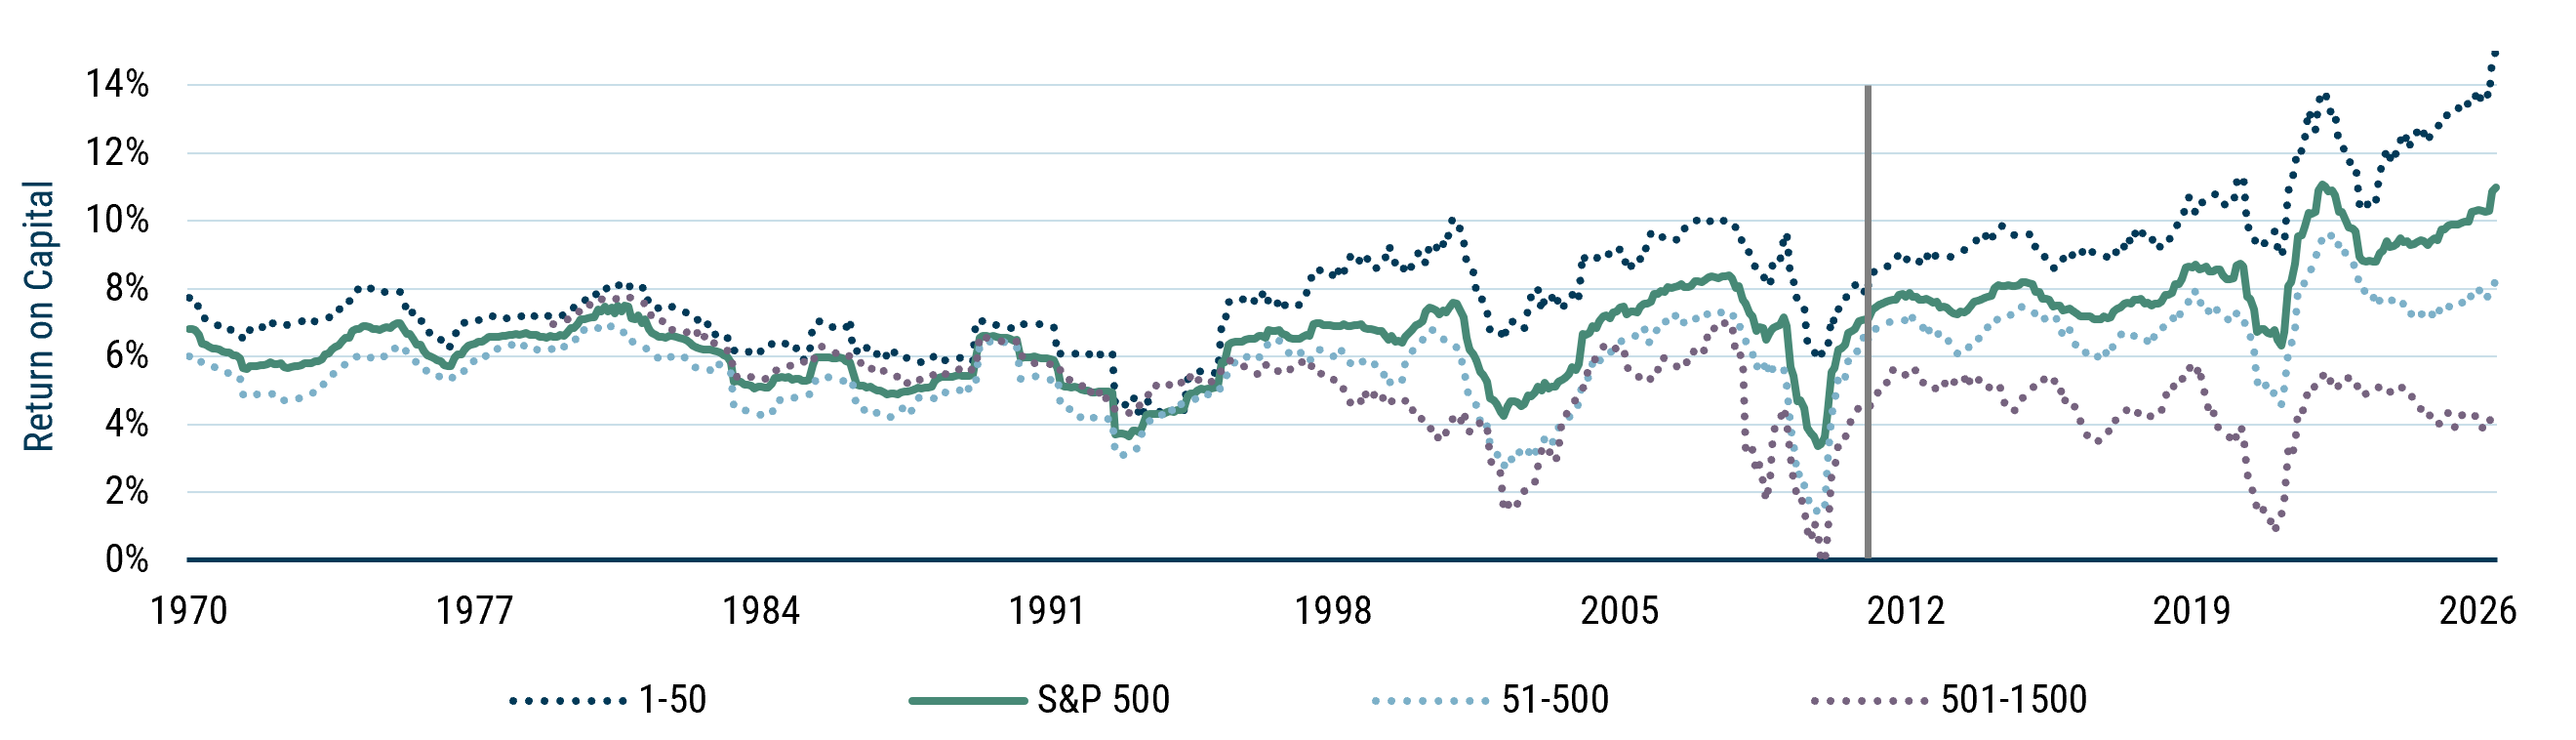
- 2010–Present | Extraordinary U.S. Fundamentals: Benchmark-Free’s most damaging misstep has been under-allocating to the U.S. equity market during its tremendous bull run. While our equity book was entirely U.S. stocks as of late 2008, by the early 2010s, we believed that U.S. stocks were looking pricey, as their P/E was higher than normal and profitability was looking cyclically high. What we failed to anticipate was that trend profitability had in fact moved significantly upward for the largest companies, a trend that would pull profitability for the overall S&P 500 higher over the next decade, in contrast to prior history and, indeed, to the pattern for smaller U.S. companies since then. Exhibit 5 shows a return on capital measure for the S&P 500, as well as stocks 1–50 and stocks 501–1500 ranked by size in the U.S. equity market.
Exhibit 5: Return on Capital for U.S. Stocks by Size Rank
Data from 1/1/1970 to 6/1/2026 | Source: Worldscope, Compustat, GMO
Macroeconomically, several factors were different in the post-GFC period—interest rates fell to levels not seen in more than half a century, corporate tax rates continued to fall, and the federal government consistently ran larger deficits than before. But while each of those could arguably have helped boost corporate profits, you would have expected them to do so across the size spectrum. That is decidedly not what happened. The median company among the top 1,500 companies by market cap experienced falling profitability over the last 15 years, 10 while the largest companies have seen their return on capital grow to the highest levels in history. The explanation is almost certainly a pronounced and historically unique increase in market power among the very largest companies in the U.S., which we were too slow to recognize.
We have since adjusted our forecasting methodology to capture such changes more quickly and give more credit for high profitability when it looks more like a secular change than a cyclical move.
- 2015–2021 | Disappointing EM Fundamentals: We found emerging markets attractive over a similar horizon, from 2015 to 2021. We didn’t forecast extraordinary fundamental growth, but the emerging markets failed to meet even our modest expectations. From September 2014 to September 2024, China’s fundamental return (equity market return excluding changes in valuations) underperformed the global equity markets by 4.3% annualized. Effectively, our allocation to emerging market stocks turned out to be a value trap.
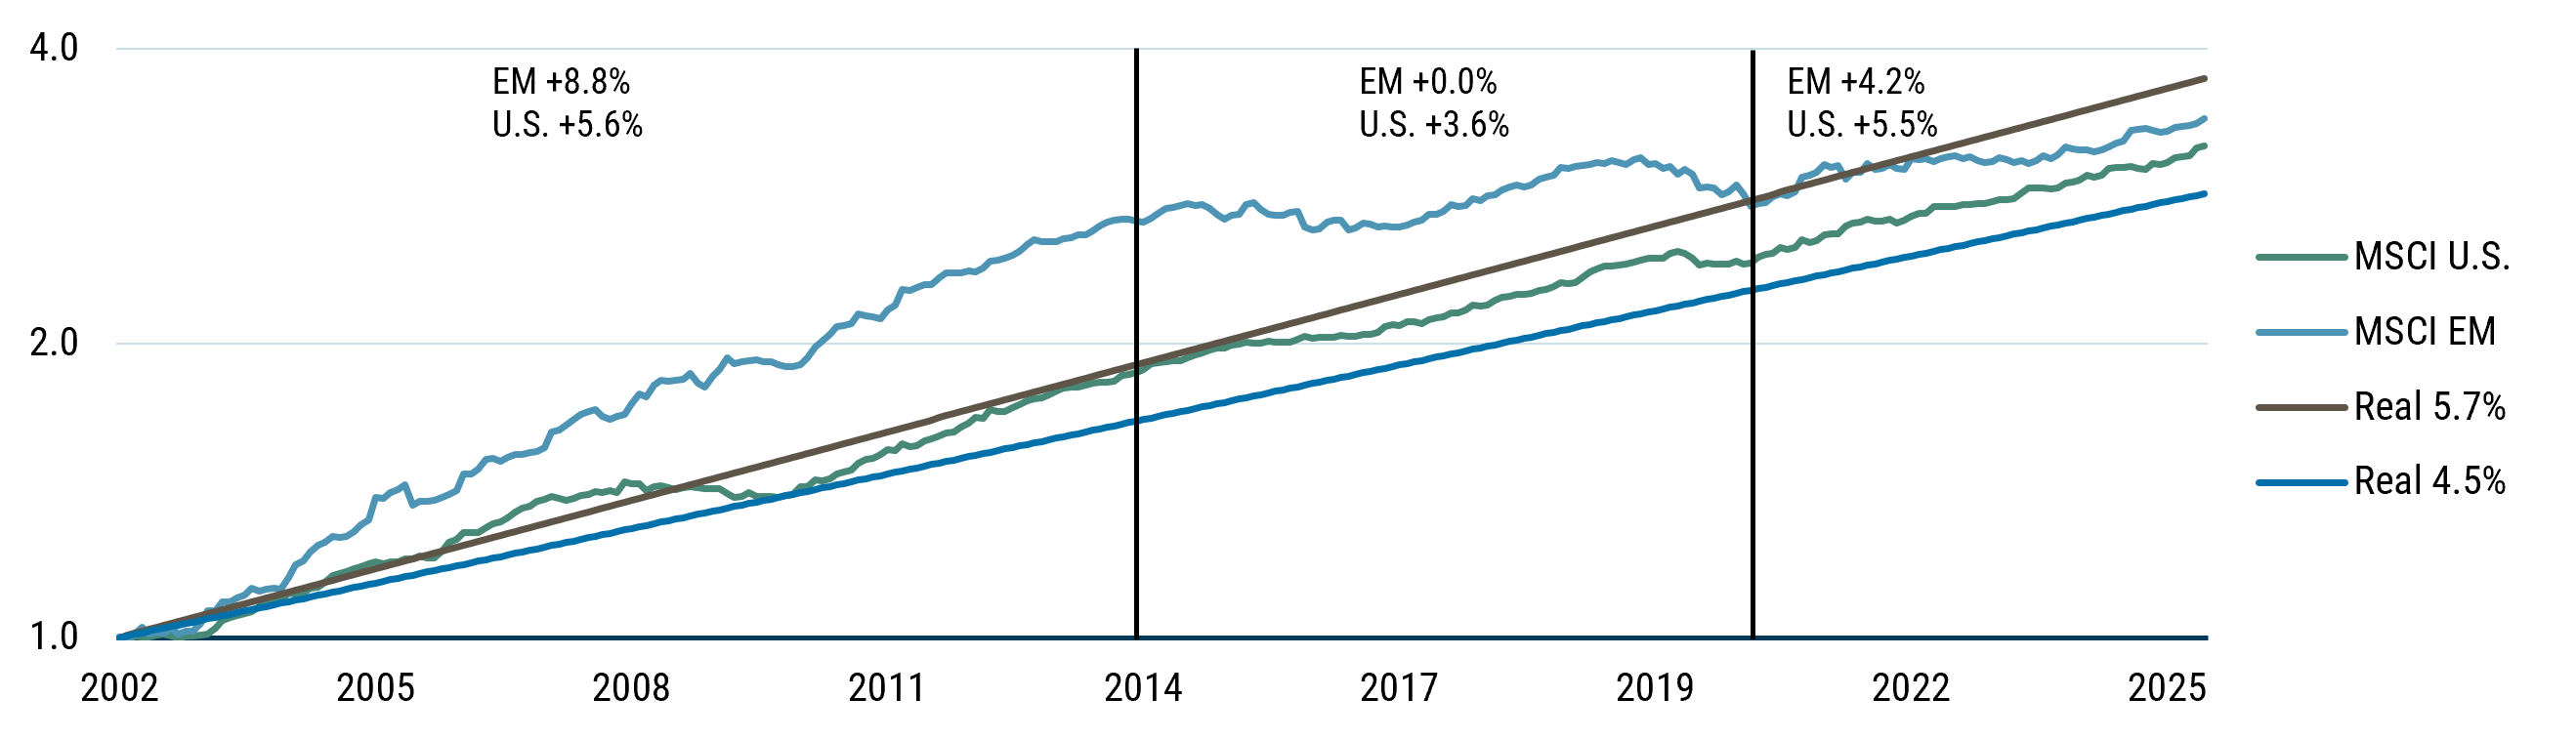
What we didn’t recognize quickly enough in that circumstance was that emerging equities were a “fundamental bubble.” It’s not that emerging equity valuations were unsustainably high, but that the apparent emerging market fundamentals (sales, book value, etc.) had grown much faster than could be sustained over the long run. They were due for a give-back on that front, which seems to have occurred from 2014 until about 2021. Exhibit 6 shows the growth of fundamentals in MSCI Emerging Markets and MSCI U.S. from 2002 to 2026. From 2002 to 2014, EM grew its fundamentals at an extraordinary rate, far faster than our general estimate of the high end of likely long-term growth rates for equities. From 2014 to 2021, it seems to have given back those gains and moved on to a more sustainable growth rate since then.
Exhibit 6: Fundamental Growth for EM and U.S. Since 2002
Data from 6/28/2002 to 3/31/2026 | Source: Worldscope, Compustat, MSCI, Standard & Poors, GMO
Again, in the spirit of learning from our mistakes, we are keeping a closer eye not only on assets with deteriorating fundamentals, but also on those that have exhibited unsustainable growth rates in recent years.
Looking ahead: The Next 25 Years
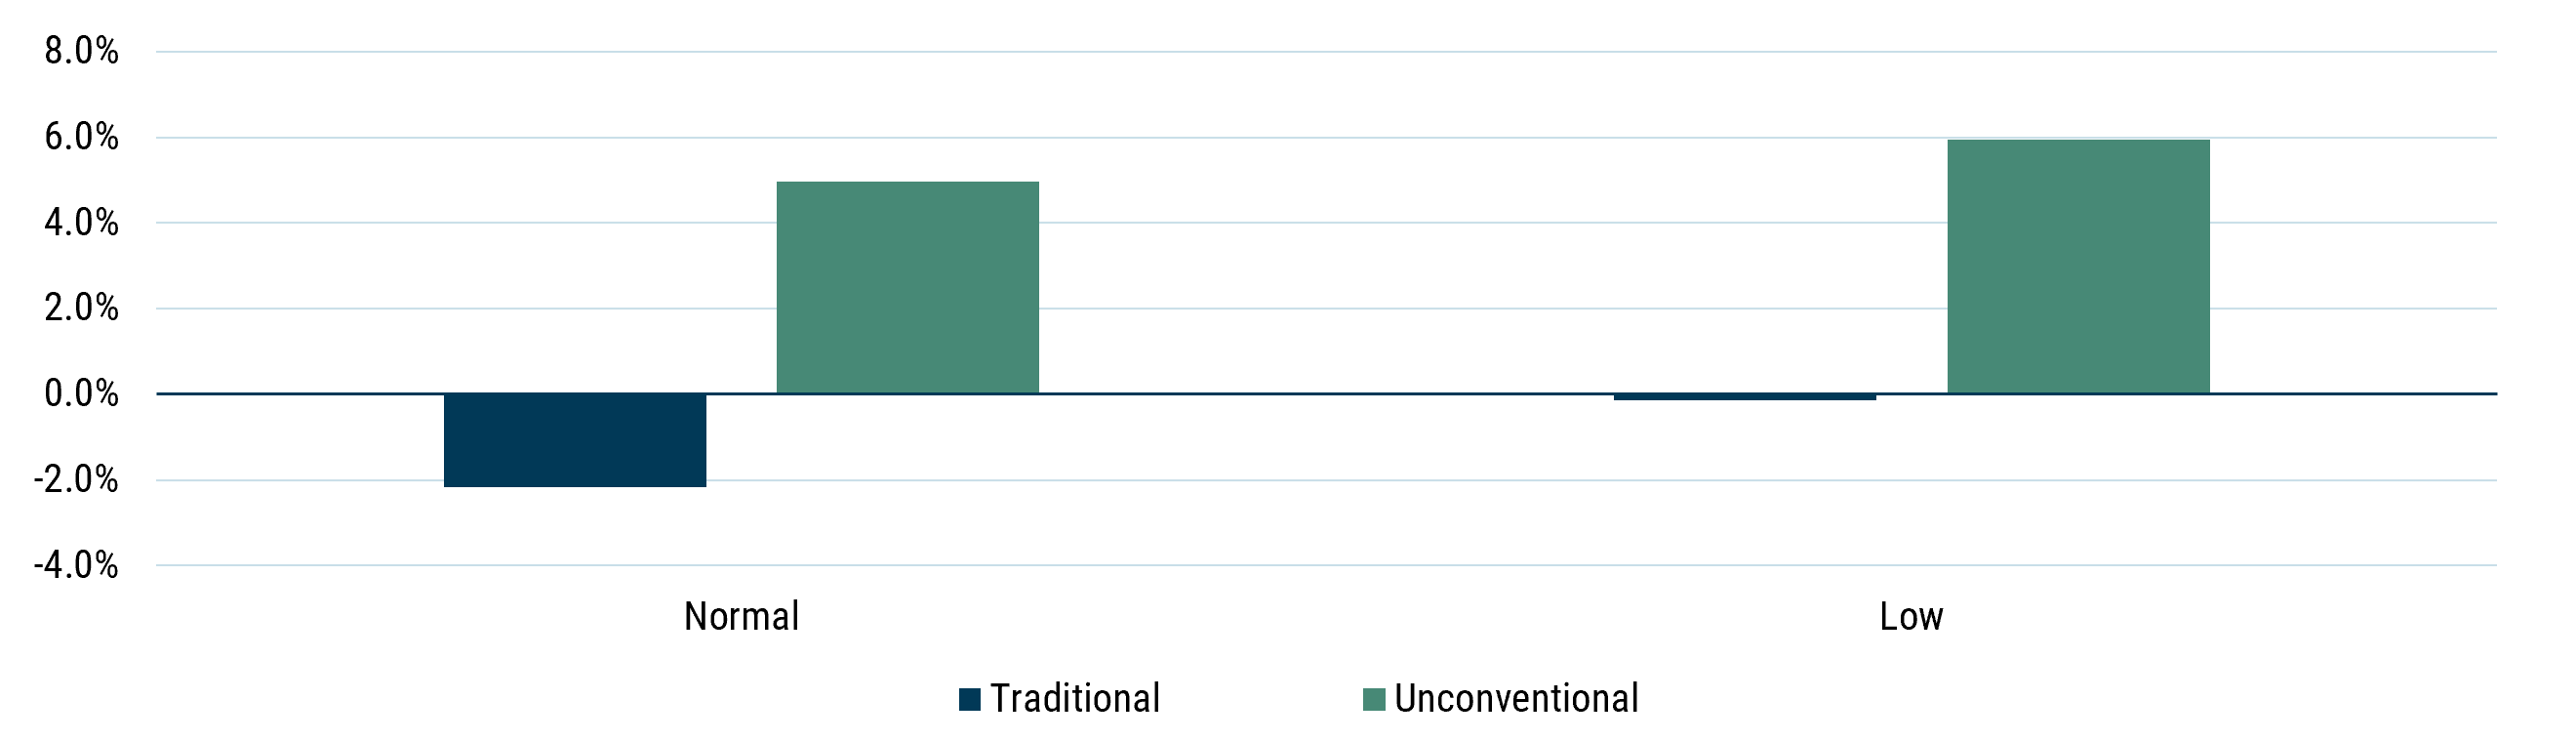
Today, we see a different group of companies whose fundamentals have been growing at an unsustainable rate—the AI plays. In a somewhat eerie parallel to the situation in 1999, we have a group of stocks that investors seem unable to get enough of. Investors have pushed these stocks to valuations that will make earning a decent future return on them very challenging. Our forecasts have evolved a bit since 1999, so the data isn’t entirely comparable, but today it looks at least as unlikely for the traditional 60/40 to deliver 5% real over the coming years as it was back then. The opportunity for the unconventional portfolio managed without concern for benchmarks looks much better (Exhibit 7).
Exhibit 7: Real Return Forecasts Across Equilibrium Rate Scenarios
As of 6/30/2026 | Source: GMO
Like 1999, the trouble is not that there are no assets priced to deliver decent returns to investors, it is that traditional indices have become increasingly concentrated in precisely those assets that are not priced to deliver such returns. You don’t need to take crazy amounts of risk to make decent returns going forward. But our best guess is that you do need to be willing to look different and shift your portfolio toward assets that aren’t nearly as sexy and trendy as the latest hot IPO. If history is any guide, assets like Japanese small caps, global deep value, and liquid alternatives deserve to be pillars of a benchmark-agnostic portfolio, while the AI darlings, as wonderful as their returns have been in retrospect, look set to disappoint in the coming years.
Conclusion
We have learned a lot about benchmark-free investing in the last 25 years. First, it really is possible to deliver compelling long-term returns and lower downside risk without being infallible predictors of the future. Second, achieving that track record came with substantial periods of relative underperformance when traditional portfolios were flying high, and ours were not. I could wish that all the clients who hired us along the way had stayed with us for the entire ride. Sadly, that isn’t the case. People have been most excited about hiring us when we have been recently right and have tended to abandon the strategy after a bout of relative underperformance—a distressingly common pattern across much of investment management. Those who have stuck with us for the long run and reaped the benefits of doing so have generally been investors who appreciated our difference from traditional portfolios and were prepared to move at least a piece of their portfolio away from framing performance as a game of benchmarks and tracking error. Not every investor is in a position to do so, but for those who can, we believe benchmark-free investing has proven itself a worthy piece of a thoughtful portfolio for the last 25 years, and that it is positioned to continue doing so over the next 25.
60% MSCI All Country World Index/40% Bloomberg U.S. Aggregate Bond Index (known at the time as the Lehman Brothers U.S. Aggregate Bond Index)
A 5% real return is a return of 5% above the inflation rate.
In the spirit of full disclosure, that first client was a foundation recently set up by a venture capitalist who had done very well in the internet bubble. He had yet to set up an investment committee, had no external constituents to keep happy, and was astonishingly free of the agency issues that compel many investors to believe they need to own a traditional-looking portfolio.
At the time, the strategy was a combination of a large investment in this mutual fund (~80%), which at the time was not intended to be a standalone investment option, and a smaller investment in GMO’s absolute return hedge funds (~20% in total). Today, we’re able to achieve the absolute return exposures we want within the mutual fund structure.
As of 7/31/2026. The Strategy does not pay a management or performance fee on its holding of Equity Dislocation.
The bursting of an investment bubble can also cause lasting impairment even when it does not coincide with a severe recession or unanticipated inflation, as investors learned from 2000-2003. But a valuation-sensitive investment approach is naturally less vulnerable to such events.
Performance from 7/31/2001 to 7/31/2007 relative to U.S. CPI.
See It’s Everywhere, In Everything: The First Truly Global Bubble (Grantham 2007).
Given the shrinking number of publicly traded companies in the U.S., there is no perfect way to define a representative publicly traded company that is truly stable over time, but a median within the top 1,500 by market cap is better than most.
Disclaimer: The views expressed are the views of Ben Inker through the period ending September 2026 and are subject to change at any time based on market and other conditions. This is not an offer or solicitation for the purchase or sale of any security and should not be construed as such. References to specific securities and issuers are for illustrative purposes only and are not intended to be, and should not be interpreted as, recommendations to purchase or sell such securities.
Copyright © 2026 by GMO LLC. All rights reserved.
See My Sister’s Pension Assets and Agency Problems: The Tension Between Protecting Your Job or Your Clients’ Money (Grantham 2012).
60% MSCI All Country World Index/40% Bloomberg U.S. Aggregate Bond Index (known at the time as the Lehman Brothers U.S. Aggregate Bond Index)
A 5% real return is a return of 5% above the inflation rate.
In the spirit of full disclosure, that first client was a foundation recently set up by a venture capitalist who had done very well in the internet bubble. He had yet to set up an investment committee, had no external constituents to keep happy, and was astonishingly free of the agency issues that compel many investors to believe they need to own a traditional-looking portfolio.
At the time, the strategy was a combination of a large investment in this mutual fund (~80%), which at the time was not intended to be a standalone investment option, and a smaller investment in GMO’s absolute return hedge funds (~20% in total). Today, we’re able to achieve the absolute return exposures we want within the mutual fund structure.
As of 7/31/2026. The Strategy does not pay a management or performance fee on its holding of Equity Dislocation.
The bursting of an investment bubble can also cause lasting impairment even when it does not coincide with a severe recession or unanticipated inflation, as investors learned from 2000-2003. But a valuation-sensitive investment approach is naturally less vulnerable to such events.
Performance from 7/31/2001 to 7/31/2007 relative to U.S. CPI.
See It’s Everywhere, In Everything: The First Truly Global Bubble (Grantham 2007).
Given the shrinking number of publicly traded companies in the U.S., there is no perfect way to define a representative publicly traded company that is truly stable over time, but a median within the top 1,500 by market cap is better than most.