Executive Summary
As we enter the third quarter of 2021 our valuation metrics for emerging external and local debt are less compelling than they were at the beginning of the quarter:
- External debt valuations continue to remain within the historical range that we consider attractive.
- Within local debt, emerging market currencies are returning to attractive levels having migrated consistently through the quarter to the very top of the neutral range, while real interest rate differentials between emerging and developed markets (DM) have continued to widen.
In this piece, we update our valuation charts and commentary, with additional detail on our methodology available upon request.1
External Debt Valuation
The EMBIG-D benchmark spread tightened by 14 bps in Q2, ending the quarter at 340 bps. As seen in Exhibit 1, the multiple is the benchmark’s credit spread to the spread that would be required to compensate for credit losses. This ratio fell over the course of the quarter. The multiple stood at 2.4 on June 30, 2021, down slightly from 2.5 on March 31, 2021. We estimate the credit multiple threshold range by analyzing the relationship between the subsequent 2-year EMBIG-D credit spread returns and the credit multiple historically. A level that is higher than the upper range of the threshold (currently 2.8) could potentially indicate positive credit returns, while a level below the lower range of the threshold (currently 2.0) could potentially indicate negative credit returns over the next 24-month period. This threshold range estimate is recalibrated on an annual basis. A level within this range would be considered “fair.” Based on this analysis the current multiple of 2.4 would be considered neutral.
Exhibit 1: Long-Term View of the "Fair Market Multiple" for Emerging External Debt
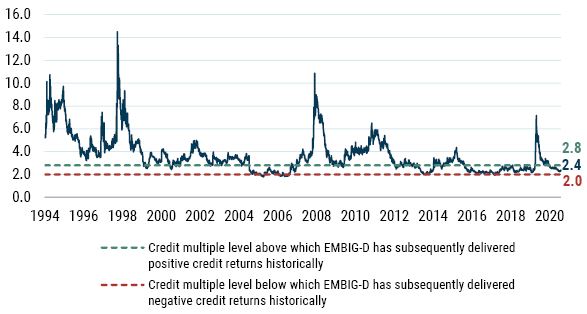
As of 6/30/2021 | Source: GMO calculations based on Bloomberg and J.P. Morgan data
Credit spread tightening was the main reason for the decrease in the multiple over the quarter, as the multiple’s denominator – the fair value spread or expected credit loss – rose marginally by only 4 bps to 143 at the end of June. Regular readers will recall that this fair value spread is a function of the weighted-average credit rating of the benchmark, along with historical sovereign credit transition data and an assumption about recovery values given default. In terms of the second quarter, the fair value spread was influenced by a couple of downgrades including Morocco (BBB- to BB+ in March) and Colombia (BBB- to BB+ in May), while Belize was again placed on Selective Default while undergoing restructuring negotiations with bondholders. Additionally, while Bahrain and Papua New Guinea were placed on Negative Outlook, Romania and Uzbekistan were upgraded from Negative to Stable Outlook, and Vietnam was placed on Positive Outlook.
The preceding was a discussion of the level of spreads, or credit cushion. From a total return standpoint, the level and changes of the underlying risk-free rate also matters. U.S. Treasury yields reversed course from Q1 and trended downward during the quarter, with the 10-year yield falling by 27 bps and having a positive impact on benchmark returns. We measure the “cushion” (which we proxy as the slope of the forward curve) in Treasuries by the slope of the forward curve of the 10-year swap rate, depicted by the light-font lines in Exhibit 2. As long-end U.S. Treasury yields trended downward, the slope of the 10-year forward curve flattened, from 69 bps to 47 bps as of the end of June. This indicates the market is pricing in less of a cushion for rising rates, as the forward curve represents the path that would make an investor indifferent to holding treasuries and cash. We view both the decline in level and slope as reducing the prospective valuation of risk-free rates relative to the previous quarter.
Exhibit 2: 10-Year U.S. Treasury Swap Curves at Quarterly Intervals
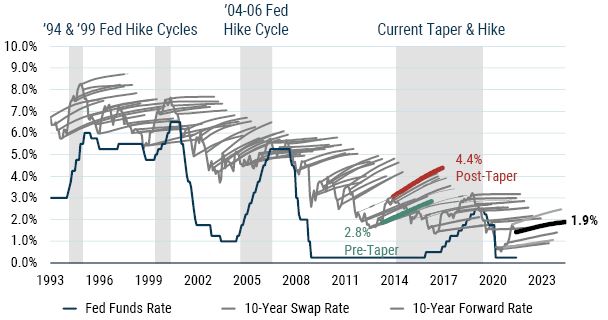
As of 6/30/2021 | Source: GMO
Local Debt Markets Valuation
Exhibit 3 provides a time series of our model’s estimate of the GBI-EMGD’s spot FX valuation. Recall that our model analyzes trends in macroeconomic fundamentals such as balance of payments composition and flows, valuation of the currency, and the economic cycle. It uses regression analysis to produce an estimate of total expected FX returns for each country in the GBI-EMGD benchmark. These are then combined into a single value of a total expected FX return using a market cap weighted average of currencies in the GBI-EMGD. We then deduct the GBI-EMGD weighted carry (interest-rate differential) from the estimated GBI-EMGD weighted value of total FX expected return to get to an expected EM FX spot return. Finally, we estimate a neutral range based on the backtest of the overall model to assess whether EM currencies are cheap, rich, or fairly valued. A value that is higher (lower) than the upper (lower) value of the neutral range could potentially indicate “cheap” (“rich”) currencies. A value that is within the neutral range would be considered “fair.” EM currencies, though not outright cheap, ended June on the cheap end of the neutral range, while remaining attractive relative to the past 10-year average. We note that were one to adopt a more fundamentals-based rather than behavioral- and sentiment-related model, EMFX would look very attractive. Our own decomposition of the model into these categories supports this view and scanning the various sellside and buyside recommendations, it would appear that many use similar valuation-based factors in support of their view in favor of EMFX.
Exhibit 3: GBI-EMGD Expected Spot FX Return Given the Fundamentals
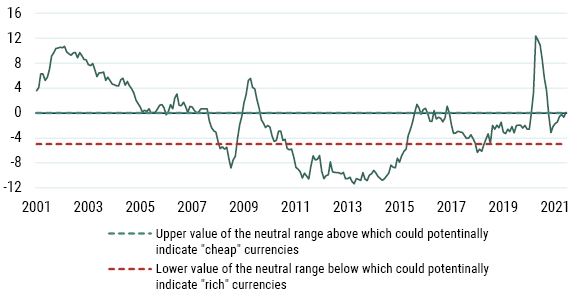
As of 6/30/2021 | Source: GMO
As a final comment on EM currency valuation, we also consider the current valuation of major DM currencies. This is useful to the extent that EM currencies as a complex often present a high beta trade opportunity vs. DM. While our process is focused on EM relative value by design, we do need to consider the overall valuation of major DM currencies to ensure that a secular move of major DM currencies against EM does not negatively affect EM relative value currency opportunities. In this regard when we consider a similar valuation model for EUR and CAD valuation, we find these to be in neutral territory currently. Neither currency is overvalued relative to historic norms, suggesting that a continued focus on EM currency relative valuation is reasonable given current valuations.
As for emerging market local interest rates, we consider differentials in real yields to gauge the relative attractiveness of EM against developed markets (see Exhibit 4). In this regard, the story that has been in place for many quarters (years, actually) remains as we can still see a substantial positive gap between EM and developed market real yields. In fact, emerging real yields look even more attractive on a relative basis against developed markets as that gap even widened further in Q2, despite the fall in emerging real yields by 37 bps to 2.00%. Specifically, the spread between EM and U.S. real yields widened by 52 bps during the quarter, to 352 bps, while the spread between EM and G3 widened by 4 bps to 321 bps. Having been fairly stable for several years running, the 5-year average of the spread between EM and U.S. real yields rose in Q2, from 222 bps to 227 bps. By our calculations, the real yield in the U.S. fell to -1.5% in June from -0.6% in March, while the European real yield (-0.13%) and the Japanese real yield (-0.20%) remain firmly in negative territory.
Exhibit 4: Inflation-Adjusted Bond Yields
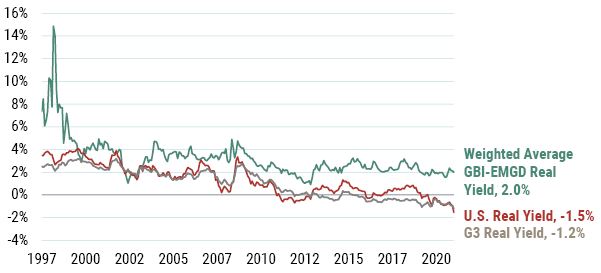
As of 6/30/2021 | Source: GMO
Liquidity – External and Local
One key feature of emerging markets is low baseline and occasionally very poor liquidity. We consider this a feature of emerging markets and GMO’s portfolios seek to manage this risk which extracting well-compensated illiquidity premia as appropriate. Bid-ask spreads typically widen in times of a crisis, most recently in the early days of the pandemic last year. Exhibit 5 depicts this for EMBIG-D, although we’d stipulate that the same behavior occurs in GBI-EMGD bonds and, in extreme events, even EM currency forwards. The EMBIG-D graph is therefore illustrative: bid-ask spreads came in by nearly 150 bps since the high of 2.2% on March 23, ending the quarter at 0.7%.
Exhibit 5: EMBIG-D Bid-Ask Spread (% of price), December 2019 – June 2021
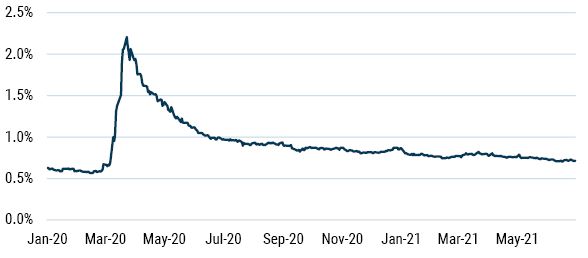
As of 6/30/2021 | Source: GMO, Haver, J.P. Morgan
It is important to note that bid-ask spreads tend to revert to a standard level (historically, 0.8%) after widening during times of crisis, and this time appears to be no different. In Exhibit 6 we see how bid-ask spreads behaved during such crises as the Mexican peso crisis (1995), Russian financial crisis (1998), and the Global Financial Crisis (2008), and their following stabilization. From the pinnacle of the Mexican peso crisis in January 1995, it took roughly 6 months before bid-ask spreads stabilized, and roughly 1 year for bid-ask spreads to stabilize following the Russian financial crisis and the Global Financial Crisis.
We correctly anticipated in the Q1 2020 version of this missive that the stabilization of bid-ask spreads following the impact of the Covid-19 pandemic and oil shocks would be quicker relative to prior crises. Both our external debt and local currency debt strategies emphasize instrument selection and tend to own securities with a lower liquidity profile than the benchmark. We are long-term oriented investors and liquidity providers in this type of market, and our process is able to identify dislocations and opportunities to pick up attractively priced securities. This approach positions us well for alpha versus our benchmarks going forward.
Exhibit 6: EMBIG-D Bid-Ask Spread (% of price), Since December 1993
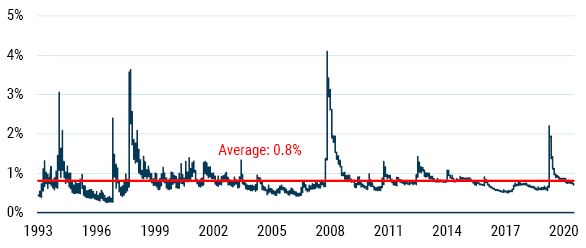
As of 6/30/2021 | Source: GMO
Download article here.