Executive Summary
All 2-sigma equity bubbles in developed countries have broken back to trend. But before they did, a handful went on to become superbubbles of 3-sigma or greater: in the U.S. in 1929 and 2000 and in Japan in 1989. There were also superbubbles in housing in the U.S. in 2006 and Japan in 1989. All five of these superbubbles corrected all the way back to trend with much greater and longer pain than average.
Today in the U.S. we are in the fourth superbubble of the last hundred years.
Previous equity superbubbles had a series of distinct features that individually are rare and collectively are unique to these events. In each case, these shared characteristics have already occurred in this cycle. The checklist for a superbubble running through its phases is now complete and the wild rumpus can begin at any time.
Introduction
In a bubble, no one wants to hear the bear case. It is the worst kind of party-pooping. For bubbles, especially superbubbles where we are now, are often the most exhilarating financial experiences of a lifetime. I participated in a wonderful micro-cap fireworks display from 1968 to 1969, in which I made a small fortune (7 times the then full cost of a year at business school). My main stock, American Raceways, tripled while I was on vacation – $7 to $21 – then went to $100 by Christmas, only to lose it all even quicker by the following June, as almost all the fireworks exploded and crashed. This taught me a lesson, and it helped make me cautious. The experience also makes it easy for me to sympathize with the view that bearish advice in bubbles always comes from old fogeys who “just don’t get it,” because I received that old fogey advice back then and just didn’t listen. I doubt speculators in the current bubble will listen to me now; but giving this advice is my job and possibly the right thing to do. So, once more unto the breach, dear friends.
This time last year it looked like we might have a standard bubble with resulting standard pain for the economy. But during the year, the bubble advanced to the category of superbubble, one of only three in modern times in U.S. equities, and the potential pain has increased accordingly. Even more dangerously for all of us, the equity bubble, which last year was already accompanied by extreme low interest rates and high bond prices, has now been joined by a bubble in housing and an incipient bubble in commodities.
One of the main reasons I deplore superbubbles – and resent the Fed and other financial authorities for allowing and facilitating them – is the underrecognized damage that bubbles cause as they deflate and mark down our wealth. As bubbles form, they give us a ludicrously overstated view of our real wealth, which encourages us to spend accordingly. Then, as bubbles break, they crush most of those dreams and accelerate the negative economic forces on the way down. To allow bubbles, let alone help them along, is simply bad economic policy.
What nobody seems to discuss is that higher-priced assets are simply worse than lower-priced ones. When farms or commercial forests, for example, double in price so that yields fall from 6% to 3% (as they actually have) you feel richer. But your wealth compounds much more slowly at bubble pricing, and your income also falls behind. Some deal! And if you’re young, waiting to buy your first house or your first portfolio, it is too expensive to get even started. You can only envy your parents and feel badly treated, which you have been.
And then there is the terrible increase in inequality that goes with higher prices of assets, which many simply do not own, and “many” applies these days up to the median family or beyond. They have been let down, know it, and increasingly (and understandably) resent it. And it absolutely hurts our economy. Looking back in a decade or two, if bad things have happened to our democracy, the huge surge in income and wealth inequality of the last 50 years (as CEO income moved from about 25x the average worker’s to about 250x) will have carried the largest share of the blame. So, a pox on asset bubbles!
Today – nerd alert – I will cover more of the definitions, the statistics, the history, and the technical details of superbubbles. The bottom line is that in general the bubbles in multiple assets, not just equities, have continued to inflate and therefore the potential pain from a break has increased. As usually happens, the equity bubble begins to deflate from the riskiest end of the market first – as it has been doing since last February. So, good luck! We’ll all need it.
Summary
All 2-sigma equity bubbles in developed countries have broken back to trend. But before they did, a handful went on to become superbubbles of 3-sigma or greater: in the U.S. in 1929 and 2000 and in Japan in 1989. There were also superbubbles in housing in the U.S. in 2006 and Japan in 1989. All five of these superbubbles corrected all the way back to trend with much greater and longer pain than average.
Today in the U.S. we are in the fourth superbubble of the last hundred years.
Previous equity superbubbles had a series of distinct features that individually are rare and collectively are unique to these events. In each case, these shared characteristics have already occurred in this cycle.
The penultimate feature of these superbubbles was an acceleration in the rate of price advance to two or three times the average speed of the full bull market. In this cycle, the acceleration occurred in 2020 and ended in February 2021, during which time the NASDAQ rose 58% measured from the end of 2019 (and an astonishing 105% from the Covid-19 low!).
The final feature of the great superbubbles has been a sustained narrowing of the market and unique underperformance of speculative stocks, many of which fall as the blue chip market rises. This occurred in 1929, in 2000, and it is occurring now. A plausible reason for this effect would be that experienced professionals who know that the market is dangerously overpriced yet feel for commercial reasons they must keep dancing prefer at least to dance off the cliff with safer stocks. This is why at the end of the great bubbles it seems as if the confidence termites attack the most speculative and vulnerable first and work their way up, sometimes quite slowly, to the blue chips.
The most important and hardest to define quality of a late-stage bubble is in the touchy-feely characteristic of crazy investor behavior. But in the last two and a half years there can surely be no doubt that we have seen crazy investor behavior in spades – more even than in 2000 – especially in meme stocks and in EV-related stocks, in cryptocurrencies, and in NFTs.
This checklist for a superbubble running through its phases is now complete and the wild rumpus can begin at any time.
What is new this time, and only comparable to Japan in the 1980s, is the extraordinary danger of adding several bubbles together, as we see today with three and a half major asset classes bubbling simultaneously for the first time in history. When pessimism returns to markets, we face the largest potential markdown of perceived wealth in U.S. history.
The Definition of a Bubble and a Superbubble
We have defined investment bubbles at GMO for over 20 years now by a statistical measure of extremes – a 2-sigma deviation from trend. For a random, normally distributed series, like the sum of tosses of a fair coin, a 2-sigma event should occur once every 44 trials in each direction. This measure is arbitrary but seems quite reasonable.
In real life, though, humans are not efficient (in the economic sense) but are often quite irrational and can get carried away so that 2-sigma outliers occur more often than random – not every 44 years, but every 35 years. We studied the available data across all asset classes over financial history and found a total of more than 300 2-sigma moves.1 In developed equity markets, every single example of a 2-sigma equity bubble in the last 100 years has eventually fully deflated with the price moving all the way back to the trend that existed prior to the bubble forming.
But market extremes do not stop at 2-sigma. I define a superbubble as a 3-sigma event. That would occur in a world of tossing fair coins about once in every 100 events, but in real life appears to occur two or three times more frequently than that. We humans do crazy very well indeed! Yet whether the bubble hits 2-sigma, 3-sigma, or even higher, it still falls all the way back to trend, incurring enormous asset value losses. The key here is that two things are true: 1) the higher you go, the lower the expected future return; you can gorge on your cake now or enjoy it piece by piece into the distant future, but you can’t do both; and 2) the higher you go, the longer and greater the pain you will have to endure to get back to trend – in the current case to a trend value of about 2500 on the S&P 500, adjusted for the passage of time, from whatever high point the market might reach (currently at nearly 4700).
And so it was in the three great bubbles in U.S. assets – equities in 1929 and 2000, and housing in 2006. And so it was, in spades, in the Japanese stock and real estate markets in the late 1980s. All five of these greatest of all bubbles fell all the way back to trend.
The Dangers of Multiple Asset Bubbles at the Same Time
The Japanese case, in particular, made one thing pretty clear: while it is dangerous to have a bubble in equities – for the loss of value can cause a shock through the wealth effect that can get out of control, which was a part of the problem in 1929 and the ensuing slump – it is much more dangerous to have a bubble in housing, and it is very much more dangerous to have both together. The economic consequences of the double bubble in Japan are arguably still playing out. Exhibit 1 shows that neither the equity market nor land have yet recovered their 1989 peaks!
EXHIBIT 1: NIKKEI INDEX AND JAPANESE CITY COMMERCIAL REAL ESTATE, 1980-TODAY
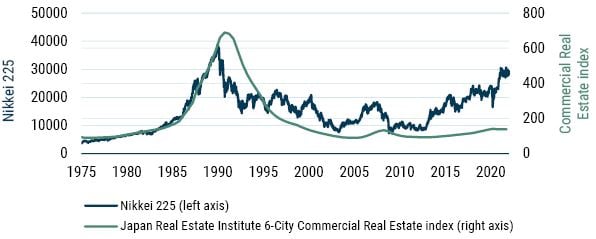
As of 1/7/2022 | Source: Bloomberg
But now, for the first time in the U.S. we have simultaneous bubbles across all major asset classes. To detail:
First, we are indeed participating in the broadest and most extreme global real estate bubble in history. Today houses in the U.S. are at the highest multiple of family income ever, after a record 20% gain last year, ahead even of the disastrous housing bubble of 2006. But although the U.S. housing market is selling at a high multiple of family income, it is less, sometimes far less, than many other countries, e.g., Canada, Australia, the U.K., and especially China. (In China, real estate has played an unusually important and unique role in the extended boom and thereby poses an equally unique risk to the economy and hence the rest of the world if its real estate market loses air exactly as it appears to be doing as we sit.)
Second, we have the most exuberant, ecstatic, even crazy investor behavior in the history of the U.S. stock market. The U.S. market today has, in my opinion, the greatest buy-in ever to the idea that stocks only go up, which is surely the real essence of a bubble. (Interestingly, where other developed countries lead in housing prices, they lag the U.S. in equity prices. Some, such as Japan, by so much that they are merely slightly overpriced today.)
Third, as if this were not enough, we also have the highest-priced bond markets in the U.S. and most other countries around the world, and the lowest rates, of course, that go with them, that human history has ever seen.
And fourth, as gravy (as if we needed any) we have broadly overpriced, or above trend, commodities including oil and most of the important metals. In addition, the UN’s index of global food prices is around its all-time high (see Exhibit 2). These high prices are important as they push inflation and stress real incomes. The combination, which we saw in 2008, of still-rising commodity prices with a deflating asset price bubble is the ultimate pincer attack on the economy and is all but guaranteed to lead to major economic pain.
Exhibit 2: UN FAO Food Price Index
As of 12/31/2021 | Source: UN Food and Agriculture Organization
What our financial leadership should know is that multiplying these risks – these three and a half bubbles – will multiply the total shock if the damage occurs simultaneously. And this package presents more potential for writing down perceived wealth than at any previous time in history. We wrote in 2007 that deflating U.S. housing prices could directly lose $10 trillion or well over half a year’s GDP if house prices declined to moderately below trend – which they did. But at that time the bond market was merely overpriced at the risky corporate end and the stock market merely normally overvalued. (The stock market still halved in price in sympathy, if you will, with the main event – housing and housing-related debt.)2 Yet despite that recent pain, all of the economic and financial dangers that are now building up from multiple major bubbles do not appear to be considered especially dangerous by the Fed or most of its equivalents around the world. In fact, the warning signs appear to be barely noticed at all.
How Did This Happen: Will the Fed Never Learn?
As of today, the U.S. has seen three great asset bubbles in 25 years, far more than normal. I believe this is far from being a run of bad luck, rather this is a direct outcome of the post-Volcker regime of dovish Fed bosses. It is a good time to ask why on Earth the Fed would not only have allowed these events but should have actually encouraged and facilitated them.
The fact is they did not “get” asset bubbles, nor do they appear to today. This avoidance of the issue seemed to us remarkable as long ago as the late 1990s. Alan Greenspan, who I considered then and now to be dangerously incompetent, famously acted as cheerleader in the formation of the then greatest equity bubble by far in U.S. history in the late 1990s and we all paid the price as it deflated.3
Bernanke should have been wiser from the experience of this bubble bursting and the ensuing pain, and he might have moved against the developing housing bubble – potentially more dangerous than an equity bubble as discussed. No such luck! It is pretty clear that Bernanke (and Yellen) were such believers in market efficiency that in their world bubbles could never occur.
This is old territory for me, but I have to admit to enjoying it. Back then, when confronted with a clear 3-sigma event in the U.S. housing market, Bernanke insisted that “the U.S. housing market merely reflects a strong U.S. economy,” and that “the U.S. housing market has never declined.” The information he meant to deliver was unsaid but clear: “and it never will decline because there is no bubble and never can be.” On a purely statistical basis, the history of U.S. house prices had indeed never bubbled before, being so diversified collectively – booming in Florida while coasting in Chicago and falling in California. Until, that is, the sustained excess stimulation of the Greenspan and Bernanke era created a perfect opportunity to finally boom in every region together. And what of the Fed’s statisticians? Picked for either their thick academic blinders or intimidated by the usual career risk we all know and love so well – don’t deliver information your boss doesn’t want to hear – they were totally silent or ineffective.
Whereupon the unprecedented and apparently non-existent housing bubble retreated all the way back to its trend that had existed prior to the bubble, and then quite typically for a bubble, went well below. So, the 3-sigma event came and went, the best looking, most well-behaved bubble of all time (see Exhibit 3), causing profound economic damage to the U.S. and global economies, particularly because of the lack of regulation around the new mortgage-related instruments. Thus, the Fed had for the second time aided and abetted a great bubble forming. And this time the pain was augmented by the housing bust, associated mortgage mayhem, and the ensuing decline in the U.S. stock market – merely badly overpriced but not a bubble – with the combined loss of “perceived wealth” threatening a depression and necessitating an unprecedented bailout and massive, but rather inept, stimulus. Yet, when society looked around to assign blame and process lessons learned, it was as if it tried very hard to miss the point.
Exhibit 3: The U.S. Housing Bubble
As of 12/31/2021 | Source: National Association of Realtors, U.S. Census Bureau, GMO
Yes, Bernanke and Paulson did a perfectly fine job of lobbying Congress for help, etc., after the fact. But overall it was as if the Fed, at the wheel of a titanically-sized economy, had imprudently raced the economy through dangerous waters, ignoring the risks of icebergs so profoundly that the captain deserved a court martial but instead, after the boat sank, was rewarded for doing a serviceable job of helping women and children (and bankrupt bankers at Citi for that matter) into lifeboats. Previously, Greenspan had even fought to help the boat speed up, by trying to bully Brooksley Born at the CFTC to not regulate the growing wave of dangerous subprime instruments. When she refused to back off from a job that was clearly hers, he then resorted to lobbying Congress to change the law to leave these new “demons of our own design”4 altogether unregulated. In this infamous side job, he was joined by Arthur Levitt of the SEC (who apparently on this occasion saw “security” as a dirty word) and one of my favorite Teflon men, Larry Summers. What were they thinking with this reckless behavior? That bankers could regulate themselves? The episode was remarkable in many ways as was our willingness to forget it. But what a good job it did in revealing where Greenspan’s heart really lay – in deregulation.
With the clear dangers of an equity bubble revealed in 2000 to 2002, the even greater dangers of a housing bubble in 2006 to 2010, and the extra risk of doing two asset bubbles together in Japan in the late 1980s and in the U.S. in 2007, what has the Fed learned? Absolutely nothing, or so it would appear. In fact the only “lesson” that the economic establishment appears to have learned from the rubble of 2009 is that we didn’t address it with enough stimulus. That we should actually have taken precautions to avoid the crisis in the first place seems to be a lesson not learned, in fact not even taught. So we settle for more lifeboats rather than iceberg avoidance. And we forgive and forget incompetence and fail to punish even outright malfeasance. (Iceland, pop 300,000, sent 26 bankers to prison; the U.S., pop 300,000,000, sent zero. Zero!)
Bubbles, Growth, and Inequality
Perhaps the most important longer-term negative of these three bubbles, compressed into 25 years, has been a sustained pressure increasing inequality: to participate in the upside of an asset bubble you need to own some assets and the poorer quarter of the public owns almost nothing. The top 1%, in contrast, own more than one-third of all assets. And we can measure the rapid increase in inequality since 1997, which has left the U.S. as the least equal of all rich countries and, even more shockingly, with the lowest level of economic mobility, even worse than that of the U.K., at whom we used to laugh a few decades back for its social and economic rigidity. This increase in inequality directly subtracts from broad-based consumption because, on the margin, rich people getting richer will spend little to nothing of the increment where the poorest quartile would spend almost all of it.
So, here we are again. This time with world record stimulus from the housing bust days, followed up by ineffably massive stimulus for Covid. (Some of it of course necessary – just how much to be revealed at a later date.) But everything has consequences and the consequences this time may or may not include some intractable inflation. But it has already definitely included the most dangerous breadth of asset overpricing in financial history. At some future date, when pessimism rules again as it does from time to time, asset prices will decline. And if valuations across all of these asset classes return even two-thirds of the way back to historical norms, total wealth losses will be on the order of $35 trillion in the U.S. alone.5 If this negative wealth and income effect is compounded by inflationary pressures from energy, food, and other shortages, we will have serious economic problems.
Some Last-Minute Color on Market Frenzy and Breadth
The penultimate phase of major bubbles has been characterized by a “blow-off” – an accelerating rate of stock price growth to two or three times the average of the preceding bull market. This pattern was shown as clearly as any of history’s other great superbubbles in 2020 (see Exhibit 4).
Exhibit 4: Stock Market Superbubbles Have Blow-off Tops
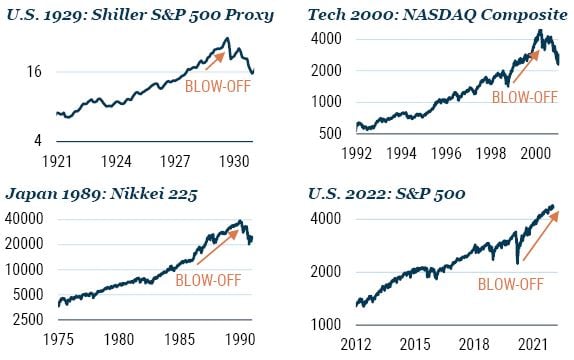
As of 1/14/2022 | Source: Robert Shiller, DataStream
As for speculative madness, there were already many fantastic bubble anecdotes from 2020, which I wrote about last year.6 Since then, the anecdotes have been even better. We’ve had:
- The meme stock madness of GME and AMC – two companies in declining industries further decimated by Covid-19 – that managed to rally 120x and 38x, respectively, from their post-pandemic lows to their 2021 highs, driven by message board sentiment, taking GME briefly to 20% of the entire Russell 2000;
- The dogecoin phase, in which a cryptocurrency conceived as a parody of the crypto craze went up nearly 300x, to a market cap of $90 billion because Elon Musk kept joking about it; and
- La pièce de résistance: after Hertz (one of 2020’s meme stock stars) saw a quick stock surge from announcing it would purchase a fleet of Teslas, Avis rather plaintively said something like, “Hey dudes, we might buy electric cars too,” and tripled in a day!
But – as fits the final “narrowing market” phase of a great bubble – most of these events are now well in the past, and the last six months have seen a growing numbness to the euphoria (see Exhibit 5). GME, AMC, dogecoin, and more than one-third of all NASDAQ stocks are now all down more than 50% from their highs. Bitcoin is down over 40%, and my own unfortunate Quantumscape, which 13 months ago was worth more than GM (1929 had many extreme speculations but nothing on this scale), is down from its December 2020 peak by 83%. Ouch!
Exhibit 5: Biggest and Highest Quality Stocks Carried the Market in 2021
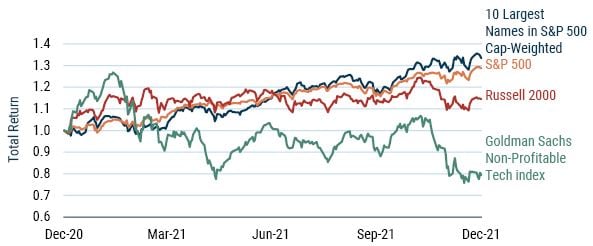
As of 12/31/2021 | Source: Bloomberg, Goldman Sachs, GMO
The Death of the Vampire
In the meantime, we are in what I think of as the vampire phase of the bull market, where you throw everything you have at it: you stab it with Covid, you shoot it with the end of QE and the promise of higher rates, and you poison it with unexpected inflation – which has always killed P/E ratios before, but quite uniquely, not this time yet7 – and still the creature flies. (Just as it staggered through the second half of 2007 as its mortgage and other financial wounds increased one by one.) Until, just as you’re beginning to think the thing is completely immortal, it finally, and perhaps a little anticlimactically, keels over and dies. The sooner the better for everyone.
What to Do as an Investor?
GMO has a detailed set of recommendations available that I agree with. A summary might be to avoid U.S. equities and emphasize the value stocks of emerging markets and several cheaper developed countries, most notably Japan. Speaking personally, I also like some cash for flexibility, some resources for inflation protection, as well as a little gold and silver. (Cryptocurrencies leave me increasingly feeling like the boy watching the naked emperor passing in procession. So many significant people and institutions are admiring his incredible coat, which is so technically complicated and superior that normal people simply can’t comprehend it and must take it on trust. I would not. In such situations I have learned to prefer avoidance to trust.)
Appendix
Inflation and Explaining P/E
Today’s bubble depends on ignoring 100% of current inflation
GMO Explaining P/E Model
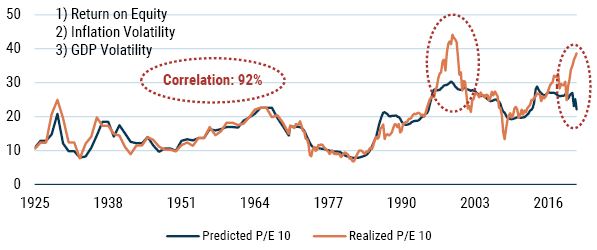
As of 12/31/2021 | Source: GMO
GMO’s model to explain P/E is dominated by two factors: inflation, which multiples hate, and profit margins, which they love. Since the data starts in 1925, inflation surges had always hurt multiples badly…until now. Currently, inflation is 100% ignored…for now.
|
|
Rules of The Bubble Reviewed (For Distracted Readers)
a. A speculative investor frenzy that generated stories for distant decades, which we have had for well over a year; b. A penultimate blow-off phase where stock gains accelerate, as we had in 2020; c. And the ultimate narrowing phase – unique to these few superbubbles – where a decreasing number of very large blue chips go up as riskier and more speculative stocks underperform or even decline, as they did in 1929 and 2000 and as they have done since February 2021. If a, b, and c are accounted for, light the blue touchpaper8 and retire to a safe distance, praying for a paradigm shift. |
|
Addendum
Making Money and Reducing Risk in an Equity Superbubble
Matt Kadnar | January 2022
Navigating the career risk associated with bubbles (especially superbubbles) has always been tricky and is one of the biggest failings in the investment management industry.9 We at GMO dedicate ourselves to trying to get the big picture calls right. Extreme market environments, similar to the one we are experiencing currently, are where we have historically been able to add significant value to investors’ portfolios. As the table shows, we have made some unconventional moves and owned some very unconventional portfolios in the face of market extremes.
Bubble |
GMO Position |
| 1989 Japanese Equity Bubble | Zero weight in Japan in International Equity portfolio |
| 1999 TMT Bubble | Reduced equity, focus on Value stocks, REITs, and bonds |
| 2007 Global Financial Crisis/Risk Bubble | Reduced equity, focus on U.S. Quality and long/short strategies |
|
|
Reduced equity, focus on non-U.S. Value and alternative strategies; Equity Dislocation at 20% (designed to profit from Growth bubble bursting); modest fixed income, no Treasuries, and only specialized credit |
As we move through the fourth “bubble era” in GMO’s history, we have once again positioned our Asset Allocation portfolios to reduce risk and take advantage of what we believe will be a generational opportunity for adding alpha through asset allocation.
Equity Dislocation: Betting on the Bubble in Growth Stocks Bursting
While the overall U.S. market is in bubble territory as Jeremy has outlined, the epicenter of the bubble – both at home and abroad – is concentrated in Growth stocks. As such, the largest risk position in our flagship Benchmark-Free Allocation Strategy (as well as in our Alternative Allocation Strategy) is long a global portfolio of Value stocks and short a global portfolio of Growth stocks. To build these portfolios, we use a proprietary definition of “Value” and “Growth” that aims to assess the intrinsic value of companies and provides, in our view, a better lens on valuation than traditional value metrics or indices. This approach has proved to be incredibly successful: in an unusual year like 2021, where Value beat Growth by 200 bps globally, our custom approach generated alpha of approximately 1,500 bps. We believe significant room remains for this holding to continue its strong outperformance. This portfolio is available for direct investment via the Equity Dislocation Strategy. We also have worked with a client to build a pure U.S. Growth short portfolio, with a focus on the most expensive names in the Growth universe. We believe this particular type of portfolio is an excellent hedge to the significant gains many have experienced via investments in technology-focused private equity and venture capital.
Limited Equity Risk and Focus on Most Attractive Pockets (Value, Quality, Thematic)
Outside of long/short strategies, we have reduced our equity risk considerably and emphasized non-U.S. stocks, which we believe are considerably cheaper than their U.S. counterparts. We have concentrated our exposure to non-U.S. Value stocks globally, including those in Emerging Markets and Japan. To us, these stocks look very cheap relative to the U.S. and in the case of Emerging Markets and Japan Value, particularly Japanese Small Value, they are attractive in absolute terms as well. Japan also benefits from secular tailwinds related to shareholder-friendly reforms and improved profitability and return on shareholder equity.10
In our Global Equity and our benchmark-sensitive Global Asset Allocation portfolios, we have also maintained an allocation to our Quality Strategy, managed by our Focused Equity team and generally composed of outstanding companies with deep moats, low levels of leverage, and consistent, high, profitability. We have seen clients who still want to maintain an allocation to Growth but are cautious about overall valuations allocate to our Quality Strategy. Quality generally has growthier characteristics, but because of our focus on valuation, our Quality Strategy is now more highly correlated to Value than at any point in the last 20 years. Resource equities, which are largely a segment of Value, also look cheap relative to the rest of the world. We have also seen clients allocate to our Resources Strategy as a hedge against inflation. Finally, Jeremy has made a compelling case for owning our Climate Change Strategy, which seeks to take advantage of opportunities related to mitigating the effects of climate change. The Resources and Climate Change portfolios are also managed by our Focused Equity team that, critically, maintains a significant valuation discipline in their stock selection.
Making Money While Reducing Risk
Navigating bubbles is fraught with all types of risk – absolute, relative, and career. This time is no different: when mean reversion will begin is inherently unknowable. However, there remain significant opportunities to make money and reduce risk in today’s market, just as there were in 1987, 1999, and 2008. We know that selling winners and rebalancing into losers is good investment discipline but incredibly difficult to do for a whole host of behavioral reasons. That investment discipline is particularly critical given the risks Jeremy has articulated.
Download article here.
* With reference to Maurice Sendak’s “Where the Wild Things Are."
1 Of these, over 90% reverted to the old mean; almost 10% appeared to be paradigm shifts that persisted for decades. These 10%, however, were all in commodities, whose finite nature might suggest the possibility of permanent shortages and resulting price shifts – as has occurred in oil (whose old trend line for 70 years was about $23 in today’s currency); or in real estate where zoning restrictions have caused increasing shortages; or in a very few cases in equity markets in developing economies where prior to economic and financial development valuations had been extremely low.
2 It is worth noting, though, that in 2007 the U.S. house building industry had expanded to build an extra million houses, with all the stimulus to realtors et al., and retrenched by 2010 and 2011 to a half million fewer houses than normal. This drop packed a powerful punch and accounted for much of the depth of the recession and its resistance to stimulus. For a glimmer of good news, although our house prices in the U.S. are even more unaffordable and even more vulnerable than in 2006, at least the house building industry is only jogging along more or less normally now.
3 Note that the 2000 tech bubble was accompanied by unusually cheap bond markets (TIPS at 4.3%!); cheap real estate (REITs yielding over 9%); even cheap value stocks – it was focused solely on U.S. growth stocks and still we suffered from the negative wealth effect when it burst.
4 From the title of the excellent book by Richard Bookstaber.
5 The back-of-the-envelope calculation goes like this:
-
Currently, the U.S. nonfinancial corporate sector is worth $48 trillion. If cyclically-adjusted P/Es fall from their current level of nearly 40 to 25 – which would still be among the highest valuations ever recorded prior to 1997 – this would be a 37% loss of value, over $17 trillion.
-
U.S. households own real estate worth $41 trillion. Current Census data on median household incomes and median home sale prices suggest a price to income ratio of about 5.5 after accounting for a considerable estimated increase in incomes in 2021 (last datapoint was 2020). If this ratio returns to 4.0 – which is well above any levels prior to the mid-2000s housing bubble – this would be a 27% loss of value, over $11 trillion.
-
U.S. Treasury, agency/GSE, and corporate debt securities outstanding come to about $24 trillion, $11 trillion, and $15 trillion, respectively. We can quite conservatively estimate the duration of these three sectors at 5 years, 4 years, and 7 years, respectively. If rates rise a mere 2% – from current levels of -0.7% for 10-year TIPS, this would take us to only 1.3% real at the long end, still significantly below historic norms – and if corporate spreads rise only 0.5% on top of that, losses on debt securities would total about $6 trillion.