Executive Summary
As GMO launches its first ETF, it seemed like a good time to share my thoughts on the market inefficiency that the strategy seeks to exploit – the quality anomaly. The basic goals of any active investor are to achieve higher returns and/or lower risk than a passive portfolio. These goals are, or at least should be, in conflict with each other. If financial markets were efficient, it would be impossible to sustainably achieve higher returns without taking on additional risk. And any portfolio that embodied lower risk would pay for it with lower long-term returns. At the highest level, markets basically work this way. Government bonds and cash are lower risk than high yield bonds and equities and have delivered lower returns across almost all markets and most time periods. But within risk assets, things get weird. Within both stocks and high yield bonds, you have historically been able achieve both higher returns and lower risk by owning the highest quality securities in those universes. This quality anomaly has been around for a long time and exists within multiple subsets of the equity universe. And for what it is worth, their opposite numbers have also been mispriced – low-quality stocks and CCC (and below) bonds have underperformed their broad universes despite their obviously greater downside in bad economic times. In an investing world where most trade-offs are difficult, this one is pretty easy. If you were going to have one permanent bias in your equity and high yield bond portfolios, it should be in favor of high quality.
The mispricing of quality
You may recall our spring edition of the Quarterly Letter, in which Tom Hancock and Lucas White wrote at some length about the quality anomaly in the stock market. 1 My goal in this piece is to expand on their work and show that the quality anomaly exists within multiple areas of the stock market and in the high yield market as well. But to start, it is worth a brief recap of some of my colleagues’ data. Exhibit 1, taken from their piece, shows the pattern of return and volatility for the highest and lowest quality quartiles of the MSCI ACWI stock index.
EXHIBIT 1: HIGH AND LOW QUALITY STOCK PERFORMANCE
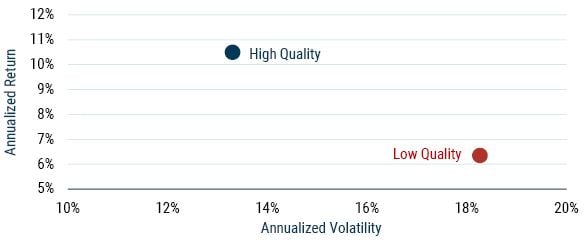
As of 12/31/2022 | Source: MSCI, GMO
The high-quality and low-quality portfolios are based off the MSCI ACWI Index returns. GMO uses a proprietary quality model and defines high-quality companies as those with high profitability, low profit volatility and minimal use of leverage. Low-quality companies are the inverse. High-quality and low-quality groups are based off quartiles within the MSCI ACWI Index.
The fact that high-quality stocks have had lower volatility than low-quality ones should not come as a surprise to anyone. But their relative performance is another matter. In an efficient market, those risky low-quality stocks should offer a higher return to compensate for their higher risk, and owners of high-quality stocks should pay for their peace of mind in the form of a lower long-term return. The fact that the highest quality quartile of the market has outperformed the lowest quality quartile by 4% per year is utterly counterintuitive, astonishing, and demands to be incorporated when building sensible equity portfolios.
You might be tempted to think that this is some historical exception that is unlikely to repeat. But if we look at the performance of high- and low-quality bonds within the high yield universe, we see a strikingly similar pattern.
EXHIBIT 2: BB AND CCC BOND PERFORMANCE
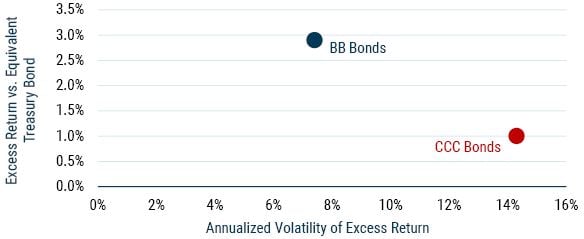
Data from 1988-2023 | Source: Bloomberg, Barclays Point, GMO
BB bonds and CCC bonds are the Bloomberg BB U.S. Corporate Bond Index and the Bloomberg CCC U.S. Corporate Bond Index, respectively.
Since CCC bonds tend to have shorter maturities than BBs, we need to make a duration adjustment to properly compare them, but the pattern is every bit as striking as it is in equities. 2 BB bonds have had excess performance over comparable Treasuries that is almost 2% per year better than their CCC brethren and have done so with half the volatility.
It is worth recognizing that this is an insane result. It’s not just that CCC bonds are more volatile than BBs, they are hugely more economically sensitive. On average, about 1% of the BB universe defaults in a given year, and that might rise to 2-3% in a recession. CCCs, on the other hand, see defaults of over 10% in an average year, and that default rate can rise into the 30% range and beyond in a tough default cycle. 3 For that kind of downside in bad economic times, CCCs really do need to deliver higher long-term returns for them to be an appealing investment – but they are seldom priced to do so.
Given this, the immediate question is why anyone would not bias their equity and high yield debt portfolios toward high quality? At GMO, we do exactly that. The GMO Quality Strategy, for example, only owns stocks in the top tier of quality across the global equity universe. As a result, we strongly believe that the Quality Strategy will suffer substantially less fundamental impairment in the event of a severe economic downturn than would be the case for the market as a whole. 4 While in a rational world such a feature would also suggest that the portfolio should struggle to keep up with the broad market in the long term, neither our 20 years managing the Quality Strategy nor the longer history of high-quality stocks in our databases nor the current valuations of the quality group or their portfolio suggests that the market is anything close to rational on this front.
Quality within more cyclical groups
But it’s not only in the very highest quality tier of stocks that quality is an advantage. You could make a reasonable argument that the places where higher quality is most essential are within the more cyclical areas of the market. 5 The greater financial strength of the higher quality companies in these sectors allows them to take advantage of opportunities that arise in bad economic times when their competitors are more concerned with mere survival. Exhibit 3 shows the performance of high- and low-quality stocks within the global cyclical universe.
EXHIBIT 3: HIGH AND LOW QUALITY WITHIN GLOBAL CYCLICALS
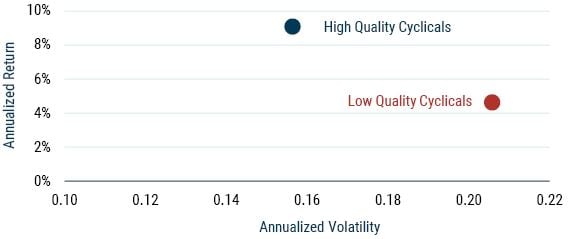
Data from 1995-2023 | Source: MSCI, Worldscope, GMO
The high-quality and low-quality cyclical portfolios are based on MSCI ACWI Index returns. GMO uses a proprietary quality model and defines high-quality companies as those with high profitability, low profit volatility and minimal use of leverage. Low-quality companies are the inverse. Global cyclicals are the most cyclical third of industries by market capitalization. High quality and low quality are the top 25% and bottom 25% of stocks within those industries, respectively.
If you are looking for the stocks with the very lowest vulnerability in bad economic times, limiting your focus to the very highest quality stocks is the path to go down. But the advantages of relatively high quality exist within pretty much every group of stocks one can contemplate. This is particularly notable in one notoriously low-quality area of the market, U.S. small cap stocks. 6 As we pointed out in GMO’s last quarterly letter, 7 the rise in interest rates and changes in U.S. tax policy have created a particular issue for highly levered U.S. companies, and U.S. small caps have substantially increased their leverage since the Global Financial Crisis.
While current profitability for the average U.S. small cap company is very good relative to their history, the group is highly cyclical and their profits generally dry up quickly in an economic downturn. Exhibit 4 shows the profitability of U.S. small caps over time.
EXHIBIT 4: RETURN ON CAPITAL OF U.S. SMALL CAP STOCKS
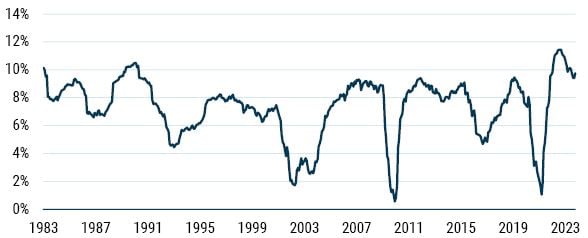
Data as of 10/2023 | Source: Worldscope, Compustat, GMO
U.S. small caps are the smallest 33% of U.S. publicly traded companies by market capitalization.
Were small caps to see a similar fall in profitability as they have seen on average across recessions, the ability of a typical small cap company to cover its interest payments would become quite challenged. Biasing a U.S. small cap portfolio toward higher quality issuers makes a lot of sense from a risk standpoint, as long as it doesn’t interfere too much with the expected returns. As Exhibit 5 shows, the historical data makes a quality bias within U.S. small cap stocks look like a complete no-brainer. 8
EXHIBIT 5: HIGH AND LOW QUALITY WITHIN U.S. SMALL CAPS
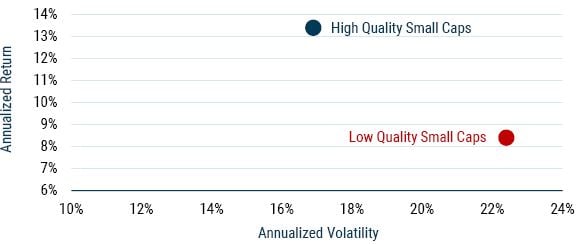
Data from 1983-2023 | Source: Worldscope, Compustat, GMO
U.S. small caps are the smallest 33% of U.S. publicly traded companies by market capitalization. GMO uses a proprietary quality model and defines high-quality companies as those with high profitability, low profit volatility and minimal use of leverage. Low-quality companies are the inverse. High quality and low quality are the top 25% and bottom 25% of stocks within the small cap universe, respectively.
Quality and value
In our asset allocation portfolios today, our biggest equity bet is deep value – the cheapest 20% of stock markets. As I wrote in June, value stocks generally do fine in recessions, 9 but that hasn’t stopped us from wanting to ensure our deep value portfolios are fundamentally well positioned should an economic downturn come. The trade-offs here are a little more complicated, however. If the reason we favor deep value today is because it is so cheap relative to its history, we need to be careful that in biasing the portfolio toward higher quality value stocks we aren’t systematically buying into a portfolio that is less attractively priced. The general pattern of high and low quality within value stocks looks pretty much the same as it does for all the other groups, as shown in Exhibit 6.
EXHIBIT 6: HIGH AND LOW QUALITY WITHIN U.S. VALUE STOCKS
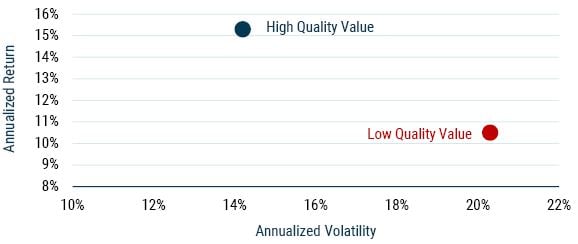
Data from 1983-2023 | Source: Worldscope, Compustat, GMO
U.S. value stocks are the cheapest half of the largest 1,000 U.S. companies on a composite valuation model. GMO uses a proprietary quality model and defines high-quality companies as those with high profitability, low profit volatility and minimal use of leverage. Low-quality companies are the inverse. High quality and low quality are the top 25% and bottom 25% of stocks within the value universe, respectively.
It could still be the case that today, tilting a value portfolio toward higher quality stocks makes it materially less cheap relative to the market. Happily, that isn’t the case. Exhibit 7 shows the valuation relative to normal for two versions of U.S. deep value. The first is the traditional cheap price/book portfolio popularized by Fama and French. The second is the version of value that we use in GMO’s Opportunistic Value Strategies, where we are both adjusting company income statements and balance sheets for distortions and giving credit to higher quality companies for their higher expected long-term return on capital.
EXHIBIT 7: RELATIVE VALUATIONS OF CHEAPEST 20% OF U.S. LARGE CAP STOCKS WITH AND WITHOUT QUALITY ADJUSTMENT
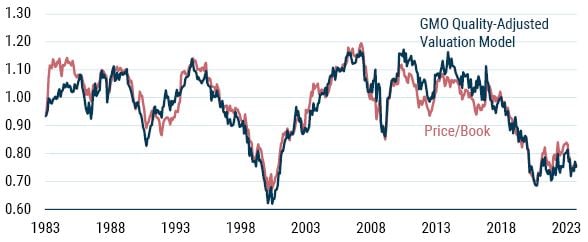
Data as of 10/2023 | Source: Worldscope, Compustat, GMO
Price/book is the cheapest 20% of the largest 1,000 U.S. stocks by market capitalization. Quality-adjusted value is a blend of value models used by the GMO Opportunistic Value portfolios that adjusts value metrics according to the quality of companies derived from GMO’s proprietary quality model. Both groups are measured on a blend of valuation models and adjusted for their average valuation over time.
Both deep value groups look very cheap versus history. While it could have been the case you needed to buy low-quality value to find a group trading much cheaper than average, that is not at all what we find. Our quality-adjusted valuation model is as cheap versus its history as price/book is, and its average company quality is much higher, as shown in Exhibit 8. Investing isn’t supposed to be easy, but even within deep value the calculus seems awfully straightforward. When you can get higher quality without having to pay more, why on earth wouldn’t you?
EXHIBIT 8: QUALITY RANKING VS. MARKET FOR DEEP VALUE GROUPS
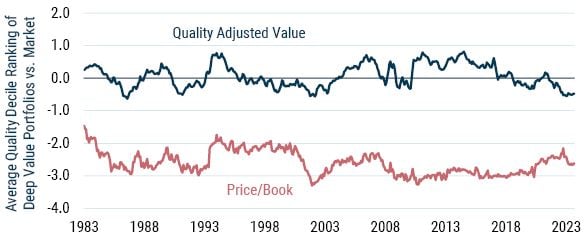
Data from 1/1983 to 9/2023 | Source GMO
Price/book is the cheapest 20% of the largest 1,000 U.S. stocks by market capitalization. Quality-adjusted value is a blend of value models used by the GMO Opportunistic Value portfolios that adjusts value metrics according to the quality of companies derived from GMO’s proprietary quality model. Both groups are being measured on their average quality relative to the overall market on a measure where the lowest quality company would get a -5.5 and the highest quality company would get a +5.5.
Quality within high yield
The trade-offs in the high yield universe are a little more complicated, even if the basic performance pattern is the same. BB bonds are unquestionably a hugely better risk/reward trade off than lower rated high yield most of the time. On the other hand, they have a lot less beta to high yield than lower rated bonds do. The high/low-quality axis in stocks also has something of a beta impact, but high-quality stocks have a wonderfully asymmetrical upside/downside beta to the stock market, whereas low-quality stocks look positively toxic, as we can see in Exhibit 9. High-quality stocks have a slightly low beta in up months for the stock market, at 0.91. But in the down markets, that beta falls to 0.71. Meanwhile low-quality stocks only have a mildly higher-than-normal beta in up months for the stock market at 1.06, but it moves substantially higher exactly when you don’t want it to, rising to 1.23 in down months.
EXHIBIT 9: UPSIDE AND DOWNSIDE BETAS FOR HIGH AND LOW QUALITY STOCKS
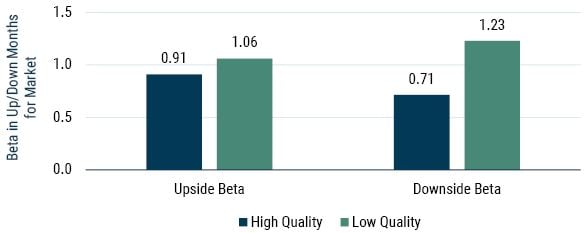
Data from 1988-2022 | Source S&P, MSCI, GMO
GMO uses a proprietary quality model and defines high-quality companies as those with high profitability, low profit volatility and minimal use of leverage. Low-quality companies are the inverse. Upside beta and downside beta are beta to the MSCI ACWI Index during up months and down months, respectively.
In May, Tom and Lucas posited that the mild underperformance by high-quality stocks in up markets might help explain the quality anomaly, since investors are particularly obsessed with keeping up with the market in good times. They might be right, but the beta difference of high and low quality in good times is actually pretty small, at 0.15. In down markets, the difference explodes to 0.52. That means high-quality stocks outperform low-quality stocks in down months by over three times the amount they underperform in up months! 10 It’s an astonishingly favorable trade-off that I can’t imagine any investor would want to pass up. 11
In high yield, the betas are much more symmetrical, as shown in Exhibit 10.
EXHIBIT 10: UPSIDE AND DOWNSIDE BETAS FOR BB AND CCC BONDS
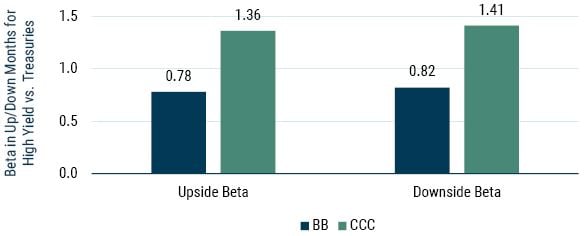
Data 1988-2023 | Source: Bloomberg, Barclays Point, GMO
Upside beta and downside beta are beta to the Markit iBoxx USD Liquid High Yield Corporate Index during up months and down months, respectively. BB bonds and CCC bonds are the Bloomberg BB U.S. Corporate Bond Index and the Bloomberg CCC U.S. Corporate Bond Index, respectively.
BB bonds are extremely helpful in the down months for high yield bonds with a downside beta of only 0.82 versus a scary 1.41 for CCC bonds. But their underperformance in the up months is every bit as striking, with an upside beta of 0.78 versus 1.36 for CCC. This creates a trickier problem for high yield bond managers than the one equity managers face. BBs are a hugely better risk/reward trade-off than CCCs, but they also don’t act all that much like high yield. In terms of the underlying fundamentals of the companies issuing the debt, BBs are a lot more like investment grade bonds than they are like CCCs. That is probably even more true today than it used to be given how concentrated the investment grade corporate bond market has become in BBB-rated bonds, which now make up approximately half of the U.S. investment grade corporate bond universe against less than 10% in AAA or AA bonds. 12
This can put high yield bond managers in a bit of a bind if they want to deliver good long-term returns and build a portfolio that acts like a high yield portfolio. This was exactly the problem we asked GMO’s fixed income team to solve when we asked them to build a liquid high yield bond strategy in 2018. Their resulting portfolio spends the majority of its time with a higher average rating than the index, but if spreads on low-quality bonds are particularly attractive, it stands ready to shift that stance toward lower rated bonds. The strategy has made that shift on several occasions over the five years the team has been running it. As a result, we have been able to combine a beta of approximately 1.0 to high yield with decent alpha and good risk mitigation. 13
Today, with credit spreads surprisingly tight despite meaningful economic risks and CCC bonds trading substantially inside their fair value spread on our data, we have a pronounced high-quality bias within the High Yield Strategy, and given the risks we pointed out in U.S. corporates in our last quarterly letter, we think such a bias makes a lot of sense for any investor who is not supremely confident in their idiosyncratic abilities to analyze risky bonds. 14
Conclusion
This is the part of the essay where I’d normally try to summarize my views on why the anomaly in question exists. But in this case, I have trouble coming up with anything at all plausible that doesn’t come down to “investors are weirdly stupid.” Financial markets are not supposed to work backward, and when one is looking at asset classes, they generally don’t. Government bonds reliably have lower long-term returns than risky credit and stocks, and this makes perfect sense given how much better government bonds do in bad economic times. But within equities and high yield, things really seem to have worked exactly backward, and they have done so for a very long time. You have been able to get higher returns and lower risk by buying high-quality stocks and BB bonds, and the lower quality stocks and CCC bonds have been a long-term disaster for investors. This is not merely an ex post observation. When Jeremy Grantham and Dick Mayo were picking stocks back in the early 1970s, they gave extra credit to high-quality companies because they already knew that high-quality companies tended to do better than they were given credit for. A decade later, when GMO created its first quantitative stock selection models to systematize what Jeremy and Dick had been doing on a stock-by-stock basis, we built in a high-quality bias for the very same reason.
We have known about the quality anomaly for a long time. That doesn’t mean we are confident we know why it exists. We’ve found a few explanations that seem as if they might be part of the answer, but nothing that’s entirely satisfying. Part of the high-quality effect in stocks seems to have been driven by the underappreciated advantages of companies with significant monopoly power, compounded by a general trend (until very recently) toward less regulation of dominant companies. And while that might help explain some of the quality advantage among the very largest companies, the quality effect among small companies is at least as pronounced – and small firms (even the high-quality ones) are not really monopolists. The highest quality companies are also particularly concentrated in a handful of industries – Health Care, IT and Communications Services in particular – and those industries have generally outperformed over the past few decades. 15 But the high-quality effect within cyclical industries has been quite strong, so even that can’t possibly be the whole story.
The most plausible argument I have come up with for why high quality doesn’t underperform as theory says it should comes from the incentives of portfolio managers. Active equity managers are paid to try to outperform the broad market. If there was a stock that they were convinced would underperform the market in the long run, it would be an unappealing holding even if they believed the underperformance was a rational trade-off for lower fundamental risk. You could make a similar argument in the high yield bond market. If BB bonds generally underperformed riskier bonds, many high yield investors would have a hard time holding them, or at least they would want to own a smaller weight than their benchmarks. In a world where the preferences of active stock and bond managers set pricing, you could therefore come up with a reasonable behavioral argument as to why high quality is not priced to underperform. But that explains neither why high quality outperforms the market, nor why lower quality stocks and bonds do as poorly as they do. Behavioral explanations for that side of the anomaly tend to focus on the fact that low-quality companies tend to have a positive skew to their returns. That positive skew gives them something of a lottery ticket payoff pattern that people have shown to consistently overpay for. That can’t do much to explain the poor performance of CCC bonds, however, as a risky bond’s return is usually negatively skewed.
There is no lack of academic literature on quality and related topics, and my apologies to any whom I’ve offended by not citing a particular paper. I can’t claim to have read everything, but I can say that I have yet to come across anything particularly persuasive as to why the anomaly exists. The lack of credible explanations as to why high quality “should” outperform demands that we be alert to the fact that this might change in future. We aim to take a “trust but verify” stance with regard to our investment beliefs at GMO. It is dangerous to assume that the circumstances that caused your favored securities to be attractive still pertain. In the case of the quality anomaly though, the plausible change in circumstance almost certainly needs to involve investors bidding up the valuation of higher quality securities and bidding down the valuations of low-quality ones to the point where the fundamental advantages of high-quality companies are fully counteracted by their higher valuations. As long as we see no evidence that this has already occurred, a move to that efficient pricing actually constitutes an upside opportunity for higher quality stock and BB bond holders, since getting there involves a windfall gain for high-quality securities as their valuations rise.
As a result, the case for building in a quality bias to your stock and high yield credit portfolios is extremely strong. Even today, at a time where we in the Asset Allocation team believe that deep value stocks are the best opportunity in equity markets, we see no need to compromise on quality to take advantage of the value mispricing. Higher quality deep value stocks are as cheap versus their history as more standard ways to define deep value are, making them an even more compelling buy in our view. But whether or not you agree with me about today’s value opportunity, I can’t imagine why any investor wouldn’t want to find a way to bias their equity and high yield portfolios in favor of high quality.
Download article here.
See The Quality Spectrum: Stability in an Unstable World (May 2023).
The chart would actually look similar if I plotted raw returns of the two groups, but the comparison wouldn’t be fair as it mixes two sources of return and risk (duration and credit exposure) with very different characteristics.
There is a little hand-waviness to this, I’ll admit, but not a lot. Default is not the only bad thing that can happen to a bond. It can also be downgraded. While about 1% of BBs default in a given year, perhaps 8.5% will get downgraded, and those downgraded bonds invariably fall in price when the downgrade occurs. CCCs have the consoling feature that in the absence of actually defaulting, rating agencies generally don’t bother with CC or C ratings and even when those ratings are used, there isn’t that much price action on average since CCCs are already very low-quality bonds. Upgrades happen as well, of course, with 7-8% of high yield bonds getting upgraded in a given year. CCCs have the advantage that they basically only get upgrades, not downgrades. BBs, though, have a nice feature of their own. If a BB bond gets upgraded, it graduates out of the high yield universe and becomes ownable by a new group of investors that cannot own lower rated bonds. That gives an extra boost to those upgraded bonds (i.e., “rising stars”) that no other rating cohort enjoys.
There is no guarantee that that smaller fundamental impairment will lead to better market performance in an economic downturn. If the high-quality stocks are trading at too large a premium to the rest of the market, their relatively small fundamental impairment still might be a bigger disappointment to investors than the larger hit the rest of the market will take. Not even high-quality stocks are safe against material overvaluation.
GMO’s Quality Cyclicals Strategy, launched in 2020, was designed to exploit this advantage.
It’s a less acute problem in the rest of the developed world, generally speaking. While interest rates have gone up significantly everywhere apart from Japan, no other country has enacted the tax changes the U.S. did, and in most of the world small caps are less levered than they are in the U.S. Japan is a double outlier on this, since not only have interest rates not gone up much in Japan, but Japanese corporates have continued to de-lever over the past decade, such that the average listed Japanese non-financial has almost no net debt. UK small caps are the most similar to the U.S., as they too have levered themselves up substantially in the past 20 years and interest rates have gone up sharply there as well.
See Beyond the Landing: The Macro Risks Still on the Runway (September 2023).
GMO launched the Small Cap Quality Strategy in 2022.
See Value Does Just Fine in Recessions (June 2023).
To be clear, I’m talking about returns relative to the market. High-quality stocks underperform the market by about 0.3% in the average up month for the market and low quality outperforms by about 0.2%. In down months, high quality outperforms the market by 1% on average and low quality underperforms by 0.8%. That’s an aggregate difference of 0.5% in favor of low quality in up months and 1.8% in favor of high quality in down months.
GMO’s Quality Spectrum Strategy is explicitly exploiting this amazingly favorable asymmetry by going levered long high-quality stocks against a smaller low-quality short, resulting in a portfolio that we believe can deliver most of the upside of the stock market in good times and much less downside in the bad times.
As of August 2023, BBB bonds made up about 48% of the Markit iBoxx USD Liquid Investment Grade Index. AAA bonds were 1% and AA bonds were just over 7%.
Specifically, as of November 2023, the High Yield Strategy has delivered an average annual outperformance versus the Markit iBOXX USD Liquid High Yield Index of 1% net of fees since inception, with a beta of 0.96 and outperformance in each of the meaningful drawdowns in the asset class since inception—there have been three drawdowns of more 3% since 2018 and we outperformed on average by 1% (net) across them.
Personally, I can’t help but think that such confidence on the part of high yield managers is at least partially responsible for the quality anomaly in high yield bonds in the first place. Most high yield portfolio managers think they (or the analysts working for them) are superior credit analysts. It would be a very strange career choice to have made if they did not think they were good at the job. And if you think you are a really good credit analyst, the place where your credit analysis will have the biggest impact on your portfolio is in the lower rated segments. If 1% of BB bonds default in a given year and you can entirely avoid those that do, you stand to outperform by something substantially less than 1% (defaulted bonds have a recovery of 50% or more in the long run). If you could own a portfolio of CCC bonds and entirely avoid those that default, the payoff in terms of outperformance is an order of magnitude higher. Truly brilliant credit analysts are right to focus their time on the riskiest bonds. There are just a lot fewer truly brilliant credit analysts than there are credit analysts who merely think or hope that they are truly brilliant.
Cause and effect problems are tricky in this case. Insofar as the outperformance in those industries is driven by the high-quality firms in them, you could make the argument that it’s not the industries, but the high-quality firms within them, that have done well.
Disclaimer: The views expressed are the views of Ben Inker through the period ending December 2023, and are subject to change at any time based on market and other conditions. This is not an offer or solicitation for the purchase or sale of any security and should not be construed as such. References to specific securities and issuers are for illustrative purposes only and are not intended to be, and should not be interpreted as, recommendations to purchase or sell such securities.
Copyright © 2023 by GMO LLC. All rights reserved.
See The Quality Spectrum: Stability in an Unstable World (May 2023).
The chart would actually look similar if I plotted raw returns of the two groups, but the comparison wouldn’t be fair as it mixes two sources of return and risk (duration and credit exposure) with very different characteristics.
There is a little hand-waviness to this, I’ll admit, but not a lot. Default is not the only bad thing that can happen to a bond. It can also be downgraded. While about 1% of BBs default in a given year, perhaps 8.5% will get downgraded, and those downgraded bonds invariably fall in price when the downgrade occurs. CCCs have the consoling feature that in the absence of actually defaulting, rating agencies generally don’t bother with CC or C ratings and even when those ratings are used, there isn’t that much price action on average since CCCs are already very low-quality bonds. Upgrades happen as well, of course, with 7-8% of high yield bonds getting upgraded in a given year. CCCs have the advantage that they basically only get upgrades, not downgrades. BBs, though, have a nice feature of their own. If a BB bond gets upgraded, it graduates out of the high yield universe and becomes ownable by a new group of investors that cannot own lower rated bonds. That gives an extra boost to those upgraded bonds (i.e., “rising stars”) that no other rating cohort enjoys.
There is no guarantee that that smaller fundamental impairment will lead to better market performance in an economic downturn. If the high-quality stocks are trading at too large a premium to the rest of the market, their relatively small fundamental impairment still might be a bigger disappointment to investors than the larger hit the rest of the market will take. Not even high-quality stocks are safe against material overvaluation.
GMO’s Quality Cyclicals Strategy, launched in 2020, was designed to exploit this advantage.
It’s a less acute problem in the rest of the developed world, generally speaking. While interest rates have gone up significantly everywhere apart from Japan, no other country has enacted the tax changes the U.S. did, and in most of the world small caps are less levered than they are in the U.S. Japan is a double outlier on this, since not only have interest rates not gone up much in Japan, but Japanese corporates have continued to de-lever over the past decade, such that the average listed Japanese non-financial has almost no net debt. UK small caps are the most similar to the U.S., as they too have levered themselves up substantially in the past 20 years and interest rates have gone up sharply there as well.
See Beyond the Landing: The Macro Risks Still on the Runway (September 2023).
GMO launched the Small Cap Quality Strategy in 2022.
See Value Does Just Fine in Recessions (June 2023).
To be clear, I’m talking about returns relative to the market. High-quality stocks underperform the market by about 0.3% in the average up month for the market and low quality outperforms by about 0.2%. In down months, high quality outperforms the market by 1% on average and low quality underperforms by 0.8%. That’s an aggregate difference of 0.5% in favor of low quality in up months and 1.8% in favor of high quality in down months.
GMO’s Quality Spectrum Strategy is explicitly exploiting this amazingly favorable asymmetry by going levered long high-quality stocks against a smaller low-quality short, resulting in a portfolio that we believe can deliver most of the upside of the stock market in good times and much less downside in the bad times.
As of August 2023, BBB bonds made up about 48% of the Markit iBoxx USD Liquid Investment Grade Index. AAA bonds were 1% and AA bonds were just over 7%.
Specifically, as of November 2023, the High Yield Strategy has delivered an average annual outperformance versus the Markit iBOXX USD Liquid High Yield Index of 1% net of fees since inception, with a beta of 0.96 and outperformance in each of the meaningful drawdowns in the asset class since inception—there have been three drawdowns of more 3% since 2018 and we outperformed on average by 1% (net) across them.
Personally, I can’t help but think that such confidence on the part of high yield managers is at least partially responsible for the quality anomaly in high yield bonds in the first place. Most high yield portfolio managers think they (or the analysts working for them) are superior credit analysts. It would be a very strange career choice to have made if they did not think they were good at the job. And if you think you are a really good credit analyst, the place where your credit analysis will have the biggest impact on your portfolio is in the lower rated segments. If 1% of BB bonds default in a given year and you can entirely avoid those that do, you stand to outperform by something substantially less than 1% (defaulted bonds have a recovery of 50% or more in the long run). If you could own a portfolio of CCC bonds and entirely avoid those that default, the payoff in terms of outperformance is an order of magnitude higher. Truly brilliant credit analysts are right to focus their time on the riskiest bonds. There are just a lot fewer truly brilliant credit analysts than there are credit analysts who merely think or hope that they are truly brilliant.
Cause and effect problems are tricky in this case. Insofar as the outperformance in those industries is driven by the high-quality firms in them, you could make the argument that it’s not the industries, but the high-quality firms within them, that have done well.