Executive Summary
Since its founding in 1994, the GMO Emerging Country Debt team has incorporated ESG-related factors into its systematic sovereign risk assessment process and has engaged in discussions on ESG matters in due diligence meetings with sovereign creditors, multilaterals, and other organizations.1 In this paper we summarize our more recent efforts to bolster that process through the use of proprietary ESG indicators. We begin by reviewing the implicit role that ESG has traditionally played in our process. We then discuss some of the unique challenges involved in including ESG as a factor in sovereign emerging country debt investing. Next, we describe our recently adopted strategy for systematically involving ESG in our analysis in light of those challenges. Finally, we discuss the results of our analysis to date, as well as considerations for future research.
What Role Has ESG Traditionally Played in Emerging Sovereign Debt Investing at GMO?
The aim of our sovereign risk assessment process has been, and continues to be, to compare emerging countries to one another on the basis of their economic fundamentals, toward identifying which appear “rich” or “cheap” in terms of their sovereign spreads at any given point in time. We have traditionally approached this task by distilling various economic variables into three main “pillar” scores – Economic Structure, Fiscal Sustainability, and External Liquidity – each of which is used as a final input toward establishing a single score for credit quality. The main output of that process is shown in Exhibit 1, which will be familiar to many of our investors, plotting countries’ fundamental credit scores derived from this analysis on the x-axis, and their observed 10-year sovereign Z-spreads as of December 2020 on the y-axis.
Exhibit 1: Comparing spreads vs our own estimates of sovereign risk via our traditional approach
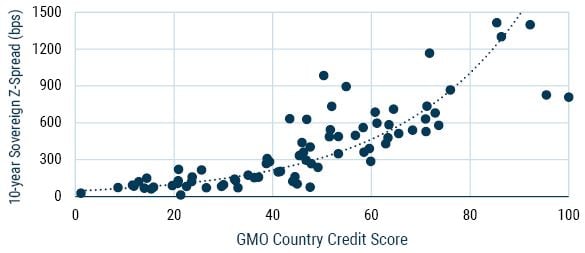
Source: GMO
ESG factors have, since the beginning, had a presence in that process via two main channels: 1) through its factor-based component, and specifically through the presence of the World Economic Forum’s Global Competitiveness Index (GCI) within our “Economic Structure” pillar; and 2) through qualitative considerations that complement that factor-based component.
The inclusion of GCI as a factor-based input has been aimed at measuring the strength of countries’ economic, social, and governmental institutions, with the goal of assessing the structural health of their economies. GCI is a composite of dozens of individual variables, some of which have clear ESG relevance. Some examples of the variables within GCI that could be considered ESG in nature would be the presence of energy-efficiency regulation and environment-related treaties within the “Environmental” category; homicide rate, life expectancy, and mean years of education within “Social”; and judicial independence, press freedom, and incidence of corruption within “Governance.”2
Secondarily, ESG considerations often play a significant role in the supplemental qualitative research that accompanies our factor-based approach. That qualitative component involves country-level information that is exogenous to our fundamental model, often directly gleaned from our regular engagement with sovereign issuers, multilateral organizations, or third-party analysts. For instance, even as the historical volatility of growth and inflation are explicitly included in our systematic process, we have historically taken into account countries’ vulnerability to natural disasters (that is, environmental risk) as a further consideration when assessing a “fair” sovereign spread. The same goes for other risks that can be considered social or governance-related in nature – for instance, a country’s level of social cohesion and the risk of civil strife (social), or the risk of an adverse change in economic policies following an upcoming election (governance). Until recently, these phenomena have not been explicitly included in our systematic process, but nonetheless have played an important role in our assessment of countries’ creditworthiness and, ultimately, our investment decisions.
Some ESG-related Challenges as They Relate to Sovereign Risk Analysis
Recently we began exploring potential ways to involve ESG factors more directly in our sovereign risk analysis process beyond their presence via GCI and the qualitative component mentioned above. We recognized numerous sources of complexity in working to that end and highlight three in particular below.
The measurement of countries’ ESG quality is not straightforward: We see considerable ambiguity in how ESG variables are measured and accounted for. Our traditional inputs into our systematic process are relatively straightforward; per capita income in U.S. dollars, for instance, is direct in terms of measurement and unambiguous in its relationship with sovereign risk (richer countries tend to be more creditworthy). By contrast, estimating a country’s relative strength along the parameters of environmental, social, or governance issues is much less straightforward. One notable example is the incidence of corruption, a commonly cited component of countries’ governance ratings, which can be measured or proxied in numerous ways depending on the preferences of the analyst and its intended use.3
Further, we see no clear consensus within the asset management industry on how to handle ESG-related phenomena that are undesirable from a global vantage point, but not necessarily at the country level. One example here is greenhouse gas emissions: fossil fuel-producing countries (including much of the emerging world) privately benefit from the existence of these extractive industries, yet at present these countries do not fully bear the public costs at the global level, even amid incipient coordination efforts such as the Paris Climate Accord. Thus, at this point in history, assigning a negative value for such countries in terms of our own sovereign risk assessment or our ultimate investment decisions may be morally justifiable, but not necessarily optimal from the perspective of gauging countries’ creditworthiness and maximizing portfolio returns. Indeed, emerging economies tend to be much more reliant on fossil fuel production than their developed counterparts, making this terrain particularly rugged for analysts of emerging debt (see Exhibit 2).
Exhibit 2: FOSSIL FUELS PLAY A LARGER ROLE IN EMERGING ECONOMIES
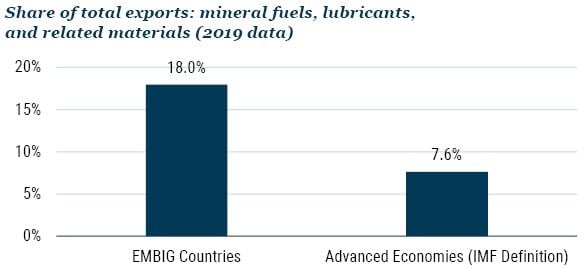
Source: UNCTAD, J.P. Morgan, IMF
Countries’ ESG quality appears to be positively correlated with income, and negatively correlated with yields. Another thing we observe is that ESG quality is highly correlated with income levels, meaning that emerging countries tend to be, all things being equal, worse than developed countries on these metrics. Economists have long accepted the existence of the relationship between countries’ level of development and things like environmental quality or the strength of political institutions.4 Indeed, Exhibit 3 shows a clear correlation between countries’ total ESG scores (using metrics from MSCI) and their level of per capita income. From our vantage point, any analysis of an emerging asset class or individual portfolio’s level of ESG quality must take this fact into consideration.
Making matters more complicated is the fact that within emerging country debt, poorer countries not only tend to have worse ESG scores, but also offer higher yields (see Exhibit 4). Thus, all things being equal, portfolios that are overweight higher-yielding sovereigns face an uphill climb in order to match or exceed the average ESG quality of their benchmark, even as they are likely to deliver positive alpha in the long run. Conversely, to disqualify low-scoring ESG countries from eligibility within an emerging debt portfolio, or to otherwise limit their weights in the portfolio irrespective of other factors, runs the risk of skewing the portfolio toward lower yields, and potentially lower returns.5
Exhibit 3: ESG scores are highly correlated with per capita income…
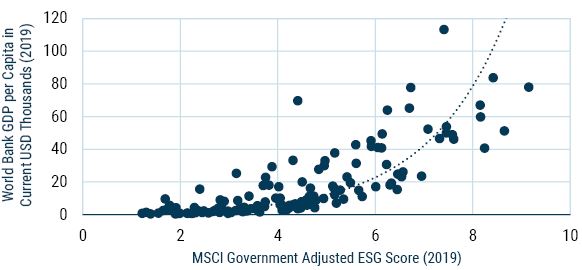
Source: World Bank, Bloomberg, MSCI, J.P. Morgan
Exhibit 4: …and negatively correlated with yields
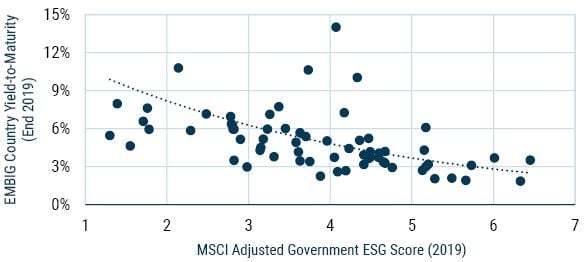
Source: World Bank, Bloomberg, MSCI, J.P. Morgan
We see a high degree of multicollinearity between ESG factors and other variables in our systematic process. As mentioned earlier, the primary focus of our systematic sovereign risk assessment process is to use regression analysis to establish a “fair value” for each country’s sovereign spread and compare this to what we observe in the market (that is, whether or not a country is “rich” or “cheap”). Nonetheless, as sovereign analysts we also often look for additional insights at the variable level as we move toward making our final investment decisions. Even without involving ESG factors, a high degree of correlation among inputs into our model sometimes makes these additional insights elusive, but this challenge of multicollinearity is further magnified when we involve ESG.6
Our Approach to Integrating ESG as a Factor in Our Sovereign Risk Assessment Process
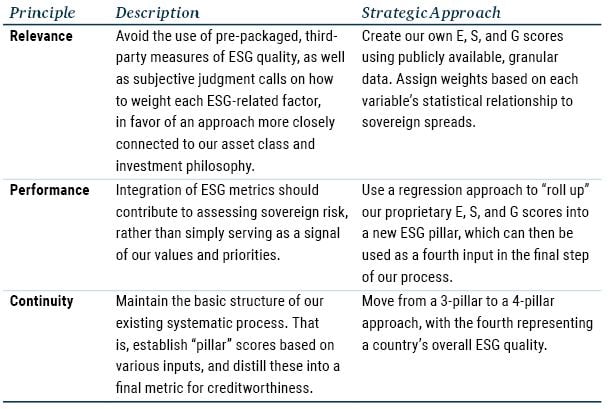
We identified three core principles to guide us as we sought to involve ESG more substantially in our systematic process:
- Relevance. One of our priorities has been to establish our own framework for “rolling up” individual ESG-related data into proprietary aggregated scores, rather than relying on third-party, pre-packaged metrics. This strategy allows us to focus on what matters specifically to the emerging sovereign debt asset class, and to our own investment approach.
- Performance. Integration of ESG metrics should, in our view, contribute toward assessing sovereign risk, rather than simply serving as a signal of our values and priorities. To that end, we chose to use a regression approach when establishing a fourth (ESG) pillar score, as we use for the other pillars.7 This approach allows us to avoid arbitrary and subjective judgments about the relative weights of individual ESG-related variables and lets the statistical process itself indicate which variables are helpful to reaching our final goal.8
- Continuity. Our strong preference has been to keep the basic structure of our existing systematic process intact. As mentioned earlier, that process distills countries’ economic fundamentals into three pillars, each with its own 1 through 100 score. To that end, we have elected to establish a fourth, ESG-dedicated pillar upon which our final credit score is based.
Table 1: Key Principles of Our Approach
Results of Our New Approach
GMO’s Emerging Country Debt team established its new, 4-pillar, ESG-inclusive process in July 2020 and ran the two processes alongside each other through the end of the year. Some of our key findings in comparing the two approaches are:
Goodness of fit improves. Perhaps most important, we find that goodness of fit improves significantly when we add in our fourth pillar based on ESG. In plain terms, this means that the gaps between our “fair value” spread estimates and actual spreads tend to narrow with the inclusion of ESG factors. Notably, if we: a) remove GCI (which is highly predictive of sovereign spreads) from our Economic Structure pillar and replace it with alternative measures of economic institutions with no ESG component, and b) “bound” the weight of our ESG fourth pillar to no more than 15%, our new method still gives us a goodness of fit that is similar to that of our traditional, 3-pillar approach.9
Our proprietary sovereign ESG scores are correlated with those of third parties, with some important exceptions. As mentioned above, we found it preferable to establish our own E, S, and G country scores by examining the statistical relationship between their underlying variables and sovereign spreads, rather than using prepackaged solutions. The result is a set of indicators that is, as one might expect, correlated with data from third parties. This is illustrated in Exhibit 5, which plots our final country ESG scores against those of MSCI.
The two sets of results are hardly uniform, however. A handful of countries – most notably Argentina, Barbados, Grenada, and Uruguay – score much more poorly according to our metrics than they do via MSCI, while we find the opposite to be the case for India, Laos, Mexico, and the Philippines. One significant source of deviation seems to be the environmental category. As Exhibit 6 shows, correlations between our results and those of MSCI for the social and governance categories are large and negative, which we would expect (higher numbers indicate better results under our framework). By contrast, the correlation for the environmental category is weak, and positive. We suspect this is because of our purely statistical approach to rolling up ESG variables, combined with a somewhat higher degree of ambiguity in terms of the relationship between environmental phenomena and credit risk, as we discussed earlier.10
Exhibit 5: Our country-level ESG scores are correlated with third-party data
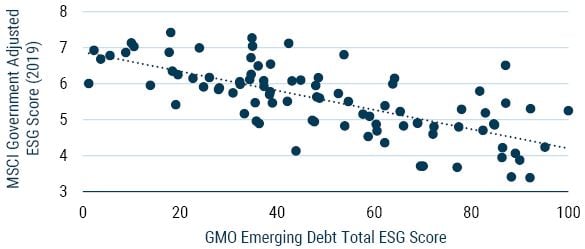
Source: GMO, MSCI
Exhibit 6: Correlations appear strongest for the Social and Governance categories
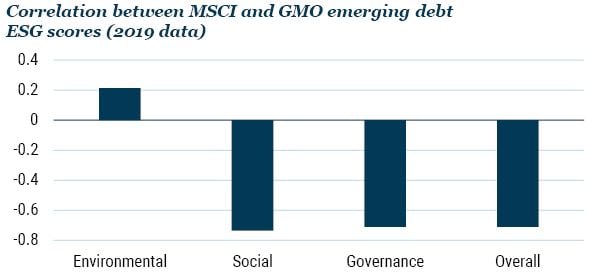
Source: GMO, MSCI
The introduction of our new approach tightens large residuals, in most cases. Adding in our ESG fourth pillar does, as we might expect, materially affect our fair value spread estimates for some countries (see Exhibit 7). However, we find only a small number of cases where those estimates directionally switch between “rich” and “cheap.” Looking at six months’ worth of results, we note that:
- On average, there were roughly 30 countries in our sample that we classified as “cheap” using our original 3-pillar framework (using our definition, fair value spreads at least 10% lower than observed spreads). Just one, on average, flipped to “rich” (fair value spreads at least 10% higher than observed) from “cheap” when we introduced our new approach. Saudi Arabia was the most notable country within this category.
- Similarly, roughly 30 countries in our sample, on average, were classified as “rich” using the 3-pillar framework. Roughly three per iteration flipped to “cheap.” Belize, Serbia, and Jamaica were notable countries within this category.
- Approximately two-thirds of “cheap” countries that did not flip to “rich” saw their residuals tighten; that is, their fair value spread estimates converged toward observed spreads. For instance, residuals for Bahamas and Tunisia tightened, meaning that these appeared less cheap than they did under our previous framework. By contrast, residuals for Costa Rica and Turkey widened out, meaning these countries appeared even cheaper once we included ESG in our analysis.
- Of those “rich” countries under our 3-pillar framework that did not flip to “cheap,” a slight majority saw their residuals tighten, most notably Panama, Peru, and Paraguay. Conversely, countries in this category that saw their residuals widen included Mozambique, India, and the Philippines.
Exhibit 7: Effects on country residuals when introducing our 4-pillar method
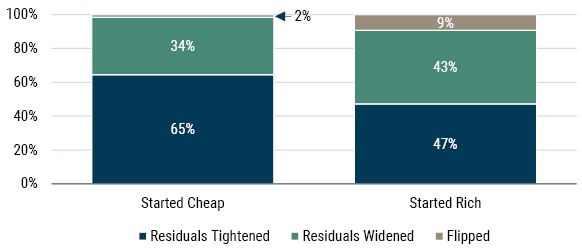
Source: GMO
Case Study: Jamaica
As mentioned above, Jamaica is one of the more notable countries in our sample in terms of the effects of switching from our 3-pillar to our 4-pillar approach. The country is one of the better rated credits in the Caribbean region, thanks in large part to its success in running large and consistent primary fiscal balances following its 2013 default.
Nonetheless, under our 3-pillar framework, the country looked slightly “rich” in mid-2020; that is, spreads on Jamaican sovereign bonds were inside of our forecasted fair value estimate. Part of the reason for this could be attributed to the country’s relatively high (that is, weak) Economic Structure score, with this pillar accounting for the largest weight among the three. Moreover, Jamaica’s overall Fiscal Sustainability score is still relatively weak compared to peers, due to a fairly high public debt and interest burden despite its solid fiscal performance in recent years.
Upon introducing our 4-pillar framework, however, Jamaica’s score significantly improved to the point that spreads looked fairly attractive in comparison to our new fair value estimate. Why? First, its Economic Structure improved as GCI (where Jamaica ranked relatively poorly) was replaced by more purely economic measures of institutional strength (where the country performs better). Second, its overall ESG score using our methodology is relatively strong, thanks to healthy Social and Governance components, and in spite of weakness in Environmental (driven in part by a severe level of climate-related risk, as we encounter for other island nations).
In our view, the 4-pillar framework takes into account more directly Jamaica’s relative strength in terms of economic institutions, governance, and social stability, as well as its relative weakness in terms of environmental vulnerability. These concepts are effectively brought from the qualitative domain into the quantitative process, where their implications for creditworthiness can be more easily identified and measured.
Final Thoughts
We see a multitude of viable approaches to involving ESG factors in emerging sovereign debt analysis, and we believe ours is sensible in light of the nature of the asset class and our investment philosophy. By starting with granular data and “rolling up” into proprietary E, S, and G scores according to these variables’ statistical linkages to sovereign spreads, we let the data lead us rather than relying on prepackaged third-party indicators or our own judgment calls. Further, by assigning ESG factors their own “pillar,” we are able to isolate and assess the ESG-related component of sovereign risk while keeping the longstanding structure of our systematic approach intact. In our case, this approach succeeds in narrowing most of the large residuals between countries’ actual and fair value spread estimates without dramatically changing the directional results in terms of countries’ appearing “rich” or “cheap.”
Going forward, we see enormous opportunities for further research as it relates to ESG and sovereign risk. We would highlight two areas in particular. The first is how ESG factors – or trends in ESG factors – might be predictive of future sovereign credit returns, rather than current spreads. As mentioned above, our approach seeks only to assess whether credits are “rich” or “cheap” versus each other at any point in time. We believe this approach is appropriate for our buy-and-hold investment philosophy, which focuses more heavily on countries’ risk of default, rather than the risk of near-term volatility. Nonetheless, further investigation into the dynamic relationship between countries’ ESG performance and sovereign credit returns is worthwhile.
The second is how ESG factors might influence sovereign restructurings (that is, what happens after countries find themselves in default). Analysis of default recovery values often tends to, quite sensibly, center on pure fiscal and economic considerations, such as countries’ ability to grow their economies and generate primary fiscal surpluses. Nonetheless, other questions we would consider ESG in nature commonly play a role and deserve exploration. What is the level of likely policy continuity from one governing regime to the next? How strong is trust in government, such that policymakers have room to strike difficult balances between paying bondholders and spending on things like education or health? What is the risk that environmental catastrophe might suddenly change countries’ ability to pay?
Sovereign debt investors have, rightfully, begun involving ESG in their analysis and in their investment decisions. We feel our new framework has improved our ability to fundamentally assess emerging sovereign credit risk and are looking forward to the path ahead.
Download article here.