Executive Summary
With the recent increases in interest rates, the carry trade has had a sudden resurgence in performance, which could make it a tempting strategy for investors. However, we want to caution investors that the carry trade still has embedded risks right now because valuation is against it. Moreover, with the opportunities available in value at the extremes and the potential gains from carry looking quite small, we do not think now is the time to get carried away by the recent performance.
Introduction
After a bout of strong recent performance brought about by rising interest rates, investors may be tempted to over-allocate to carry. However, we must caution investors that, in this environment, the carry trade is actually riskier than one might think because it requires taking positions against underlying valuations. Historically, carry has worked well when valuation was on its side but has languished when trading against fundamentals. Today, it is the more expensive currencies that are the higher yielding ones, meaning that the current carry trade effectively requires investors to bet against reversion, particularly when currency valuation spreads are at all-time extremes and yield spreads remain quite small.
What is the carry trade?
At its core, any carry trade is simply borrowing money at a low interest rate and depositing it in an asset with a higher yield. In foreign exchange markets, it means borrowing in a currency that has a lower interest rate and investing it in a currency with a higher interest rate. The expectation is that the interest rate differential offers a “carry” or a yield pickup that is greater than any capital loss in the currency you invested in. A successful carry trade depends on multiple factors, particularly the size of the carry (i.e., interest rate differential) and the likely direction of the currency you are investing in. To a lesser extent, but still worth noting, is the volatility of the asset you are investing in. (A large yield pickup in a low volatility asset is preferable to a small yield pickup in a high volatility asset.) 1
How has the carry trade performed?
To evaluate the performance of carry as an investment strategy, we look to one of the indices created to track it, the DB G10 Currency Future Harvest Index. This index, which also has an associated ETF (the Invesco DB G10 Currency Harvest Fund; ticker: DBV), represents the performance of a carry strategy using G10 currencies. As per the fund prospectus, the index (fund) takes long positions in the three highest yielding currencies and short positions in the three lowest yielding currencies (with a 2:1 leverage ratio). The historical performance of the index and ETF performance, where available, is shown in Exhibit 1. While the performance of any strategy is dependent on its investment universe and the portfolio construction methods used to implement the strategy, it is worth noting that other carry indices (as well as our own back-testing) show similar performance patterns when using a similar universe.
One of the first things we noticed when looking at the DB G10 track record is that yes, carry has had a recent run of strong performance over the last 6 to 12 months – interest rate changes have had a positive effect on the carry trade. But in the broader context of history, the performance of carry as a strategy has been somewhat poor over the last 15 years. Why might this be? Were there persistent headwinds hindering the carry trade over this period, and more importantly, have those factors changed in a way that warrants more investigation?
Exhibit 1: The Historical Performance of Carry
Recently strong, but historically poor
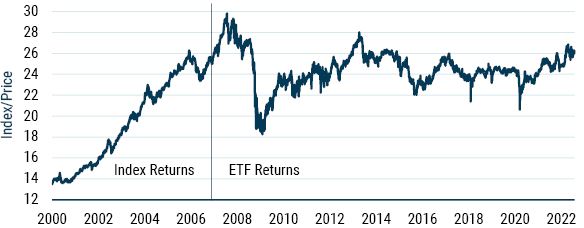
Source: Bloomberg. Index and ETF returns represent the Deutsche Bank G10 Currency Future Harvest Index and the Invesco DB G10 Currency Harvest Fund, respectively.
Have things fundamentally changed?
As we mentioned, the key issues we believe to be relevant to carry performance include the size of the carry or yield pickup, the potential direction of underlying currencies, and possibly the volatility of the underlying asset that we are investing. Let’s take a closer look at these characteristics to see if any of them have changed in a way that warrants further consideration.
Starting with yield differential, the chart below shows the implied yield carry from 3-month forward rates, using an average of the 3 highest yielding currencies less the 3 lowest yielding currencies within the G10 universe. From this we can draw two important conclusions. First, the yield pickup has recently increased, making the carry trade appear more attractive. Secondly, however, the size of the yield gain is still historically small. It has made it back to pre-pandemic levels, but it is nowhere near the levels that were available when the carry trade was a reliable strategy. As a starting point, the size of the interest rate differential does not appear to be at the level that strongly supports the carry trade.
Exhibit 2: The Historical Yield Pickup (Quarterly) from Carry
Still Low Despite Recent Rebound
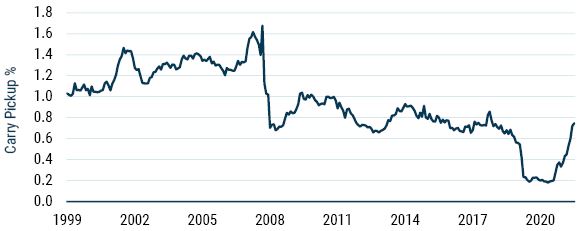
Source: GMO, WM Reuters
The next issue to consider is whether the higher yielding currencies are more likely to appreciate or depreciate. Perhaps the best way to examine the most likely future direction of a currency return is by comparing a currency relative to its fair (or fundamental) value. Intuitively, a currency with good fundamental value is more likely to appreciate. A currency that is cheap and has a good yield is even more attractive. If the currency is expensive, however, we need to consider the trade-off between the expected yield pickup relative to its price.
To measure fair value, we used purchasing power parity (PPP) as defined by the IMF. This measure compares a basket of goods in one economy against a similar basket in another to see how far a currency is from fair value (within SGM we use a similar model, with some adjustments). To look at the historical relationship between fair value and carry, we have run the monthly cross-sectional correlation between the two factors, shown in Exhibit 3. In effect, the higher correlation means that more of the high yielding (low yielding) currencies are cheap (expensive), while a negative correlation suggests the opposite. For a carry strategy to be really attractive, we’d want to see a strong positive correlation.
Exhibit 3: The Correlation of Value and Carry through Time
Fundamental value and carry favour different currencies
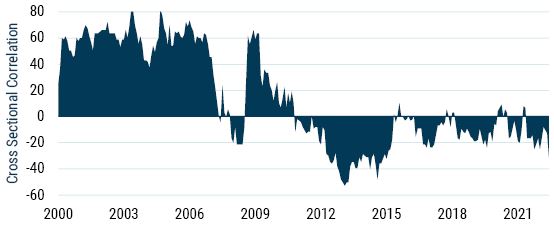
Source: GMO, IMF, WM Reuters
One potential reason carry worked from 2000 to 2010 is that the high yielding currencies were fundamentally cheap in the first place. When you look at the performance of carry as a strategy through history, it lines up with the fundamental value of the currencies to start with. The yield pickup was almost a bonus. But now, the opposite is true. When we buy carry, we are trading against the fundamental value. Again, looking at the IMF model, fundamental value favours currencies like the yen, the euro, and the pound sterling. Yet these are some of the lowest carry currencies. Rather, carry favours the New Zealand, U.S., and Canadian dollars, which aren’t cheap. In the current environment, we need to choose between yield or value, or have degree of trade-off between the two, when looking at currencies.
So, if yield spreads are particularly low at the moment, where are value spreads? Do we see strong valuation differences in currencies, or small ones? Given that the size of yield spreads seems to be an important factor in the performance of carry, it would make sense to also be aware of the size of the value spreads. To look at value spreads, we repeated the analysis in Exhibit 2, but this time using how far currencies have diverted from fair value. To make it easy to compare value spreads to yield spreads, we then looked at where the current yield pickup is compared to its history vs. the current value spread compared to its history, and what percentile each is in. What we see is that the value spreads are extremely high (85th percentile), while the yield spreads are extremely low (25th percentile). Looking at the yen, euro, and the pound, the value model shows them as 41%, 30%, and 21% undervalued, respectively. (The SGM valuation models shows similar levels for the yen and the pound but shows the euro around 40% undervalued). Indeed, relative to history, there are huge valuation opportunities available, but the potential gains from yield pickup are still quite small. 2
Exhibit 4: Current Spread Relative to History, Percentile Ranking
Yield spreads are low, yet value spreads are high
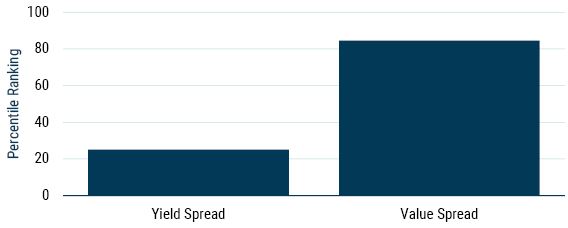
Source: GMO, IMF, WM Reuters, as of 30 June 2022
In a final point we should briefly mention volatility. It may be a lesser issue, but perhaps there is some potential to justify a lower yield pickup, if perhaps the volatility of currencies has also been commensurately lower (some authors have noted a relationship with the carry trade). 3 But even a cursory look at trailing currency volatilities, or currency implied volatility indices, we do not see any significant or structural changes in volatility levels, and this issue can be dismissed.
Summary
Carry is a complex topic that deserves more attention than we can give it in this short paper. Carry is important and yes, we do use it in the SGM models as one of many underlying factors. But we also need to look at carry in context with other factors that could be driving markets. Currently, carry seems to be in a lower yield, higher risk environment where it is positioned against the underlying fundamentals of the currencies that it favors. We have also seen that carry doesn’t always work, as it has underperformed for lengthy periods of time (particularly when trading against the fundamentals, as it is today).
Indeed, valuation is currently against carry and the opportunities available in value are at extremes while the potential gains from carry are quite small. The recent changes in rates have prompted a sudden resurgence in carry performance that may make the strategy appear more enticing to investors. The temptation is to over allocate, but as our analysis suggests, now is not the time to get carried away.
Bibliography
Bansal, Ravi. “An Exploration of the Forward Premium Puzzle in Currency Markets.” Review of Financial Studies 10, no 2 (1997): 369-403.
Bhansali, Vineer. “Volatility and the Carry Trade.” Journal of Fixed Income 17, no. 3 (Winter 2007): 72-84.
Bilson, John F.O. “The ‘Speculative Efficiency’ Hypothesis.” Journal of Business 54 (1981): 435-452.
Engel, Charles. “The Forward Discount Anomaly and the Risk Premium: A Survey of Recent Evidence.” NBER Working Paper 5312 (1995).
Froot, Kenneth and Thaler, Richard. “Anomalies: Foreign Exchange.” Journal of Economic Perspectives 4, no. 3 (1990): 179-192.
Download article here.
The carry trade, also known as the forward rate bias, has had an extensive history in both finance and academia. Early studies on the topic can be found in the works of Bilson (1981), Engle (1985), Bansal (1997), and Froot and Thaler (1990), to name but a few.
Not only are yields spreads small, but most yields are also negative in real terms. Many of the higher yielding currencies are among the economies that are fighting inflation. This creates an additional issue that currently there is a near-zero correlation between real yields and nominal yields.
For example, see Bhansali (2007).
Disclaimer: The views expressed are the views of the GMO Systematic Global Macro team through August 12, 2022 and are subject to change at any time based on market and other conditions. This is not an offer or solicitation for the purchase or sale of any security and should not be construed as such. References to specific securities and issuers are for illustrative purposes only and are not intended to be, and should not be interpreted as, recommendations to purchase or sell such securities.
Copyright © 2022 by GMO LLC. All rights reserved.
The carry trade, also known as the forward rate bias, has had an extensive history in both finance and academia. Early studies on the topic can be found in the works of Bilson (1981), Engle (1985), Bansal (1997), and Froot and Thaler (1990), to name but a few.
Not only are yields spreads small, but most yields are also negative in real terms. Many of the higher yielding currencies are among the economies that are fighting inflation. This creates an additional issue that currently there is a near-zero correlation between real yields and nominal yields.
For example, see Bhansali (2007).