Executive Summary
Climate change presents a significant source of transition risk for investors as companies face increasing pressures from regulators, consumers, and shareholders to lower their carbon footprints. To fully measure portfolio exposure to emissions risk, we believe investors must go beyond capturing scope 1 and scope 2 emissions to consider all indirect emissions exposure across end-to-end company value chains.
However, we believe reported scope 3 data used for measuring indirect emissions is inadequate for this purpose. Inconsistent scope 3 estimation methodologies prohibit the comparison of values across companies, which interferes with portfolio construction.
To address this important challenge, we have developed the GMO Indirect Emissions model, a proprietary method for estimating emissions embodied in company value chains. Our novel approach aggregates underlying direct scope 1 and household emissions across end-to-end value chains and has the following advantages over existing practices:
- Ensures consistent double counting across all companies and enables tracing the origin of all indirect emissions.
- Directly incorporates reported company supply chain relationships, industry segment revenue, and scope 1 emissions into a global company-level supply chain model.
- Distinguishes companies from their peers based on characteristics of their specific value chains, instead of relying on traditional intensity metrics.
By estimating all direct and indirect flows between companies with a consistent global methodology, the GMO Indirect Emissions model provides our investment teams with a unique and powerful tool for quantifying, tracking, and managing portfolio carbon transition risk.
In this paper, we explain why measuring indirect emissions is so important to asset managers – and so challenging currently – and we introduce the GMO Indirect Emissions model as a solution to these challenges. 1
Climate Change and Carbon Transition Risk
Climate change poses one of the largest sources of financial risk to asset managers, with an estimated value at risk to manageable assets of up to $43 trillion by 2100 [1]. This financial risk could manifest in many ways including changes in climate policy by regulators, changes in market demand motivated by climate concerns, or physical risks resulting from events such as floods, wildfires, or storms [2]. Companies with significant exposure to these risks could experience lower productivity from new climate policies, smaller margins from higher energy and commodity prices, or business disruption from new technologies. These risks extend through value chains as direct exposures propagate upstream and downstream to impact suppliers and customers.
Climate change impacts will thus have immense effects on asset valuation. As noted by former Bank of England Governor Mark Carney, "Changes in climate policies, new technologies, and growing physical risks will prompt reassessments of the values of virtually every financial asset" [3]. As a result, shareholders and stakeholders are pressuring companies to reduce their emissions footprints over time or face divestment risk [4].
The Need for Asset Managers to Measure End-to-End Value Chain Emissions
With the outsized risks presented by climate change, asset managers must consider emissions when evaluating the future potential of companies – but that is a complicated endeavor. There is growing consensus that direct emissions from company operations (i.e., scope 1 emissions) do not adequately capture a company’s exposure to carbon transition risk. Asset managers must also consider all indirect emissions embodied in the end-to-end value chain of a company, including scope 2 and scope 3 emissions. 2 This has driven calls for more effective and consistent climate-related disclosures from companies [2].
The SEC has proposed rules requiring disclosures of scope 1 and scope 2 emissions from all public companies as well as scope 3 disclosures where material [5]. The Task Force on Climate-related Financial Disclosures (TCFD) also emphasizes the importance of scope 3 in assessing an organization's exposure to carbon transition risk, strongly encouraging all organizations to disclose scope 3 emissions, stating that "disclosure of absolute GHG emissions across an organization's value chain provides insight into how a given organization may be affected by policy, regulatory, market, and technology responses to limit climate change" [6].
At GMO, we believe it is critical for asset managers to consider all GHG emissions embodied in company value chains when managing portfolio exposure to carbon transition risk.
Challenges with Available Emissions Reporting
The use of scope 3 emissions in portfolio construction comes with a number of challenges. While companies commonly report scope 1 and scope 2 emissions, the data required to accurately estimate scope 3 emissions is not easily accessible or reliable. 3 The broad definition of scope 3 is one reason for this, as it presents an immense reporting challenge to companies. To accurately estimate scope 3 emissions, a company requires detailed data on emissions and product flows by all organizations within its end-to-end value chain. This includes the activities of all direct and indirect suppliers and customers to ensure the inventory captures GHG emissions wherever they occur in the product life cycle (i.e., “cradle-to-grave”).
To assist companies in their reporting, the global standard Greenhouse Gas Protocol (GHGP) provides guidance on multiple estimation methodologies for 15 categories of scope 3 emissions [7]. This has enabled an increasing number of organizations to report their scope 3 emissions. However, the accuracy and completeness of this reported scope 3 data has been questioned [8]. For example, of the companies that reported at least one type of scope 3 emissions in the 2021 CDP climate questionnaire, 43% of electricity utilities companies, 24% of oil and gas companies, and 10% of coal mining companies did not report the most relevant source of scope 3 emissions for their industries, the "Use of Sold Products." Among all companies reporting scope 3 emissions, only 29% reported that their most material scope 3 estimates underwent some type of assurance process, and 22% of companies qualified their assurance process as "limited." In fact, the most reported scope 3 category in 2021 was "Business Travel," which represents a small component of scope 3 emissions where the data required to generate an estimate is relatively accessible.
Even if company reporting of scope 3 emissions improves in the future, there is still a fundamental flaw in asset managers using reported scope 3 data to manage portfolio exposure to carbon transition risk. The GHGP scope 3 calculation guidance allows for significant optionality in how companies estimate each category of scope 3 [7]. While this flexibility promotes increased reporting, the variability of estimation methodologies results in scope 3 data that is not comparable across companies. In fact, GHGP explicitly states this limitation in its scope 3 guidance, stating that "Use of this standard is intended to enable comparisons of a company's GHG emissions over time. It is not designed to support comparisons between companies based on their scope 3 emissions" [9]. This caveat is crucial for asset managers to understand because the process of quantifying and managing portfolio exposure requires comparing company risk exposures across their entire portfolios (e.g., ranking companies and performing weighted sums).
Several data vendors have tried to provide a solution to this problem by providing scope 3 datasets generated from proprietary models using a consistent methodology, but currently available solutions rely heavily on top-down sector or industry emissions intensities with limited use of bottom-up data. These approaches are similar to the average-data methods suggested in GHGP scope 3 calculation guidance [7]. Some models even rely on emissions intensities calculated using aggregated reported scope 3 data. But again, this approach assumes data is comparable across companies, which goes directly against GHGP guidance. Models that rely primarily on sector or industry intensities limit how companies can distinguish themselves amongst their peers.
Instead of using reported scope 3 values, asset managers require indirect emissions data estimated using a single consistent methodology applied globally. GMO’s ESG Research team has completed significant research to develop such a model, providing GMO investment teams with a unique and powerful tool for quantifying, tracking, and managing portfolio carbon transition risk.
The GMO Indirect Emissions Model
The GMO Indirect Emissions model calculates total GHG emissions embodied in company value chains by modeling the value chains of individual companies and quantifying emissions for suppliers and customers within those value chains.
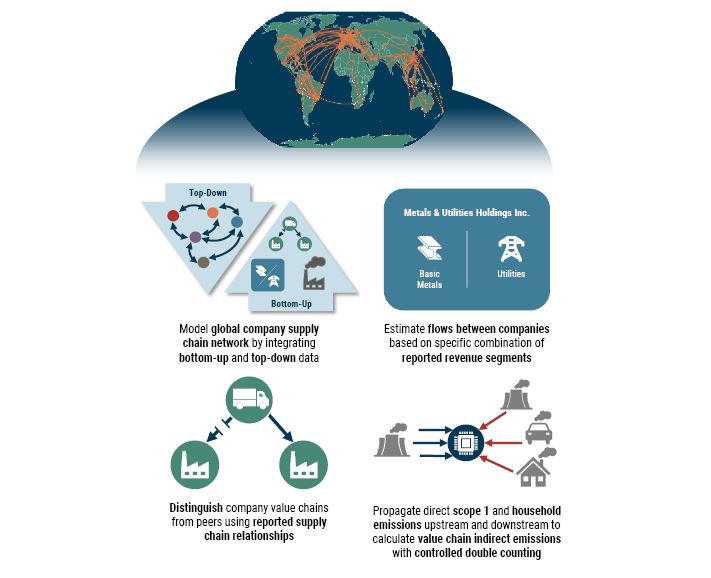
We begin by directly estimating a global supply chain network (see Exhibit 1). We leverage the OECD Inter-Country Input-Output (ICIO) model, an institutional long-term project that covers 93% of GDP, 92% of exports, and 90% of imports of the world economy [11]. Our approach disaggregates this global closed input-output (IO) model [10] by using company-reported supply chain relationships and segment revenue data, allowing us to estimate individual company value chains.
By integrating bottom-up company data directly with the IO model, we can efficiently estimate all direct and indirect effects of company production on both upstream and downstream companies across the value chain. For a given company, we can estimate all upstream production from direct suppliers and indirect suppliers-of-suppliers used as inputs in the company's operations. We can also estimate all downstream production of direct customers and indirect customers-of-customers that use the company's outputs in their processes. We convert these indirect production exposures into indirect emissions using scope 1 emissions of the upstream suppliers and downstream customers. To account for emissions generated by households, we incorporate household emissions data from the OECD TECO2 [12] and International Energy Agency (IEA) Energy Efficiency Indicators [13] datasets into the downstream indirect emissions component. We find that household emissions from transportation and residential energy use contribute significantly to company indirect emissions.
In this way, the GMO Indirect Emissions model estimates indirect emissions in company value chains using a primarily bottom-up process that propagates direct scope 1 and household emissions through our supply chain model. This approach has many benefits. It allows us to consistently control double counting of emissions (see Appendix), making our estimates comparable across all companies. This consistency is critical for asset managers because it ensures fair comparisons of companies during portfolio construction. Our approach emphasizes bottom-up data more than other available solutions, distinguishing companies from their peers based on characteristics of their specific value chains. It also provides complete transparency into model estimates, allowing us to trace indirect emissions back to their origins.
Overall, the GMO Indirect Emissions model provides a novel solution to the problem of quantifying indirect emissions in company value chains that addresses the limitations of other scope 3 data.
Exhibit 1: GMO Indirect Emissions Model Overview
The Model in Action: Company Analysis – China State Construction
The GMO Indirect Emissions model provides complete transparency into the origin of all indirect emissions by allowing us to track where indirect emissions were originally emitted as direct emissions. This makes the model completely interpretable and provides our investment teams with the ability to understand exactly where carbon transition risk originates in any given company’s value chain. To our knowledge, this level of detailed value chain emissions analysis is currently unique to the GMO Indirect Emissions model.
To demonstrate using an example, we will examine the GMO Indirect Emissions estimates for China State Construction Engineering Corporation (SSE: 601668) as of Q3 2022 and compare those estimates to the scope 2 and scope 3 estimates from a large data vendor. China State Construction is a Chinese construction company that primarily generates revenue in building and infrastructure construction. Using the process described above, we estimate the supply chain relationships for each of its business segments by integrating bottom-up reported supply chain relationships and segment revenue data into the top-down industry model.
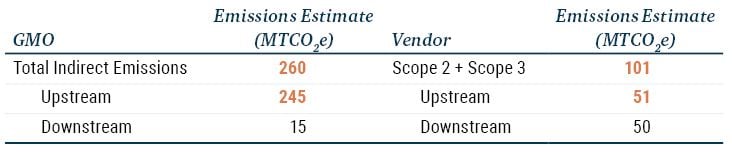
After propagating scope 1 and household emissions through the supply chain network, we estimate that China State Construction has a total indirect emissions exposure of 260 million tonnes of carbon dioxide equivalent, or MTCO2e (see Exhibit 2). This value is considerably larger than the vendor estimates for scope 2 and scope 3 emissions of 101 MTCO2e. By decomposing these aggregate estimates into upstream and downstream components, we find that most of the difference comes from the upstream component of indirect emissions. The GMO Indirect Emissions model estimates that China State Construction has a total upstream indirect emissions exposure of 245 MTCO2e while the vendor scope 2 and scope 3 upstream estimate is only 51 MTCO2e.
Exhibit 2: China State Construction’s Indirect Emissions
Source: GMO
The vendor data does not provide further transparency into its upstream estimate. However, the GMO Indirect Emissions model allows us to dive deeper by tracing China State Construction’s indirect emissions exposures back to the original emitters. We aggregate the company-level exposures to achieve an industry-level attribution of China State Construction’s upstream indirect emissions exposure for its construction business segment.
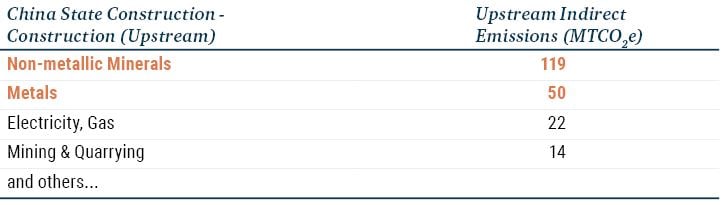
We find the GMO Indirect Emissions model estimates that China State Construction gets 119 MTCO2e of indirect emissions exposure from the Non-metallic Minerals industry alone (see Exhibit 3). The Non-metallic Minerals industry includes producers of materials such as glass, clay, ceramic, cement, lime, plaster, and concrete. Our model estimates that indirect emissions exposure from producers of these materials is more than two times the entire scope 2 and upstream scope 3 estimate from the data vendor. Furthermore, the GMO Indirect Emissions model estimates that producers in the Metals industry add an additional 50 MTCO2e of upstream indirect emissions exposure to China State Construction’s indirect emissions footprint. This value is almost as large as the entire vendor estimate of 51 MTCO2e. These results indicate that our process is likely capturing a more complete picture of China State Construction’s upstream indirect emissions exposure from suppliers and suppliers-of-suppliers than the vendor’s methodology.
Exhibit 3: China State Construction’s Upstream Indirect Emissions Attribution
Source: GMO
We note that the indirect emissions exposures above include all direct and indirect effects estimated across the end-to-end value chain of China State Construction. For example, if one of China State Construction’s Metals suppliers also supplies materials to other suppliers of China State Construction, our model captures that additional indirect emissions exposure from the Metals industry. For every company in the GMO Indirect Emissions model, we capture all direct and indirect value chain emissions exposures from suppliers, suppliers-of-suppliers, customers, and customers-of-customers. This enables us to completely assess a given company’s carbon transition risk.
Tracing Indirect Emissions by Sector
As shown, our approach provides complete transparency and allows us to interpret and investigate the underlying sources of indirect emissions exposure of companies. It also provides flexibility in aggregating results to gain a top-down, macro perspective.
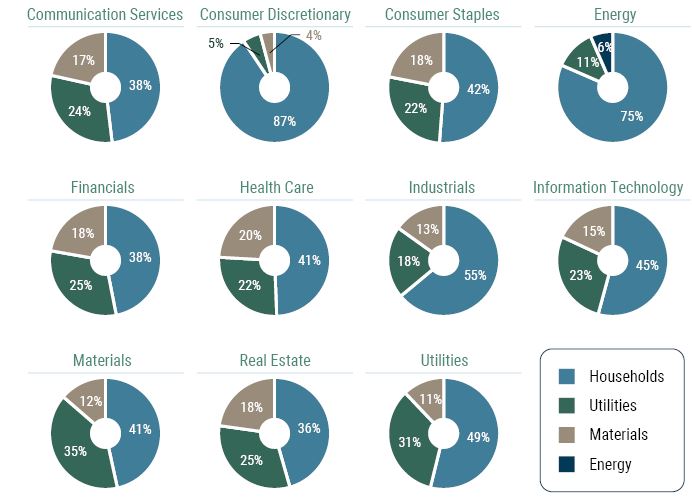
Here, we aggregate indirect emissions of original emitters up to a GICS sector level [14], which provides a high-level view into how direct emissions propagate as indirect emissions between sectors (see Exhibits 4A and 4B). For example, the Utilities sector has the largest scope 1 emissions intensity of any sector. However, our model shows that the Materials sector is the largest component of upstream emissions for the Real Estate, Materials, Information Technology, Industrials, and Consumer Discretionary sectors. In fact, Real Estate gets 56% of its upstream indirect emissions from the Materials sector, indicating that Materials suppliers represent a significant source of carbon transition risk for Real Estate.
Exhibit 4A: Origins of Indirect Emissions by Sector
Top 3 Upstream Contributors
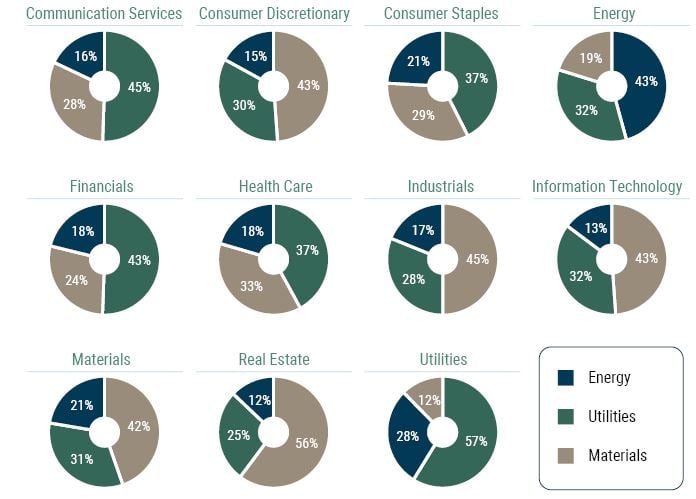
As of 9/30/2022 | Source: GMO
EXHIBIT 4B: ORIGINS OF INDIRECT EMISSIONS BY SECTOR
Top 3 Downstream Contributors
As of 9/30/2022 | Source: GMO
Additionally, this analysis shows the large impact of household emissions on company indirect emissions. In fact, household emissions total 4,700 MTCO2e, a significantly larger amount than the total scope 1 emissions of all Utilities companies in the model universe (3,900 MTCO2e). The household data set includes emissions generated by households from residential use (oil and natural gas) and transportation (gasoline) globally, covering 66 individual countries (all OECD, G20, European Union, and ASEAN) and a "Rest of World" region.
Looking back at our sector tracing results, the impact of household emissions on indirect emissions is largest on the Consumer Discretionary sector, which includes automotive manufacturers, and the Energy sector. These emissions continue to flow to all suppliers of those sectors as downstream indirect emissions. This analysis also helps us see clearly that household management of carbon transition risk would have significant impact across sectors. For example, should households decrease their spending on oil, natural gas, and gasoline, the Industrials sector would face significant downstream financial risk as the direct effects on energy companies, utility companies, and automotive manufacturers would propagate upstream in their supply chains to industrial companies.
A Step Further: Carbon Efficiency Comparisons
We can also apply our indirect emissions estimates to investigate the carbon efficiency of sectors in terms of embodied emissions per dollar of revenue (see Exhibit 5). We find the Energy, Utilities, and Materials sectors are the least carbon efficient in terms of indirect emissions, while Real Estate, Financials, and Communication Services are the most carbon efficient. These indirect emissions leaders and laggards are the same when considering total carbon footprint, albeit with a slightly different ordering. We omit scope 2 from this analysis because the GMO Indirect Emissions model already includes emissions from the generation of purchased electricity, steam, heat, or cooling.
Exhibit 5: Breakdown of Sector Carbon Footprints
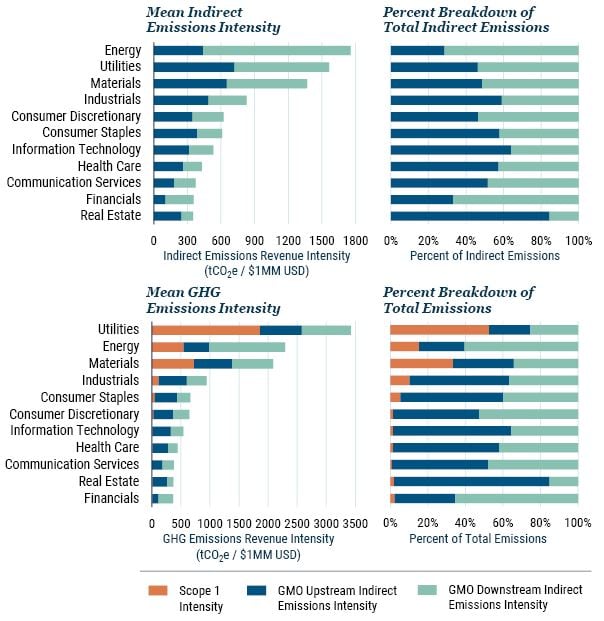
As of 9/30/2022 | Source: GMO
The Utilities sector represents the least carbon efficient sector with an average total exposure of 3,426 tCO2e per $1M revenue. The Financials sector is the most carbon efficient sector with an average total exposure of 366 tCO2e per $1M revenue. 4 Real Estate follows closely behind Financials with an average total exposure of 370 tCO2e per $1M revenue.
Overall, we find that indirect emissions account for 82% of company carbon footprints globally with a total impact 4.5 times larger than scope 1 emissions, reinforcing the importance of measuring and including indirect emissions in investment processes. This pattern of indirect emissions dominating carbon footprints holds for all sectors except Utilities, where scope 1 emissions account for 53% of its total sector carbon footprint. We observe similar patterns using reported scope 2 and 3 data, which combined account for 86% of company emissions with a total impact 6.4 times larger than scope 1 emissions.
Our detailed analysis shows that Industrials, Consumer Staples, Information Technology, Health Care, Communication Services, and Real Estate all have larger overall upstream indirect emissions than downstream indirect emissions. Therefore, direct and indirect suppliers pose greater carbon transition risk to these sectors than customers. Conversely, Energy, Utilities, Materials, Consumer Discretionary (including automotive manufacturers), and Financials have larger downstream indirect emissions components than upstream, indicating these sectors face most indirect carbon transition risk from their direct and indirect customers.
Comparing GMO Indirect Emissions to Reported Scope 3
As described above, reported scope 3 data are not comparable across companies due to inconsistent estimation methodologies. This makes reported scope 3 difficult to use in practice beyond monitoring a single company's value over time and is among our primary motivations for developing the GMO Indirect Emissions model. Despite this limitation, we should still investigate the relationship between reported scope 3 and GMO Indirect Emissions. 5
We find that the GMO Indirect Emissions model estimates have a positive correlation of 0.70 with combined scope 2 and 3 values (see Exhibit 6). Correlations across sectors are similar, ranging from 0.59 (Real Estate) to 0.81 (Communication Services). These relatively high positive correlations indicate the GMO Indirect Emissions model is largely consistent with reported scope 2 and 3, even though scope 2 and scope 3 data are not used in the model. This result gives us confidence that we have not significantly strayed from the spirit of GHGP scope 3 in creating a globally consistent indirect emissions model for asset managers.
Exhibit 6: Correlation of GMO Indirect Emissions with Scope 2 and 3
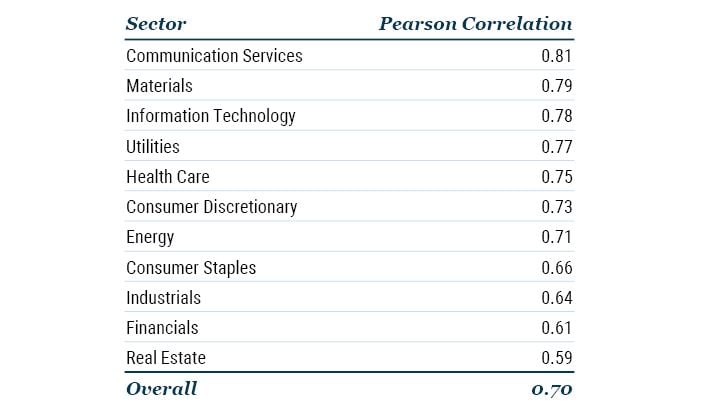
As of 9/30/2022 | Source: GMO
Application in Emissions-Constrained Portfolios
To show how the GMO Indirect Emissions model could be used in portfolio construction, we compare the sector exposures and market betas of three hypothetical portfolios constrained by different measures of total portfolio carbon footprint (see Exhibit 7). Using MSCI ACWI as a benchmark, our hypothetical portfolios are each created to have a total portfolio emissions intensity at least 50% below the benchmark. We define portfolio emissions intensity as the portfolio weighted sum of company emissions divided by company market capitalization. Our first hypothetical portfolio uses scope 1 + scope 2 emissions (blue bars), our second hypothetical portfolio uses scope 1 + the GMO model’s indirect emissions (green bars), and our third hypothetical portfolio uses scope 1 + scope 2 + scope 3 emissions (orange bars). In this analysis, we utilize reported and modeled scope 1, scope 2, and scope 3 data from Trucost [15].
Our hypothetical portfolios are long-only and fully invested with an optimization objective to minimize the sum of squared active positions versus the benchmark across securities. We simulate the performance of these portfolios from 2019 through Q2 2022 with monthly rebalancing and calculate mean active positions for each sector.
Exhibit 7: Comparing Effects of Emissions Methodologies on Hypothetical Portfolio Active Positions
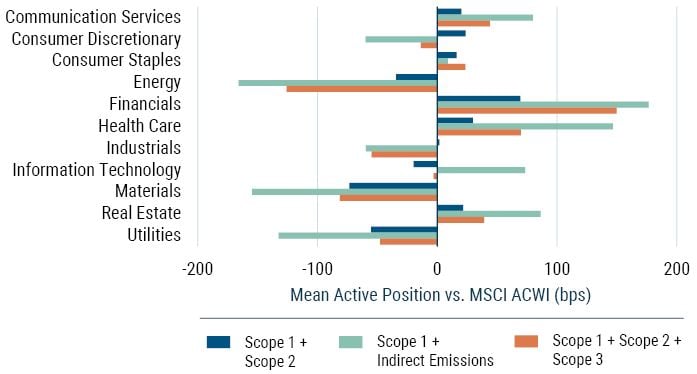
As of 9/30/2022 | Source: GMO
The GMO Indirect Emissions and scope 1 + scope 2 + scope 3 portfolios take the same directional active positions in all sectors except Information Technology. The GMO Indirect Emissions portfolio takes larger active positions on average (104 bps) than the scope 1 + scope 2 + scope 3 portfolio (59 bps). Comparing these two portfolios to the scope 1 + scope 2 portfolio shows different directional active positions in the Consumer Discretionary, Industrials, and Information Technology sectors. This result indicates that considering end-to-end value chain emissions, instead of only scope 2, does materially change portfolio sector exposures.
All three portfolios do not show statistically significant differences in ex post beta and have relatively low turnover rates of ~3% per month on average. Overall, we conclude that the GMO Indirect Emissions model has sensible effects on portfolio construction, behaving similarly to other emissions constraints while providing suitable, globally consistent estimates.
Conclusion
In this paper, we present the GMO Indirect Emissions model, a novel methodology for estimating indirect emissions embodied in end-to-end company value chains. Our model provides a single consistent estimation methodology applied globally, meaning we can compare estimates across our investable universe. We leverage bottom-up data that distinguishes companies from their peers based on characteristics of their specific value chains. We further calculate indirect emissions by propagating the original direct emissions through our global supply chain model, which consistently applies double counting and provides full interpretability of model estimates.
To fully understand our clients’ exposure to carbon transition risk in our portfolios, our investment teams require a comprehensive measure of emissions exposure across end-to-end company value chains – the GMO Indirect Emissions model is a unique and powerful tool that does just this. We are actively exploring ways to integrate this model into GMO strategies as well as our company engagement process.
Moving forward, we are excited about the possibilities for continuing to improve and expand the model. Future research could include topics such as exploring how companies are actively decreasing their carbon transition risk through avoided emissions or increasing their exposure to carbon transition opportunities through emissions removal. We aim to continue to add perspectives to the model so that GMO investment teams have an increasingly complete picture of the portfolio impacts of climate change.
Appendix
Double Counting
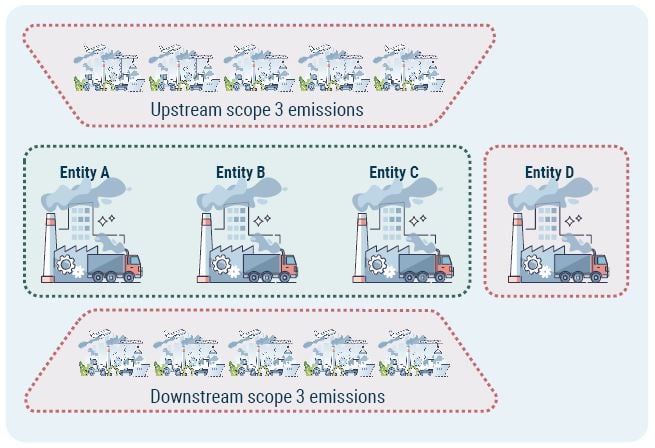
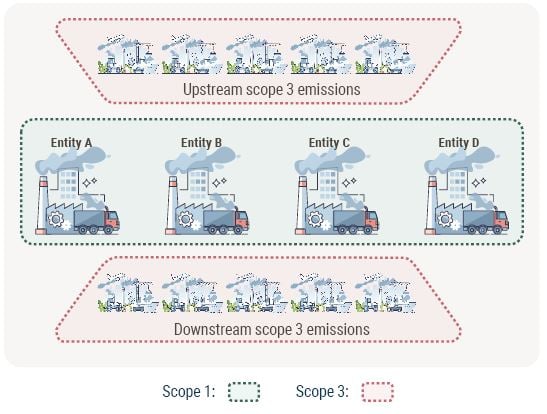
Indirect emissions, including scope 2 and scope 3, occur from sources owned or controlled by other entities in a company’s value chain. Emissions accounting across value chains results in counting the same tonne of emissions multiple times, an issue referred to as “double counting.” GHGP provides a useful example: “…the scope 1 emissions of a power generator are the scope 2 emissions of an electrical appliance user, which are in turn the scope 3 emissions of both the appliance manufacturer and the appliance retailer [9].” For asset managers, the problem of double counting depends on how the data is being used.
When evaluating companies based on their indirect emissions intensities during portfolio construction, we seek to compare total company exposures to all emissions across their end-to-end value chains. In this comparison, double counting does not present a problem unless it occurs inconsistently. For example, if two identical companies choose different consolidation approaches when reporting scope 3, they will double count scope 1 emissions differently, resulting in different scope 3 estimates. Exhibit 8 provides an example from the GHGP scope 3 standard that demonstrates how different consolidation approaches (i.e., “operational control” versus “equity share”) can change how emissions are counted across scopes [9].
Exhibit 8: Effects of Consolidation Approach on Scope 3 Emissions
Using the operational control approach
Using the equity share approach
The GMO Indirect Emissions model avoids this issue by applying a single estimation methodology globally. This ensures double counting is applied consistently across all companies, so our estimates are comparable across companies during portfolio construction.
However, if an asset manager wishes to use indirect emissions to estimate an absolute risk factor (e.g., climate value at risk), double counting will lead to an overestimation of risk. Therefore, the effects of double counting must be removed before this type of calculation. Other models that primarily leverage sector or industry emissions intensities must resort to a single global adjustment based on a ratio of scope 1 to scope 3 [16]. However, our model calculates indirect emissions from the bottom up. By propagating scope 1 and household emissions through our supply chain model, the GMO Indirect Emissions model allows us to adjust double counting specifically for each company. This bottom-up approach provides our asset managers with a more precise perspective when calculating risk measurements using indirect emissions.
Download article here.
References
[1] The Economist Intelligence Unit (EIU), "The cost of Inaction: Recognizing the Value at Risk from Climate Change," 2015.
[2] Task Force on Climate-related Financial Disclosures (TCFD), "Task Force on Climate-related Financial Disclosures: Overview," 2022.
[3] M. Carney, "The world needs a new, sustainable financial system to stop runaway climate change," 2020.
[4] G. Shrimali, "Scope 3 emissions: measurement and management," The Journal of Impact and ESG Investing, 2022.
[5] U.S. Securities and Exchange Commission (SEC), "SEC Proposes Rules to Enhance and Standardize Climate-Related Disclosures for Investors," 2022.
[6] TCFD, "Task Force on Climate-related Financial Disclosures: Guidance on Metrics, Targets, and Transition Plans," 2021.
[7] Greenhouse Gas Protocol (GHGP), "Technical Guidance for Calculating Scope 3 Emissions," 2013.
[8] Z. Ma, "Global ESG Research: The state of Scope 3 reporting – time to move beyond measuring business travel emissions," 2021.
[9] GHGP, "Corporate Value Chain (Scope 3) Accounting and Reporting Standard," 2013.
[10] The Organisation for Economic Co-operation and Development (OECD), "OECD Inter-Country Input-Output Database," 2021.
[11] J. J. Guilhoto, "OECD Global Inter-Country Input-Output Tables," 2021.
[12] OECD, "Trade in embodied CO2 (TECO2) Database," 2021.
[13] International Energy Agency (IEA), "Energy Efficiency Indicators Highlights," 2022.
[14] MSCI, "Global Industry Classification Standard (GICS) Methodology," 2022.
[15] S&P Global Market Intelligence, "Trucost Environmental Data Methodology Guide: Corporate Environmental Performance," 2020.
[16] MSCI ESG Research, "Scope 3 Carbon Emissions Estimation Methodology," 2022.
[17] G. Hall and K. Liu and L. Pomorski and L. Serban, “Supply Chain Climate Exposure,” Financial Analysts Journal, 2023, 79(1): 58-76. DOI: 10.1080/0015198X.2022.2129946.
The authors thank the following GMO colleagues for their expertise and assistance in the presented work: George Sakoulis, Hylton Socher, Roy Henriksson, and Mark Nitzberg.
What are Scope 1, 2, and 3 emissions?
- Scope 1: Direct greenhouse gas (GHG) emissions from operations owned or controlled by an organization.
- Scope 2: Indirect GHG emissions from the generation of electricity purchased and consumed by an organization.
- Scope 3: Indirect GHG emissions from sources and activities within the value chain of an organization that are not owned or controlled by that organization.
The GMO Indirect Emissions model does not currently include financed emissions in its estimates, so this result may change when financed emissions are added in a future version of the model.
Upon first glance, the distributions are highly skewed and contain outliers, so we apply a log-transformation to the data to help in our comparison.
Another challenge is highlighted in Hall et al. (2023) that scope 3 emissions is primarily motivated by carbon accounting rather than climate risk [17].
Disclaimer: The views expressed are the views of Christopher Heelan, Kenneth Hsu, Timothy J. Wheeler, and Deborah Ng through the period ending July 2023, and are subject to change at any time based on market and other conditions. This is not an offer or solicitation for the purchase or sale of any security and should not be construed as such. References to specific securities and issuers are for illustrative purposes only and are not intended to be, and should not be interpreted as, recommendations to purchase or sell such securities.
Copyright © 2023 by GMO LLC. All rights reserved.
The authors thank the following GMO colleagues for their expertise and assistance in the presented work: George Sakoulis, Hylton Socher, Roy Henriksson, and Mark Nitzberg.
What are Scope 1, 2, and 3 emissions?
- Scope 1: Direct greenhouse gas (GHG) emissions from operations owned or controlled by an organization.
- Scope 2: Indirect GHG emissions from the generation of electricity purchased and consumed by an organization.
- Scope 3: Indirect GHG emissions from sources and activities within the value chain of an organization that are not owned or controlled by that organization.
The GMO Indirect Emissions model does not currently include financed emissions in its estimates, so this result may change when financed emissions are added in a future version of the model.
Upon first glance, the distributions are highly skewed and contain outliers, so we apply a log-transformation to the data to help in our comparison.
Another challenge is highlighted in Hall et al. (2023) that scope 3 emissions is primarily motivated by carbon accounting rather than climate risk [17].