When we first published this piece 18 months ago, we concluded that “we anticipate looking back on this current period as a generationally attractive entry point for EM local debt.”
At the time, our perspective was met with skepticism. The U.S. dollar was still on the rise, and few could foresee anything that might alter its course.
Fast forward to today, and we believe such catalysts have arrived. Markets have shifted, the dollar has weakened, and our EM local debt portfolios have shown early gains.
We continue to believe we are seeing a rare opportunity in EM local debt, and our conviction has been strengthened by the Trump administration’s trade and economic policies, which suggest continued dollar weakness and relative strength for EM local currencies.
In light of these recent developments, we are republishing this paper as it was originally written in early 2024 because we are confident that the opportunity remains as compelling for investors today as it was when we first identified it. At GMO, we are emphasizing EM local debt and FX in both dedicated and multi-asset portfolios.
Originally published January 2024
In this piece we compare two ways to take advantage of the USD’s richness versus emerging market currencies: EM equities and EM local currency debt. We believe that for relative value, diversification, and potential alpha reasons, EM local currency debt deserves a prominent place in portfolios today.
The USD takes roughly decade-long swings relative to global currencies, wielding a significant impact on returns to USD-based assets relative to non-USD assets. When the dollar is cheap, as it was around 2011, its rise drained returns to foreign stocks and bonds. But, when it’s rich, as it is now, its decline portends a boost.
Exhibit 1: Impact of Depreciating/Appreciating USD on Emerging Assets
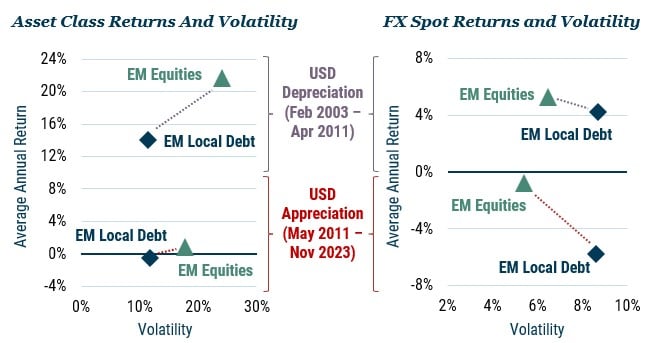
As of 11/30/2023 | Sources: J.P. Morgan, Bloomberg, GMO, MSCI
Exhibit 1 looks at non-USD asset class returns in the left chart and isolates FX spot returns of those same asset classes on the right chart during two periods in history: the 2003-2011 period, when the USD’s decline from expensive levels boosted returns to foreign equities and bonds; and the more recent 2011-present period, when a cheap USD’s rise did the opposite. Comparing the two periods, the USD’s recent rise cut the Sharpe ratio of local debt from 1.0 to -0.1 and emerging equities from 0.8 to 0.
The second chart highlights how different the baskets of EMFX are among EM equities and EM local currency debt. EM equities (MSCI EM) are made up predominantly of Asian currencies that over history have been either pegged or managed relative to the USD. This has resulted in lower USD-relative volatility of the MSCI-EM basket. The local currency debt basket (GBI-EMGD) has been the most volatile, comprising over its history Latin American currencies as well as CEEMEA, of which many of the latter are more tethered to the euro. Until China joined GBI-EMGD in 2020, Asia was only about 30% of GBI-EMGD. In both cases, the return/volatility ratios fell sharply during the USD rise period relative to the USD decline period: from 0.5 to -0.7 for local debt and from 0.8 to -0.1 for EM equities.
Going forward, we see many factors currently in place that are bullish for EM local debt—arguably the best set of conditions we have seen in twenty years, based on valuations, diversification considerations, and alpha potential.
For EM currencies, current valuations are reminiscent of the 2003-2011 period
Exhibit 2: Emerging Assets Currency Valuation vs. USD
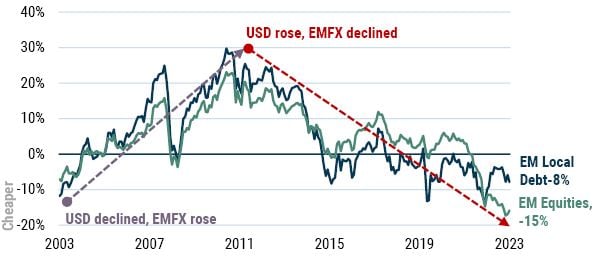
As of 11/30/2023 | Source: J.P. Morgan, MSCI, Haver, Bloomberg, GMO
The most recent Emerging Local Debt valuation estimate is based on projected country weights after including India in the index universe.
Exhibit 2 shows the USD’s expensiveness in general on a Behavioral Equilibrium Exchange Rate, both against EM equities (MSCI EM) and EM local currency debt (GBI-EMGD). This valuation metric adjusts the real exchange rate for structural changes in the underlying fundamentals over time (rising per-capita GDP, terms of trade, productivity, and inequality, among others). After all, these countries are emerging, so the expectation of mean reversion on an unadjusted PPP (real exchange rate) model can sometimes be unrealistic; the Behavioral Equilibrium Exchange Rate is more useful in that respect.
After valuation, we identify two other factors that are generally supportive of returns to EM currencies: interest rates and growth differentials.
Exhibit 3: Average Nominal and Real Yields
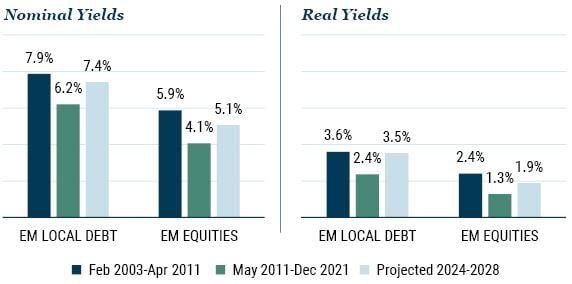
Sources: Bloomberg, Consensus Economics, J.P. Morgan, MSCI, GMO
On interest rates, Exhibit 3 shows average nominal and real interest rates by the local debt and EM equities baskets. In both cases, current interest rates are essentially back to the 2004-2011 average, offering high total return potential above spot FX appreciation. It’s extremely rare to get this combination of cheap currencies with high rates – and it doesn’t generally last long.
As an aside, we observe that local debt rates are always higher than EM equity rates, again due to compositional differences given that Asian currencies are typically lower yielding than those in Latin America or CEEMEA. This latter fact relates to the relative stage of development of local capital markets. An increasing number of GBI-EMGD countries have become more and more comfortable with conventional inflation-targeting policy regimes. It goes hand-in-hand with the development of their local capital markets, which provided reliable funding sources in the Covid-shock era and beyond. Seeing the benefits, we believe countries will continue on the path of market communication, transparency, and orthodox monetary policy, which is likely a very positive relative structural backdrop for the local debt countries relative to the EM equity countries.
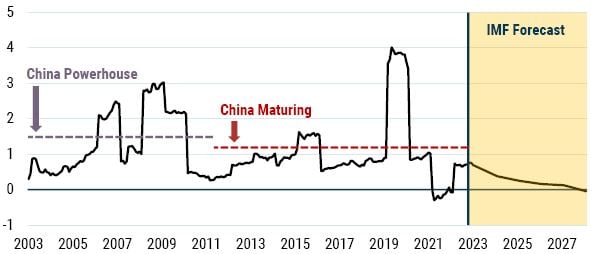
Exhibit 4: EM/U.S. Real Growth Differentials
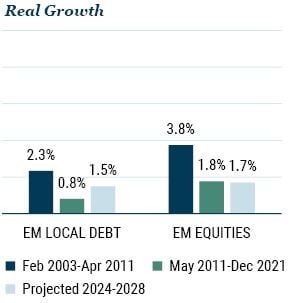
Sources: IMF WEO, J.P. Morgan, MSCI, GMO
On growth differentials (Exhibit 4 displays the two EMFX baskets versus the U.S.) we are a little less confident. The 2003-2011 period saw a very high EM-DM GDP growth differential, which may have been supportive of capital flows to emerging countries, which in turn bolstered their currencies. It was a relatively unique period in which China was at maximum velocity in terms of investment spending, driving up commodity prices and pulling a lot of countries up in its wake. The period we are embarking on now is likely to feature lower overall global growth rates, and perhaps lower EM-DM growth differentials, suggestive of less support for EMFX versus the USD relative to the 2003-2011 period. Interestingly, the growth gap the MSCI EM countries enjoyed relative to GBI-EMGD countries in earlier periods is projected to disappear in the future (more on this below).
Diversification Considerations
On whether to choose the MSCI-EM or the GBI-EMGD basket to capture EM-DM growth differentials, we’d advocate allocating to both. First, given the different country compositions and index construction methods (GBI-EMGD caps weights of larger countries at 10%), allocating to both results in a more diversified country composition than owning either one alone. Second, we believe the regional growth drivers may be different in the future than they’ve been in the past.
Exhibit 5 shows the evolution of the growth differential between the basket of MSCI EM countries and the GBI-EMGD countries over time. Historically, this growth differential has favored the Asia-heavy MSCI EM countries, particularly China, which had both a high weight and high growth. However, going forward, using the IMF WEO forecasts and taking into consideration the upcoming addition of India to GBI-EMGD at a maximum 10% weight, this differential is projected to drop to zero. Indonesia is also another important diversifying country (10% GBI-EMGD vs. about 2% In MSCI EM) given its high growth, good fundamentals, and ongoing good policy management. Indonesia is the second biggest contributor to growth (about 15%) in the GBI-EMGD.
Exhibit 5: Real GDP Growth (%) of MSCI-EM less GBI-EMGD
Source: J.P. Morgan, Bloomberg, MSCI, IMF
A final point in support of local debt is the availability of investing in more “frontier” EM local debt markets; among them are Jamaica, Dominican Republic, Costa Rica, and Uruguay. If we look at the average growth of frontier/emerging countries that have accessible local debt markets from 2024 to 2028, the IMF estimates such growth at 4.5%, much higher than the current growth prospects of the MSCI EM basket countries (3.6% on average). Investing in these frontier opportunities via EM equities is not a meaningful prospect.
Alpha Potential
Here’s where we at GMO get most excited. Emerging debt markets are inefficient. Across EM hard currency debt and local currency debt, eVestment data shows that the median manager beats the benchmarks and the respective ETFs of both asset classes consistently over time. 1 We at GMO are proud to report that our hard and local currency emerging debt strategies have also done so, with top quartile/decile results. 2 It’s a reason our Asset Allocation division has retained its emerging debt allocations even when valuations have been on the skinny side – alpha has been reliable.
In local debt in particular, we’ve invested significant resources in recent years to upgrade our EMFX and local rates alpha programs, and it has been paying off. When combined with our trademark security selection alpha focus, which draws from the full blended hard currency/local currency/corporate investment universe, we are quite confident in our prospective alpha potential.
Exhibit 6: EM debt performance over time
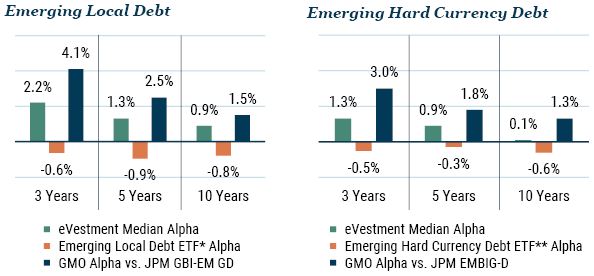
As of 9/30/2023 | eVestment, iShares by BlackRock
* iShares J.P. Morgan Emerging Local Government Bond UCITS ETF USD
** iShares J.P. Morgan USD Emerging Markets Bond ETF
Performance data quoted represents past performance and is not predictive of future performance.
Conclusion
Based on our reading of valuations in particular, we anticipate looking back on this current period as a generationally attractive entry point for EM local debt. The USD overvaluation is at relatively extreme levels, likely to provide a strong ongoing tailwind for non-dollar assets in general. We believe EM local debt can be a powerful way to capitalize on this, as a supplement to both EM equities and other asset classes.
Download article here.
For the 3-, 5-, and 10-year periods ending 9/30/2023.
GMO’s Emerging Country Debt Strategy (hard currency) ranked in the 13th, 17th, and 3rd percentiles (out of 115, 102, and 79 observations) for the 3-, 5-, and 10-year annualized performance periods, respectively, among the eVestment Global Emerging Markets Fixed Income – Hard Currency universe. GMO’s Emerging Country Local Debt Strategy (local currency) ranked in the 10th, 13th, and 27th percentiles (out of 75, 71, and 56 observations) for the 3-, 5-, and 10-year annualized performance periods, respectively, among the eVestment Global Emerging Markets Fixed Income – Local Currency universe.
Disclaimer: The views expressed are the views of Victoria Courmes and the Emerging Country Debt team through the period ending January 9, 2024, and are subject to change at any time based on market and other conditions. This is not an offer or solicitation for the purchase or sale of any security and should not be construed as such. References to specific securities and issuers are for illustrative purposes only and are not intended to be, and should not be interpreted as, recommendations to purchase or sell such securities.
Copyright © 2024 by GMO LLC. All rights reserved.
For the 3-, 5-, and 10-year periods ending 9/30/2023.
GMO’s Emerging Country Debt Strategy (hard currency) ranked in the 13th, 17th, and 3rd percentiles (out of 115, 102, and 79 observations) for the 3-, 5-, and 10-year annualized performance periods, respectively, among the eVestment Global Emerging Markets Fixed Income – Hard Currency universe. GMO’s Emerging Country Local Debt Strategy (local currency) ranked in the 10th, 13th, and 27th percentiles (out of 75, 71, and 56 observations) for the 3-, 5-, and 10-year annualized performance periods, respectively, among the eVestment Global Emerging Markets Fixed Income – Local Currency universe.