Executive Summary
Though investors often observe that the EM/DM real yield continues to widen, seeking to earn this additional EM risk premia comes with managing associated risks. In this paper, we discuss why we believe a quality-tilted emerging market local currency debt portfolio offers the benefits of accessing emerging market risk premia while preserving the defensive properties of developed market bonds.
The EM/DM Real Yield Gap Continues to Widen
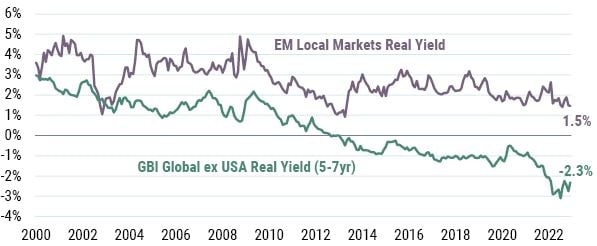
As of 12/31/2022 | Sources: J.P. Morgan, Consensus Economics, GMO
In emerging market debt, we believe quality means having intrinsic strength measured by strong macroeconomic fundamentals and explicit defensive properties. We define higher quality emerging markets as those with low inflation, low fiscal deficits, and a low need for external financing, as well as those with high savings and equity market capitalizations. We can create an EM Quality Local Currency Debt strategy by implementing this definition. Our analysis of the risk/reward properties of such a strategy shows that it provides a viable alternative to non-U.S. developed market exposure, offering a solution to investors that seek EM exposure but may not be ready to embrace the full spectrum of volatility and idiosyncratic risk inherent to the asset class.
GMO EM Quality Debt Model Portfolio
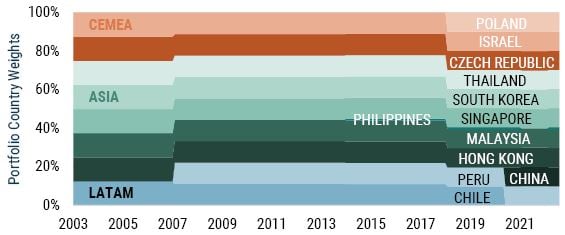
Period: June 2003 – December 2022 | Source: GMO
As the authors show, constructing a portfolio along these principles allows investors to preserve a higher real yield over time as compensation for a quality premium in emerging markets.
EM Quality Debt has Higher Real Yield Than DM with Duration Similar to EM
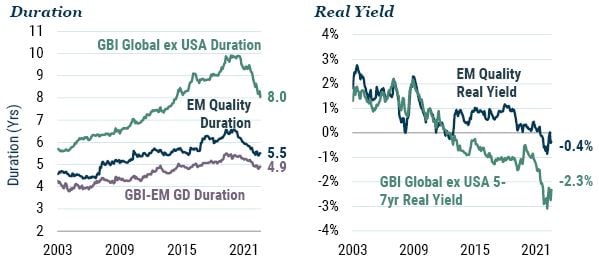
Period: June 2003 – December 2022 | Sources: GMO, J.P. Morgan, Consensus Economics
Ultimately, the full power of this strategy can only be realized by partnering with clients to develop solutions that meet their specific investment objectives. For example, the strategy can serve as a core EM debt exposure or be combined with additional sources of EM debt returns – such as currency, rate, and security selection – to provide an integrated, tailored solution. When it comes to designing a portfolio that meets the unique challenges facing EM debt investors, we believe the defensive and yield capture properties of EM quality debt are key pieces of the investment puzzle.