Note: This article was originally written as a letter to clients on February 2, 2026. The views expressed are subject to change at any time based on market and other conditions.
Deep value stocks remain our highest conviction long-only investment idea. Globally, they trade at abnormally wide discounts and offer attractive expected returns in an environment where many equities trade at elevated valuation levels. Further, given the breadth of companies within the deep value group, we can build portfolios trading at substantial discounts to traditional value indexes with similar quality metrics.
In 2025, the MSCI World Value index trailed the MSCI World Growth index by just 30 basis points (bps), but once again, an investor’s experience varied widely depending on the region. However, each of GMO’s deep value ETFs beat their respective value benchmarks, regardless of whether they were investing in the U.S. or in developed markets outside the U.S.
EXHIBIT 1: GMO DEEP VALUE ETFS BEAT THEIR VALUE BENCHMARKS
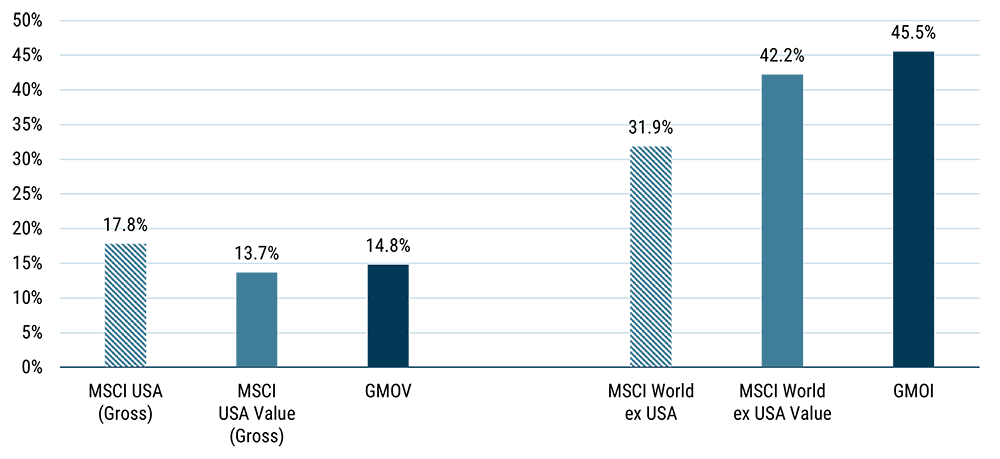
Returns for period from 12/31/24–12/31/25 | Source: GMO. Past performance is not indicative of future results.
GMO U.S. Deep Value
The GMO U.S. Value ETF (ticker: GMOV) returned 14.8% (net) for the year. This beat the benchmark MSCI USA Value (Gross) index return of 13.7% but trailed the MSCI USA (Gross) index return of 17.8%. In the context of the market background, this was a heartening result, as a deep value approach might typically be expected to do better (worse) than a core value approach in an environment where the value style is a winner (loser).
All of the portfolio’s outperformance of the value index was due to strong security selection within the value universe, driven by our proprietary value models, which consider an asset’s growth and quality characteristics as well as just headline “cheapness.” Success within Financials and Communication Services provided the most significant contributions to relative performance.
The selection within Financials was extremely solid across the board, with a portfolio return of 26.0% versus an index return of 21.2%, which added meaningful relative performance as the sector makes up more than a fifth of the value universe. Communication Services added a similar amount despite being a smaller part of the value universe, as the portfolio returned an impressive 15.4% versus index performance of 4.7% for the sector. This was primarily about our weight in Alphabet (3.1%) and Meta (2.5%). We were overweight Alphabet, which was a strong performer for the year. We were overweight Meta for the explosive performance at the start of the year, when it was not considered a value stock and had a zero weight in the index. It was moved into the value index mid-year at a time when we no longer considered it to be screamingly cheap, and so we were successfully underweight for the second half of the year when its performance was lackluster.
When we consider why MSCI USA Value underperformed the broad market, two things leap out. The first was the unfortunate timing of the reclassification of Meta, which is such a big stock that it can really move the needle (Meta was up a little over 10% for the year as a whole, despite being down almost 10% for the second half of 2025). The second was the exposure to Information Technology. This was the best-performing sector in the MSCI USA Value index, up 29.8%, but the value index has just over a 10% exposure to Information Technology, compared to over 30% in the broader MSCI USA index. We very much believe that some of the Information Technology stocks remain precariously priced and are amazed by just how much positive sentiment there was for lower-quality and risky stocks as the year progressed. Exhibit 2 illustrates just how much increased risk appetite drove the market since the lows of “Liberation Day.”
EXHIBIT 2: SPECULATIVE GROUPS CONTINUE TO LEAD THE MARKET
High momentum and lower quality groups rallied most following Liberation Day market lows
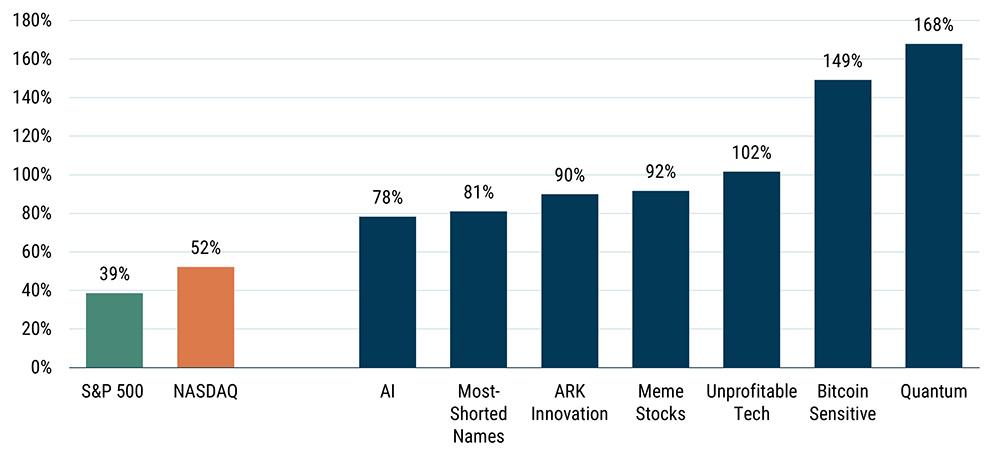
Returns for period from 4/8/25 – 12/31/25 | Source: Goldman SachsMost-Shorted Names is the Goldman Sachs Liquid Most Short index (GSXUMSAL) composed of 70 stocks with the highest short interest relative to equity float, optimized for liquidity and capping Biotech at 10%. Meme Stocks is the Goldman Sachs high retail sentiment basket (GSXUMEME) which consists of U.S.-listed equities that are most popularly mentioned on retail communities. The basket is liquidity optimized but may include stocks with potential borrow constraints. The Unprofitable Tech basket is composed of equities in tech related industries that did not report a profit in the last 12 months and are not expected to do so in the next 12 months. Goldman Sachs attempts to exclude companies exposed to winning themes such as AI, Nuclear, Quantum Computing, and Cryptocurrency, as well as highly shorted companies. The Goldman Sachs U.S. TMT AI Basket (GSTMTAIP Index) consists of companies that are pursuing artificial intelligence or can help enable new technologies across software, semiconductors, tech hardware, media, internet, and IT services. The basket is liquidity optimized to trade $500mm in a day at 10% ADV. Bitcoin Sensitive is the Goldman Sachs Bitcoin basket (GSCBBTC1) consists of U.S.-listed TMT stocks that are fundamentally related to Bitcoin across various segments (bitcoin mining, digital payment, crypto investment, and blockchain tech). The basket tends to track Bitcoin across cycles and is liquid to trade $100mm at 10% of volume.
GMO International Deep Value
The GMO International Value ETF (ticker: GMOI) returned 45.5% (net) for the year, beating both the benchmark MSCI World ex-USA Value index return of 42.2% and the MSCI World ex-USA index return of 31.9%. We were delighted not only by how much a value approach won outside of the U.S., but also by how much our deep value strategy outperformed a core value approach.
The Financials sector accounts for almost 40% of the MSCI World ex-USA Value index, and so, even though we were modestly underweight the sector for the year, it was no surprise that excellent performance there was the key driver of returns. In a manner typical of a deep value approach, we favored unfairly beaten-down Financials in Europe and Canada rather than the Japanese equivalents, and the portfolio enjoyed a 76.0% return in the sector versus 58.7% for the benchmark.
The only sector that exhibited underperformance was Industrials, hampered by an overweight to Japan. Our Japanese Industrial stocks were up a very respectable 34.9%, but this trailed the 43.8% return of the MSCI World ex-USA Value Industrials sector. Rather than disappointing stock selection, this was largely due to Japan underperforming as the MSCI Japan Value index was up 32%, lagging the MSCI World ex-USA Value index by 10%. We believe that Japan may well be a source of strong returns relative to other equity markets in the coming years.
The Opportunity Remains Extremely Compelling
In a world where some markets sit at or near all-time highs with elevated valuations, deep value offers compelling opportunities across regions. Deep value stocks are trading extraordinarily cheaply relative to broad markets and their own history. While timing is always uncertain, in an expensive world, we believe this combination positions them to deliver strong absolute and relative returns to investors.
Conservatively, we believe that U.S. deep value is priced to outperform the rest of the market by more than 50%.
EXHIBIT 3: WITHIN THE U.S., “DEEP VALUE” SEGMENT (CHEAPEST 20%) IS TRULY DISLOCATED
Valuation Groups in Top 1,000 U.S. Stocks
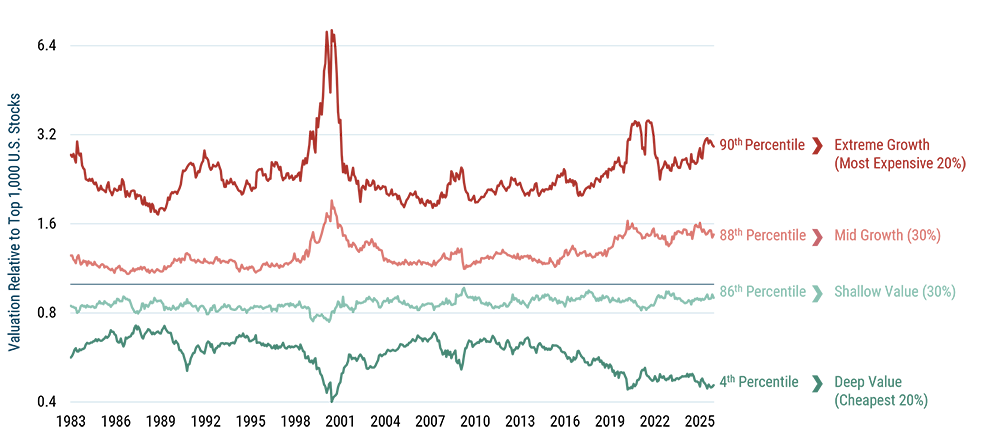
As of 12/31/25 | Source: GMO
Stock valuations are calculated on a blend of Price/Sales, Price/Gross Profit, and Price/Economic Book. Groups of value and market are weighted by square root of market cap.
In developed ex-U.S. equities, we believe that deep value is priced to outperform the rest of the market by roughly 20-30%. In addition to this compelling relative opportunity in deep value stocks, it should be noted that international equity markets generally are reasonably priced and stand to benefit further from the tailwind of cheap currencies. Combined, these factors result in an impressive forecasted real return of 8.2% for the international deep value cohort in USD.
EXHIBIT 4: IN DEVELOPED EX-U.S., “DEEP VALUE” (CHEAPEST 20%) IS EXCEPTIONALLY CHEAP
Valuation Groups in MSCI World ex-U.S. Universe
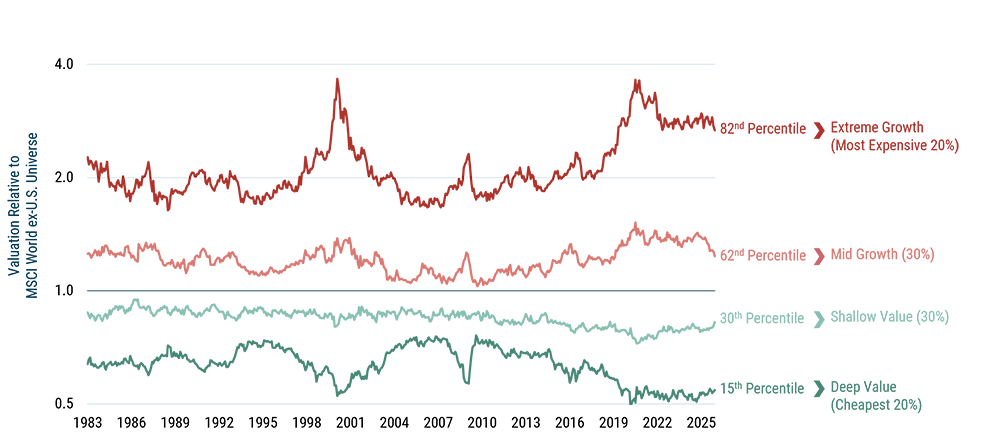
As of 12/31/25 | Source: GMO
Stock valuations are calculated on a blend of Price/Sales, Price/Gross Profit, and Price/Economic Book. Groups of value and market are weighted by square root of market cap. All groups have the same country exposure as the universe.
EXHIBIT 5: 7-YEAR GLOBAL REAL RETURN EQUITY FORECASTS* (USD)
December 31, 2025 – Low Scenario
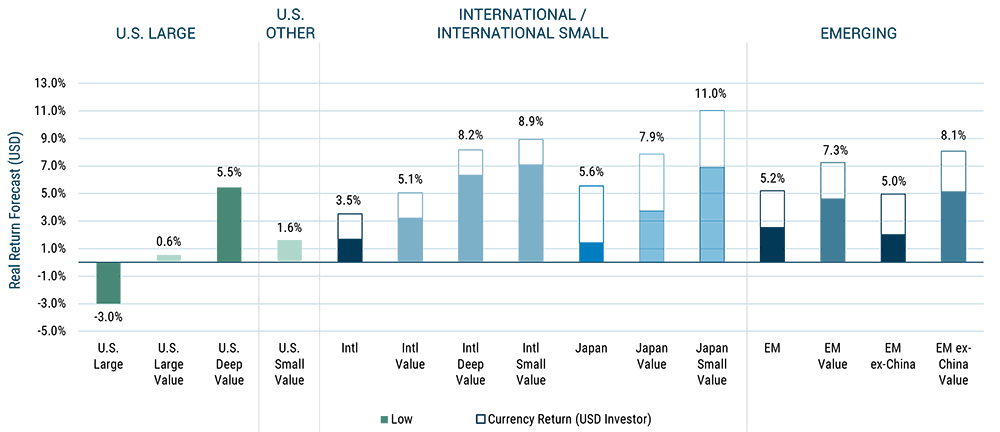
Source: GMO
*The chart represents real return forecasts for several asset classes and not for any GMO fund or strategy. These forecasts are forward-looking statements based upon the reasonable beliefs of GMO and are not a guarantee of future performance. Forward-looking statements speak only as of the date they are made, and GMO assumes no duty to and does not undertake to update forward-looking statements. Forward-looking statements are subject to numerous assumptions, risks, and uncertainties, which change over time. Actual results may differ materially from those anticipated in forward-looking statements.
A Considered Approach to Investing in Value
Investors are increasingly concerned about how their portfolios will perform when value roars back or when the U.S. market stumbles. Maintaining an exposure to value, either within the U.S. or across wider developed markets, can provide some peace of mind. Of course, one could do this passively by using value ETFs, for example, but we believe that this naïve approach can be overly reliant on flawed accounting metrics or index provider labels.
Our approach to value investing is differentiated in three ways:
- We look for top-down opportunities, which today causes us to focus on deep value—the cheapest 20% of stocks. This cohort is deeply dislocated, and when value wins, the deep value cohort always wins by more. We believe this is the best way to capture today’s unusual value opportunity.
- When selecting stocks, we look beyond the reported accounting data—GMO has fully restated the financial statements of every company in our investment universe so that they better reflect true fundamental value. For example, we consider research and development to be an actual investment, rather than simply a current expense.
- We develop forward-looking projections for every company in our investable universe. Our projections are uniquely calibrated to each company, fully accounting for that specific company’s quality and growth characteristics.
We aim to invest in stocks with very attractive valuations that are still strong, profitable companies while seeking to avoid value traps. The portfolios typically trade at a discount to other value approaches, while at the same time maintaining quality characteristics, like financial leverage and profitability, that are better than most passive value portfolios.
Deep value is the biggest active position across all of GMO’s asset allocation portfolios. We are expressing our enthusiasm for deep value with positions in our long-only U.S. and International Value strategies, as well as through Equity Dislocation (a market-neutral implementation that is 100% long the cheapest value stocks globally, and 100% short the most expensive growth stocks globally). In fact, we believe that allocations to deep value will undoubtedly continue to benefit most portfolios:
- Deep value strategies are a great substitute for existing passive or active value exposure—GMO’s portfolios go deep into value, so when value wins, we expect to outperform passive/traditional value.
- If you don’t have enough value exposure, use these strategies to make an opportunistic bet on value—value is deeply dislocated and is priced to significantly outperform growth in a reversion scenario.
- Finally, you can use the GMO U.S. Value ETF (GMOV) and the GMO International Value ETF (GMOI) to simply and effectively diversify away from the expensive and concentrated S&P 500.