Executive Summary
AI looks like a classic investment bubble to us, with very high valuations and signs of rampant speculation. But we recognize that while many investors harbor fears that AI might be a bubble, they are far from sure of that fact and tend to assume the market is appropriately priced as a fairly strong prior. In many bubbles, such a scenario would make building a strong portfolio close to impossible since the portfolio you’d hold if you believe in the bubble is a portfolio that would be crazy to hold if times were normal. The 2007-8 Everything Bubble and the 2021 Duration Bubble, for instance, were both bubbles in which the right portfolio to own if you believed there was a bubble was a portfolio that would have an unacceptably low expected return if markets were fairly priced. But the 2025 AI Bubble looks little like either of those two and much more like the 2000 Internet Bubble, in which a bubble-agnostic investor could have owned a portfolio with a reasonable risk/reward trade-off in either a bubble or a business-as-usual scenario. Today, non-U.S. equities, deep value stocks, and liquid alternatives offer returns that look reasonable or better, regardless of whether AI is in a bubble. Tilting a portfolio away from AI names and toward those assets may save investors a lot of pain if it turns out we are in a bubble without meaningfully reducing expected returns if financial markets are somehow still fairly priced today.
“It is difficult to get a man to understand something, when his salary depends upon his not understanding it.”
—Upton Sinclair
Introduction
I think most people can admit that there may well be a bubble in AI and related stocks today. I won’t spend a lot of time discussing the evidence, but there is plenty to point to. The S&P 500 is trading at valuation levels only seen during the Internet Bubble, and on some measures, is even more expensive now than it was then. 1 Among other signs of rampant speculation, frantic venture capitalists are throwing money at AI startups at multi-billion-dollar valuations without even being told their plans. 2 Equity investors are bidding up the value of giant companies by hundreds of billions of dollars due to investment deals with OpenAI, a company whose revenues would have to rise a hundredfold to make good on its promises. 3 Investors are so desperate to get in early on the next big thing that they’ve bid up the prices of quantum computing stocks 1200% or more over the past year, and at valuations that make Palantir look like a value stock. 4 It certainly looks like a bubble to us, although I don’t believe I’ll convince any true believers in the AI version of “this time it really is different” of that fact. 5 This letter is not written for the true believer, however. It is written instead for the “agnostic investor.” Such an investor is one who recognizes that there is plenty of evidence indicating we are in a bubble, but also harbors a belief that, despite that evidence, a decent starting assumption is that all assets are priced to deliver a normal return at all times. Bubbles are usually a problem for the agnostic investor, but some bubbles are more of a problem than others. The good news about today’s bubble is that it's one that allows an agnostic investor to build a portfolio that can strongly outperform if there is a bubble that ultimately bursts, and can also do just fine if all assets deliver normal returns.
A Taxonomy of Bubbles
One nice thing about 21st-century financial markets is that they’ve generated an interesting variety of bubbles well within the memory of most investors. When we made our case for the Internet Bubble in the late 1990s, our options were limited to the U.S. in 1929, the British Railway boom of the 1860s, and the Tulip Mania of the 1630s. 6 Outside of 1980s Japan, which had already been shrugged off as irrelevant to any “normal” country, the vast majority of investors hadn’t seen a meaningful investment bubble in their lifetimes. 7 But the last 25 years have given us three major bubbles in the developed world: the 2000 Internet Bubble, the 2007-8 Everything Bubble, and the 2021 Duration Bubble. Each of these bubbles varied significantly in terms of the assets involved and required investors to respond quite differently to protect their portfolios. Of them all, the current event looks most like the Internet Bubble of 2000, which should be a relief to the agnostic investor. While dynamic, valuation-driven asset allocation saved many investors considerable pain in all three bubbles, only in the 2000 event was it possible to spare yourself large losses without having to own a portfolio that would have been crazy to hold in any normal situation.
The Internet Bubble of 2000
The story of the Internet Bubble is familiar enough to most not to require a lot of retelling. The genuine breakthroughs in communications and computing that embodied the internet and (relatively) modern cell phone networks of the time sparked an investment frenzy where investors overestimated the rate of growth in communications traffic as well as the returns on investment for companies participating in the boom. Investors also did a poor and indiscriminate job of picking the eventual winners in the new economy that was being created. The S&P 500 rose to never-before-seen valuation levels, led by technology and telecommunications firms trading at unsustainably high valuations, sometimes with unsustainable business models as well. Vendor financing by suppliers and circular deals among internet firms created the illusion of greater activity and end-user demand than there actually was, and the S&P 500 ultimately fell by 45% in real terms from the summer of 2000 to the spring of 2003, while the tech-heavy Nasdaq Composite fell by 79%. It was a massive bubble that led to major pain for many investors, but that pain was largely avoidable, even for those without heroic prescience. To see why, it’s helpful to look at the height of the bubble through a valuation lens. Exhibit 1 shows a risk/reward scatterplot from June 2000 using the asset class forecasts we had published at the time. 8
Exhibit 1: Risk/Reward Trade-off in June 2000
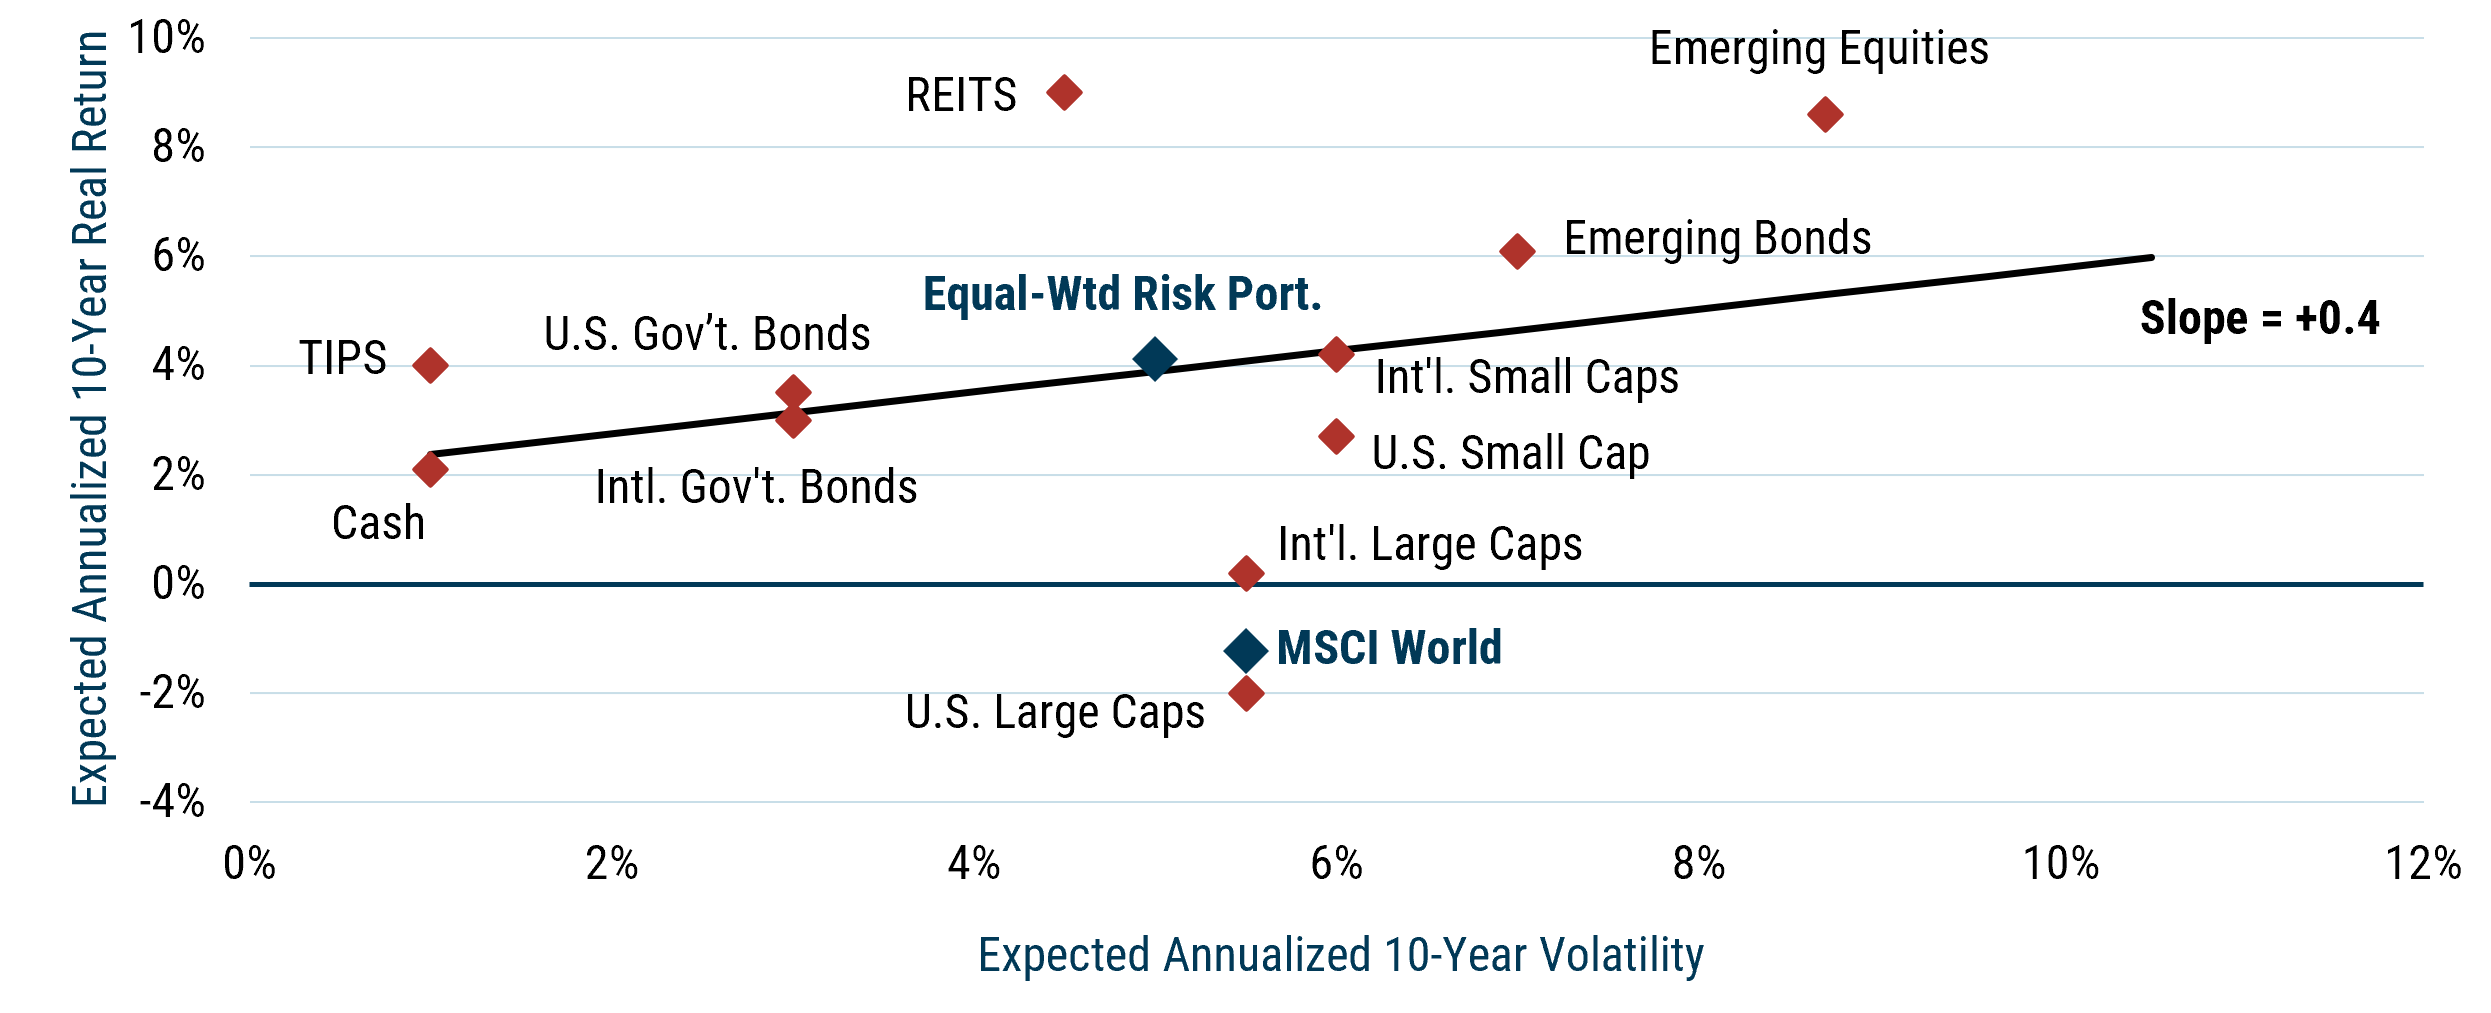
As of 6/30/2000 | Source: GMO
With U.S. large cap stocks trading at their highest valuations ever, their expected return was significantly negative in real terms. But for an investor prepared to look elsewhere, there was plenty to do. Several other risk assets were trading cheaply relative to history and offered better-than-normal expected returns. Despite the bubble, investors were actually getting paid nicely for taking risk overall. Drawing a risk/reward regression line through the forecasts illustrates this: the line’s slope of +0.4 is not far off an equilibrium slope of +0.6. The benefit to diversifying beyond a cap-weighted portfolio was huge; an equal-weighted portfolio of the risk assets we forecasted had an expected return of +4.1% real, far higher than the MSCI World’s -1.2%.
It is worth noting that these forecasts were not driven by any assumption about the timing of the bubble bursting—they merely assumed asset prices would smoothly revert to fair value over 10 years. You didn’t need to believe you knew when the bubble would burst to understand that you were better off owning other assets. And you didn’t need to reduce your overall holdings of equities or risk assets in general. With TIPS offering 4% real yields, moving money into lower-risk assets certainly wasn’t a crazy idea, and we did have higher-than-normal exposures to bonds in our portfolios, but it was actually pretty easy to build a diversified portfolio of risk assets trading at very attractive prices. It only required a willingness to accept a fair bit of tracking error relative to a traditional cap-weighted equity portfolio. If our agnostic investor believed there was a 50% chance that all assets were fairly priced and a 50% chance that valuations would eventually mean-revert (as our forecasts assumed), the answer was pretty obvious. A portfolio of international small caps, REITs, emerging equity, and emerging debt, alongside developed market government bonds, was the one to own. 9 If everything had turned out to be priced fairly, the portfolio’s risk and return expectations would have been very similar to those of a “normal” balanced portfolio. But unlike the normal portfolio, this portfolio would still have a strong expected return if the suspected bubble turned out to be real.
At GMO, we had no doubts in our minds that the 2000 bubble was indeed a bubble. We moved our asset allocation portfolios aggressively away from U.S. large caps and toward the cheaper assets accordingly, within the bounds our clients allowed. (See Appendix for our portfolio holdings at each bubble’s peak.) Our Global Asset Allocation Strategy 10 was therefore able to outperform the 65% Global Equities/35% U.S. Aggregate Bond 11 benchmark by over 10% per year from 2000 to 2003, making money in real terms during the S&P 500’s bear market, while the 65/35 benchmark fell by over 27% after inflation. By the time the traditional 65/35 portfolio regained its 2000 peak in real terms at the end of 2005, our strategy was up more than 50%, an annualized net return of 7.3% real.
The Everything Bubble of 2007-8
But markets were not entirely back to normal in 2005. In fact, a global housing bubble was already nearing its peak, and the loose monetary policy that enabled speculation in real estate had encouraged investors to bid up risk assets of all kinds. By 2007, this had turned into what Jeremy Grantham dubbed the “Everything Bubble,” where risk assets of all kinds had become overpriced simultaneously. 12 This provided a very different challenge for investors, as shown in Exhibit 2, a risk/reward scatterplot of our asset class forecasts as of June 2007.
Exhibit 2: Risk/Reward Trade-off in June 2007
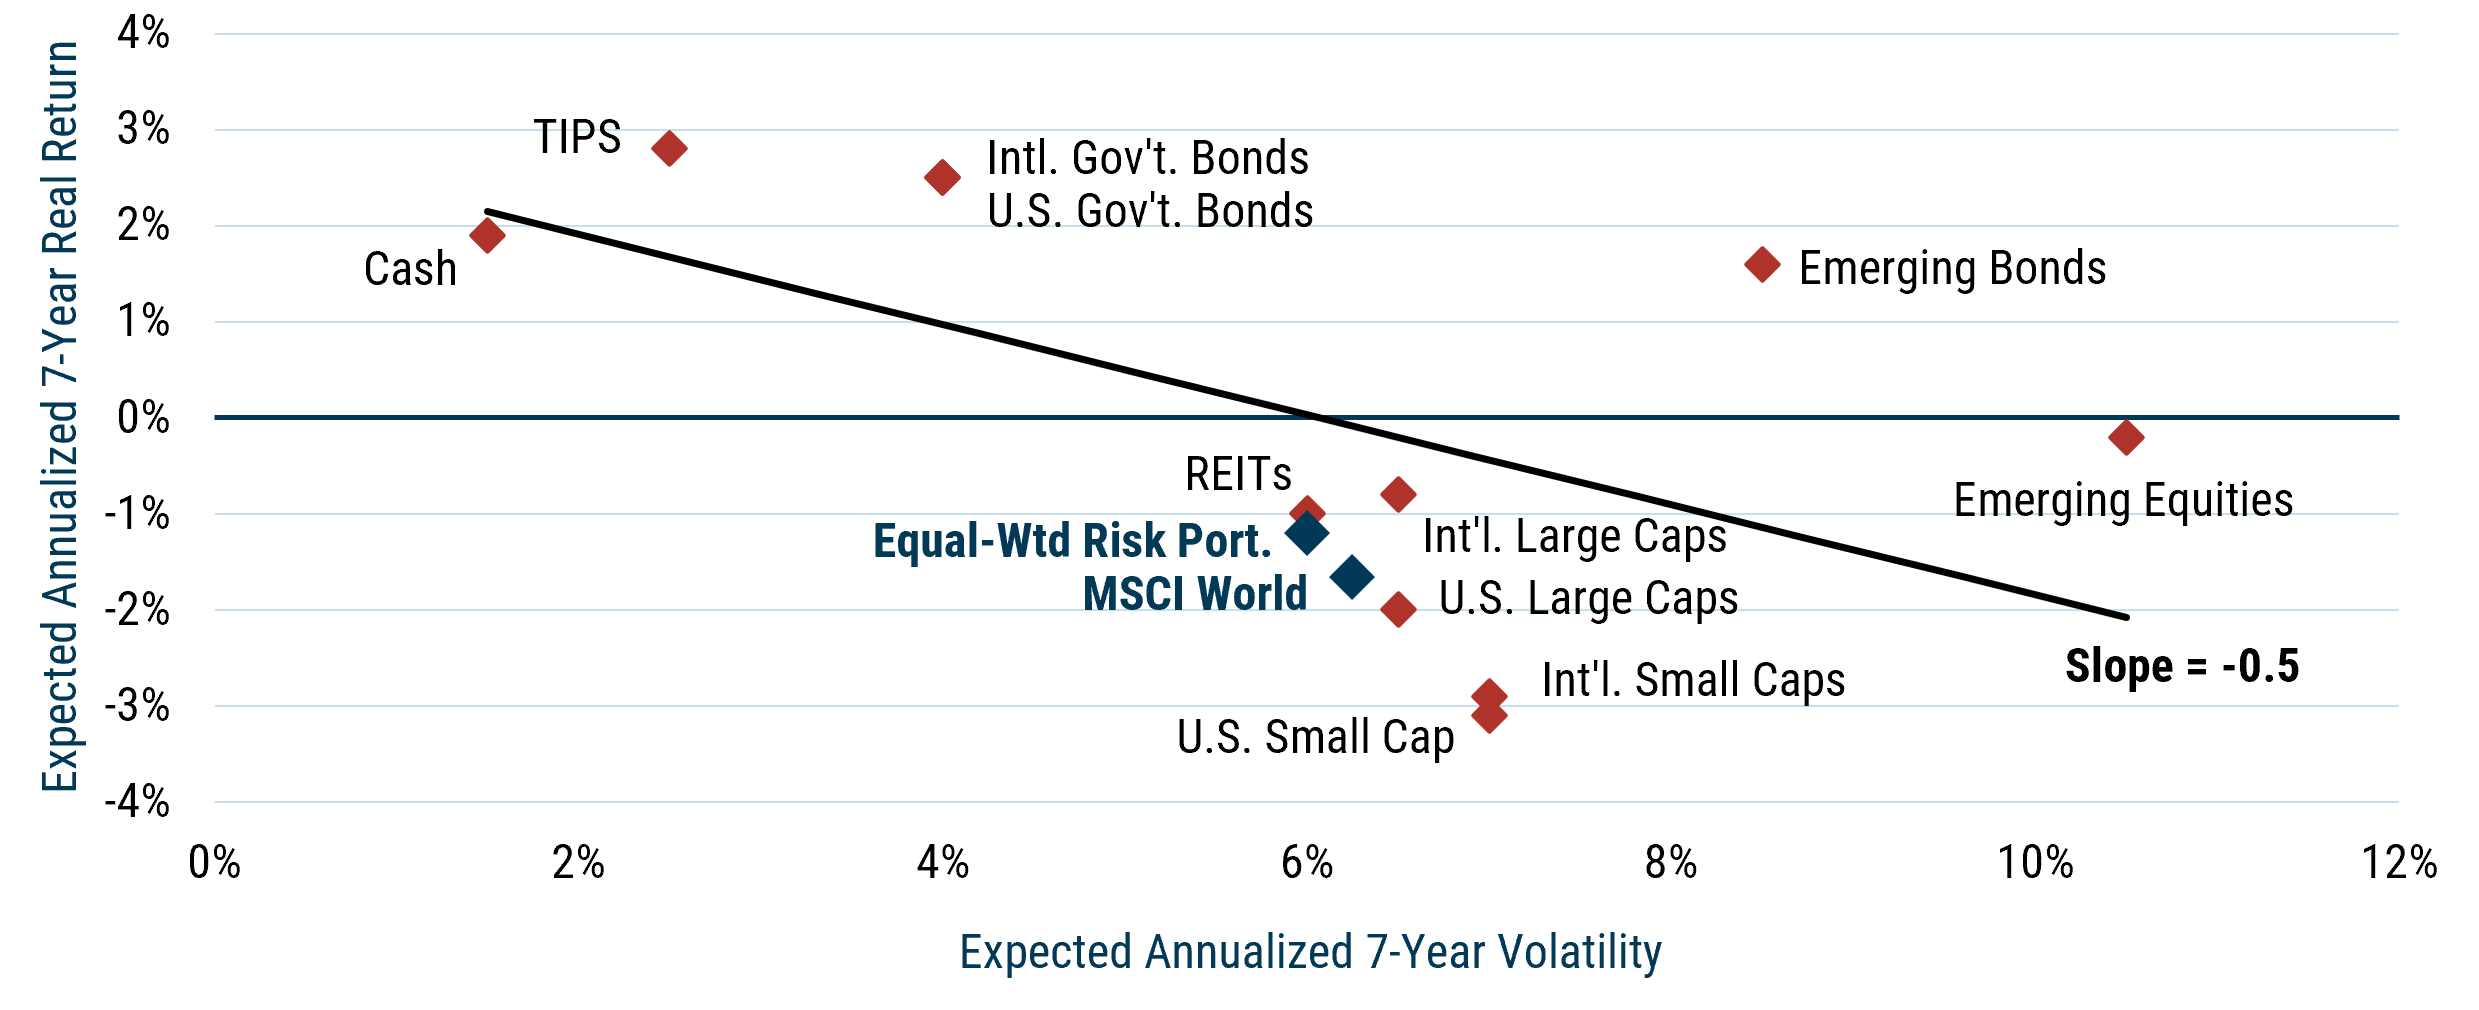
As of 6/30/2007 | Source: GMO
While U.S. large cap stocks were again substantially overvalued by this point, they weren’t the worst offenders, with small cap stocks around the world substantially more overvalued. But at a high level, there were two extremely striking differences between this bubble and the 2000 Internet Bubble. First, the slope of the risk/reward line, which had been a constructive +0.4 in 2000, had by this point become a shockingly negative -0.5. For the first time ever, investors appeared to be paying for the privilege of taking risk. Understanding this did not require deciphering how overleveraged the financial system had become, nor the ability to divine the timing of the forthcoming Global Financial Crisis (GFC). Our forecasts simply assumed that asset classes would take seven years to revert to fair value. And even if reversion had taken that long to occur, every single risky asset 13 had a lower expected return than every single low-risk asset. 14 Unlike in 2000, this time it didn’t much matter whether you owned a cap-weighted or equal-weighted version of the risk assets, as the expected return of the equal-weighted portfolio of risk assets was almost as bad as the MSCI World.
This situation put the agnostic investor in a very difficult position. The rational portfolio to own if you believed what valuations were telling you was drastically different from the portfolio you would own if everything was priced fairly. Diversifying within risky assets couldn’t help in any meaningful way. You had to de-risk the portfolio, and de-risking is an extremely risky thing for an agnostic investor to do. If valuation is giving you the wrong signal and assets are fairly priced, de-risking puts you in a much lower expected return portfolio—one that could not possibly deliver the level of real returns investors count on in the long term. Since most end clients and investment committees were, at best, in the agnostic camp, this left their advisors and CIOs—even if they believed wholeheartedly in the existence of a bubble—in a very tough spot. While they didn’t need to believe the bust was imminent for de-risking to be the right call, they didn’t have much time to be proven right before getting fired, or at least before being forced to buy back into risk assets. Investors can get antsy quickly when they suspect they’re missing out on rising markets.
We chose to follow the valuations and aggressively de-risked our portfolios. In the GMO Benchmark-Free Allocation Strategy (where we had the most flexibility), we reduced our equity exposure to 25% by the summer of 2008. We invested all 25% in GMO’s Quality Strategy, driven by our belief that high-quality companies would be the most likely survivors should a downturn turn into a depression. The actual GFC downturn was even sharper than that of the 2000 event, with a 60% MSCI ACWI/40% Bloomberg U.S. Aggregate bond portfolio falling 37% in real terms from the fall of 2007 to the winter of 2009. In Benchmark-Free, we cut that drawdown to 20% and reached a new high in real terms by the end of 2009, whereas the 60/40 portfolio took until 2013 to surpass its 2007 peak in real terms.
The 2021 Duration Bubble 15
The next bubble to form was arguably even trickier for our agnostic investor to handle. By the end of 2021, the inflation that had been largely quiescent since 2008 had come back with a vengeance, rising 6.8% in the year to November. And yet markets didn’t seem to care. T-Bills still yielded zero, while the 10-year note offered a meager 1.5%. This was not because investors assumed that consumer prices would quickly fall back to normal levels. At the time, 10-year TIPS yielded -1.04%, promising significant losses in real terms for anyone who lent money to the U.S. government for a decade. The problem was not limited to government bonds. The S&P 500 hit its highest ever cyclically adjusted P/E outside of a few months around the peak of the 2000 Internet Bubble, and almost all other assets around the world had joined in the fun, as shown in Exhibit 3.
Exhibit 3: Risk/Reward Trade-off December 2021
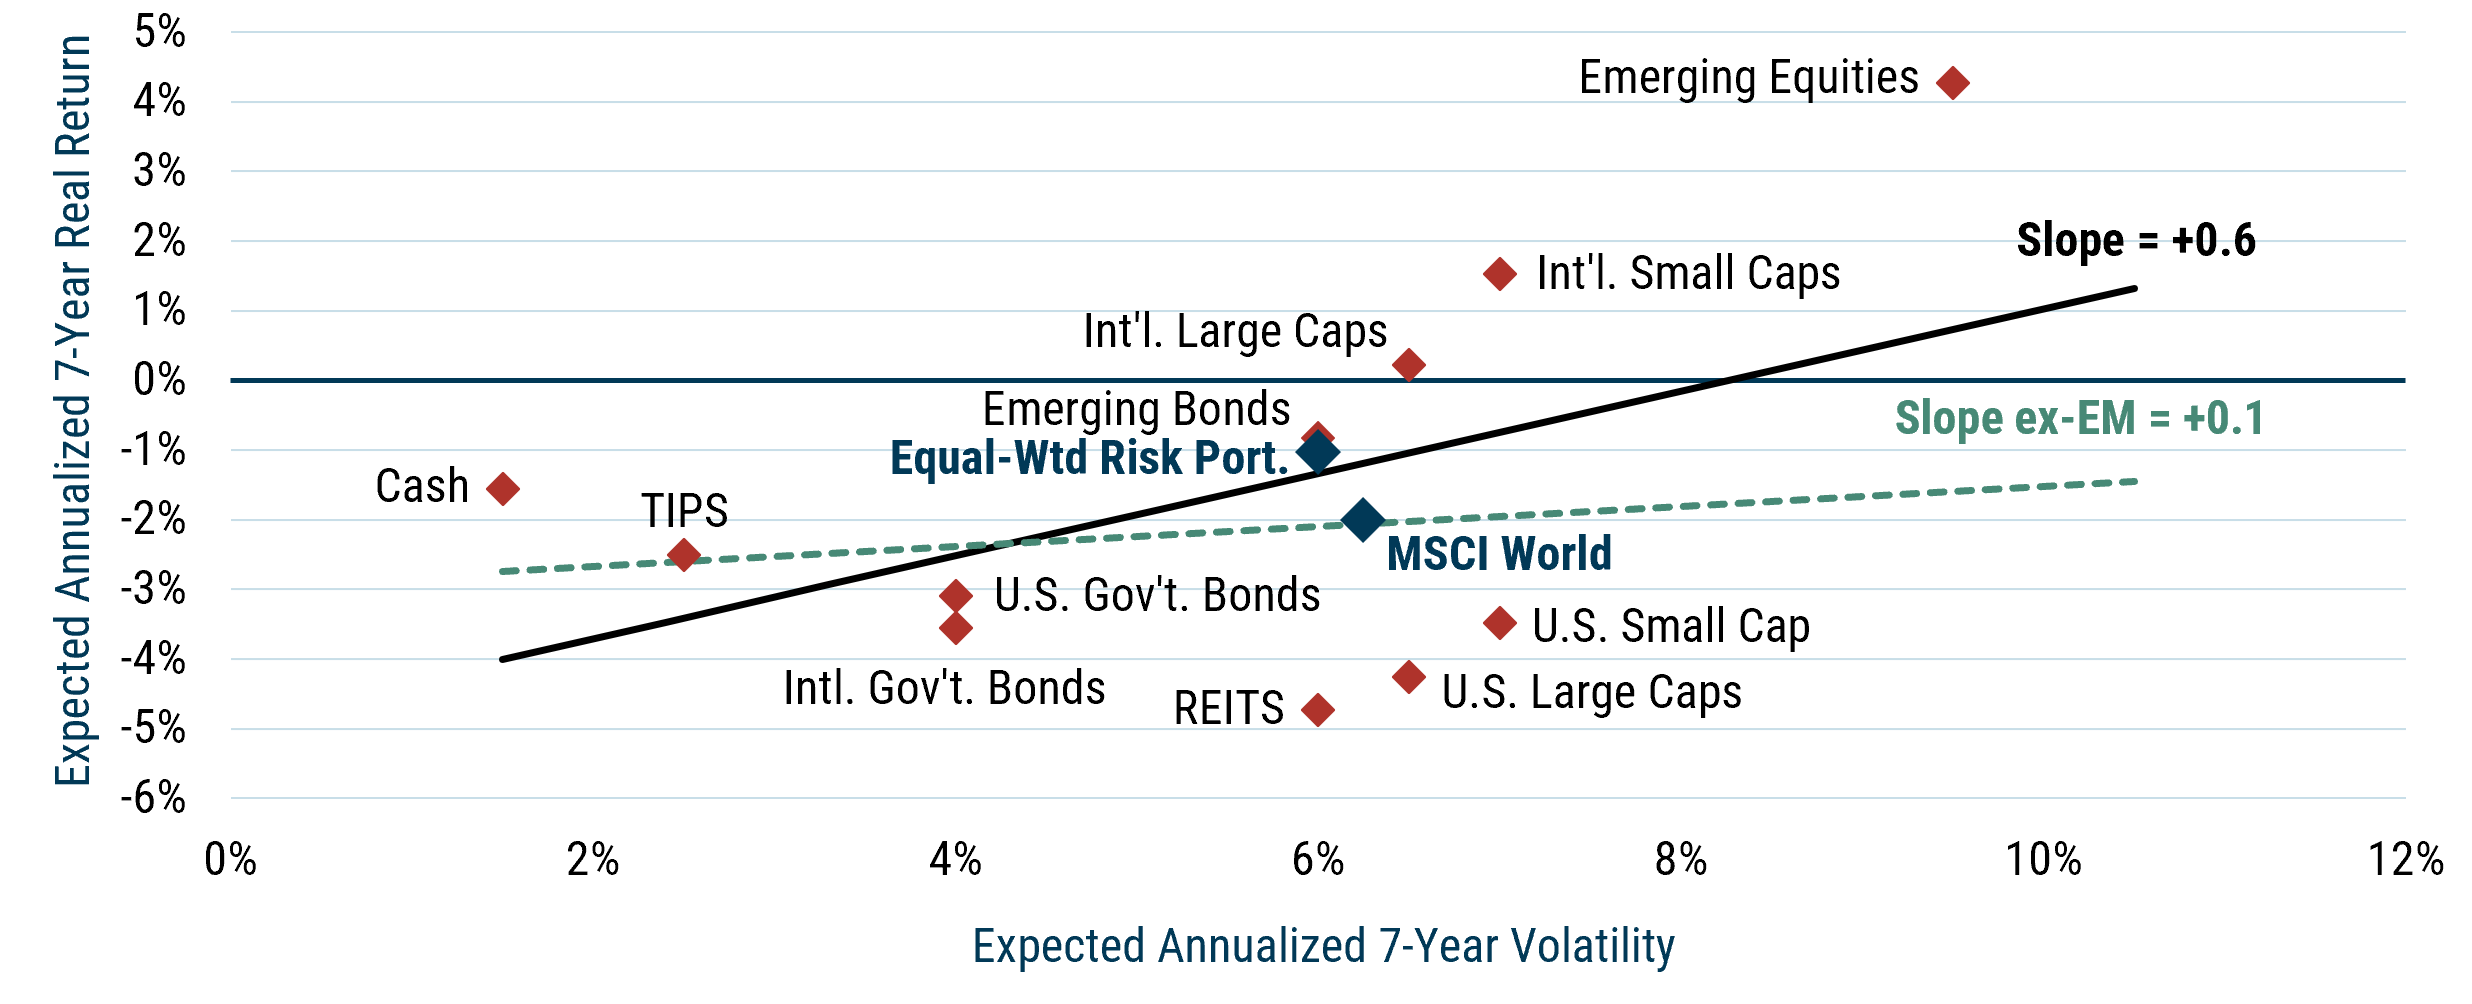
As of 12/31/2021 | Source: GMO
In this bubble, the trouble was not particularly that investors weren’t getting paid to take risk. The slope of the risk/reward regression line was normal at +0.6, although that was largely due to emerging equities, which were not particularly overpriced at the time. Excluding emerging equities from the regression results in a slope of +0.1, which is certainly uninspiring, but still not the disaster of the 2007-8 Everything Bubble. The trouble this time was the fact that almost all expected returns were negative in real terms. 16 Again, diversification within risk assets didn’t help much, as an equal-weighted portfolio of risk assets had a very similar expected return as MSCI World. De-risking, as an investor might have done in 2007, by moving from stocks to government bonds, also didn’t help since government bonds were no less overvalued than stocks. This bubble spanned across all kinds of long-duration assets. Equities and real estate, which have even more duration than a typical bond, were caught up alongside fixed income. 17
This posed an almost impossible problem for our agnostic investor–one that neither de-risking into bonds nor diversification across risk assets could fix. 18 Given these forecasts, cash had a better expected return than bonds or stocks, but cash yielded literally zero. If there was any meaningful possibility that, despite the valuations, assets were somehow still “normally” priced, the one asset that you had to own if you believed there was a bubble—cash—was an asset that guaranteed losses after inflation, whether there was a bubble or not! The appeal of moving to short-term investments if there was a chance that the bubble might burst sooner rather than later was obvious, as in that case, returns on bonds and stocks would be far more negative. And given how high inflation was at the time, there was a pretty clear catalyst for the bubble to burst in the relatively near term. Even with this clue, this event was almost certainly the toughest call of our agnostic investor’s career so far.
It was an easier call for us, although that’s partly because we had a way to cheat. By the end of 2021, we had moved 60% of our Benchmark-Free portfolio to liquid alternatives—strategies like equity long/short, merger arbitrage, and global macro. Though liquid alternatives strategies do take risk, they do so in a much shorter-duration way than traditional assets. Liquid alternatives seek to generate returns on top of cash, rather than on top of bond or stock benchmarks. This was incredibly helpful in 2021, given cash had not only a higher expected return than many other assets, but also much less risk in the event valuation reversion occurred sooner rather than later. Inflation did not quickly recede in 2022, so reversion was indeed quick. A 60% MSCI ACWI/40% Bloomberg U.S. Aggregate Bond portfolio lost 26% in real terms between December 2021 and September 2022. In Benchmark-Free, we were able to cut that basically in half, to a 14% real loss. 19 As a result, while that 60/40 portfolio didn’t regain its December 2021 level until the summer of this year, we were able to recapture the losses in 2023, and as of this writing, we are 14% ahead of the 60/40 portfolio since the 2021 Duration Bubble peak. 20
The AI Bubble
The fall of 2022 was notable, and not merely because it marked the low of the drawdown from the 2021 Duration Bubble. It also marked the release of ChatGPT-3.5, which sparked the beginning of the AI boom. There is little question that it was a true technological breakthrough, although AI already had some impressive accomplishments before that, notably mastering the computationally intractable game of Go in 2016 and solving protein folding in 2020. Like the internet in the late 1990s, AI since 2022 has captured the imagination of investors around the world, although in this case, the bulls are making even grander claims—promising superintelligent computers and humanoid robots poised to render human work unnecessary within a handful of years. 21
AI-related stocks have done exceptionally well since the release of that first chatbot, whether driven by massive earnings growth (Nvidia) or unrelenting hopes that they will somehow benefit in the end despite their rapidly diminishing cash flow (Tesla). These AI stocks have helped drive the S&P 500 above its 2021 valuation peak, which is now about 10% below the 2000 peak on cyclically adjusted earnings. Exhibit 4 shows the risk/reward scatterplot based on our September 2025 forecasts. 22
Exhibit 4: Risk/Reward Trade-off September 2025
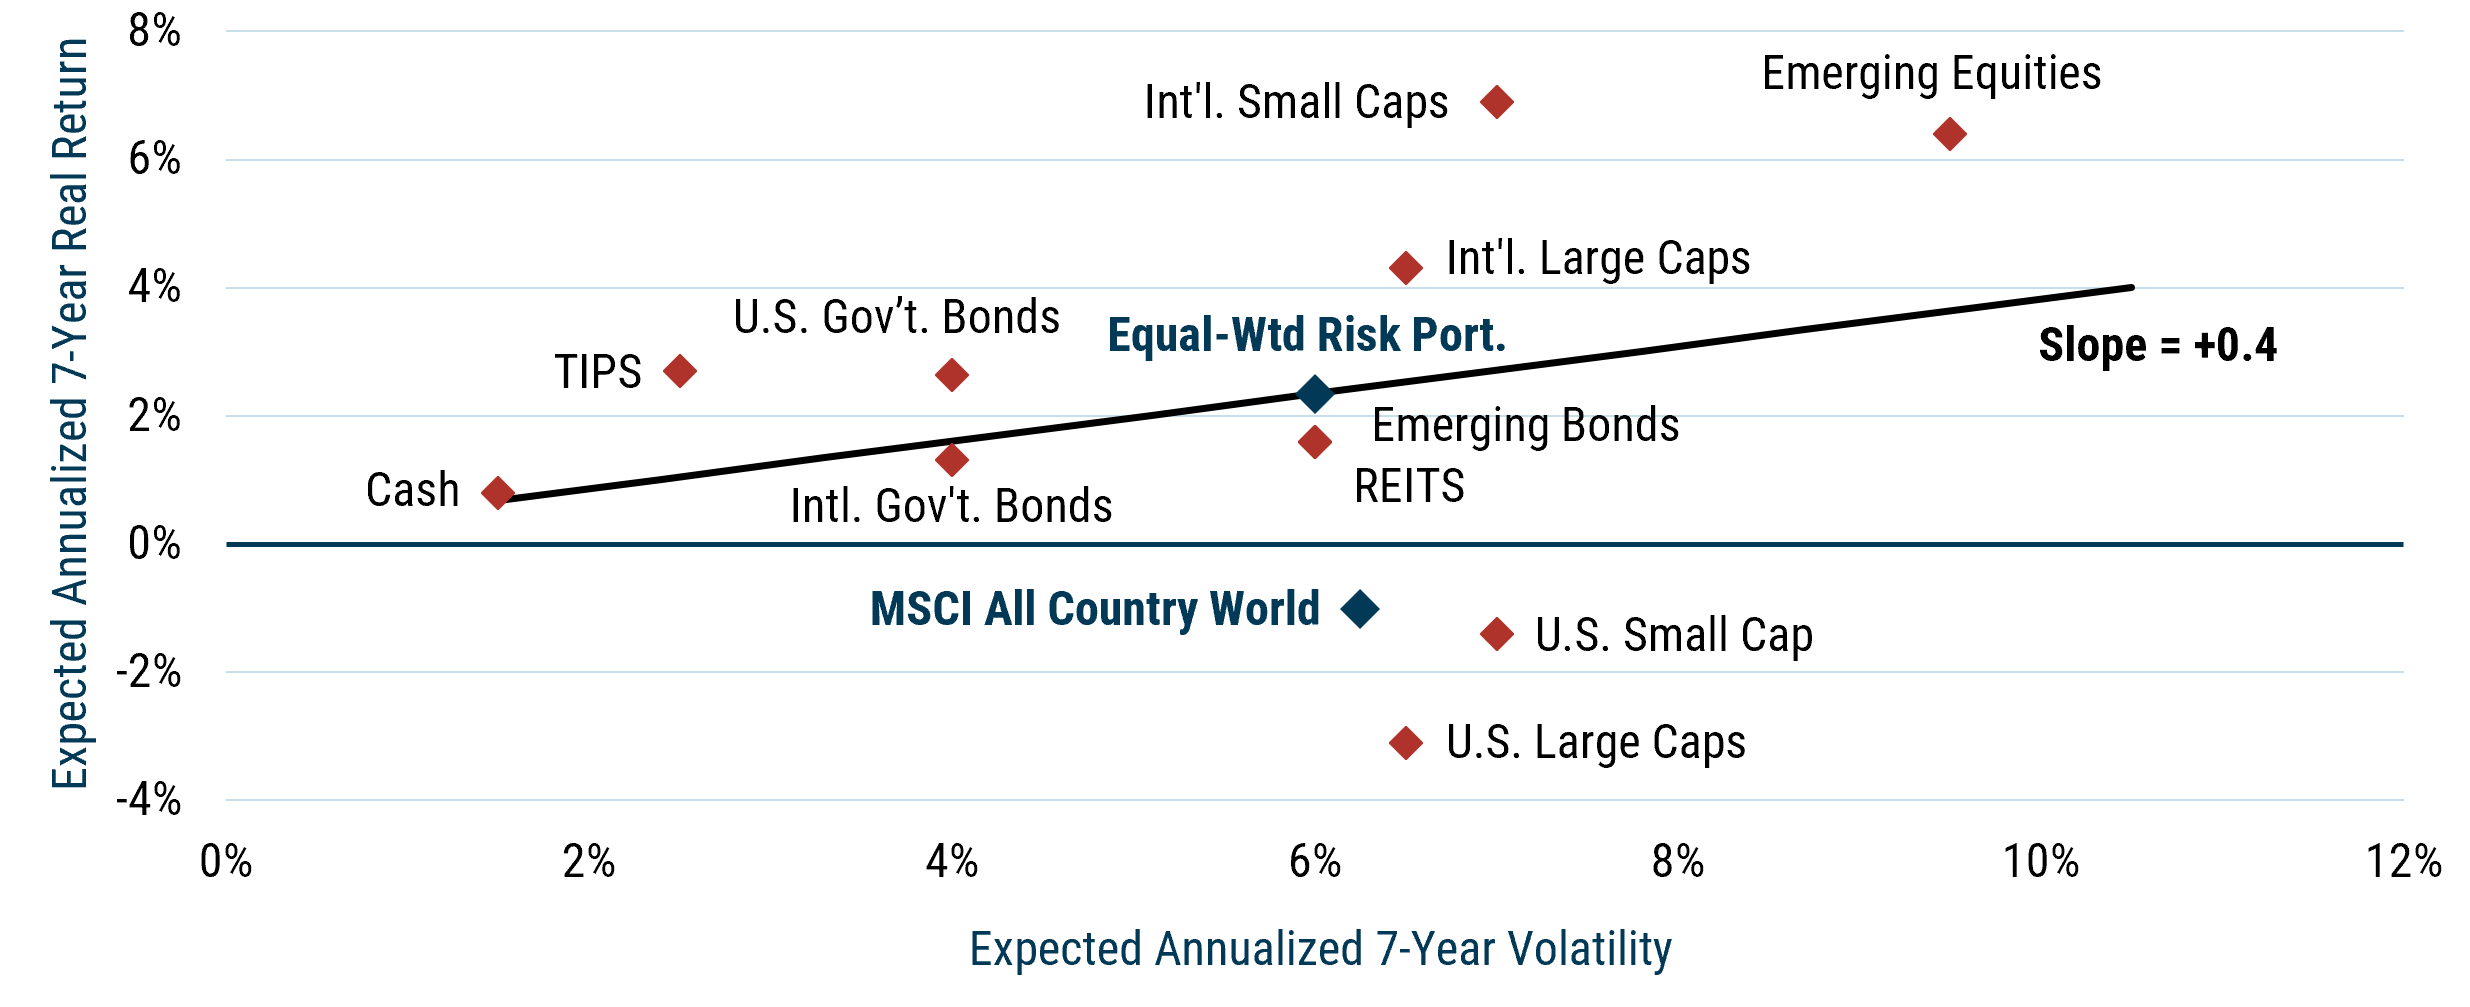
As of 9/30/2025 | Source: GMO
Notice this chart is strikingly similar to the 2000 version. The slope of the risk/reward regression line is again +0.4, U.S. large cap stocks are again the most overvalued asset around, and the equal-weighted portfolio of risk assets again offers a much higher expected return than MSCI World. Our agnostic investor can build a portfolio that deserves to win handily if the bubble is a bubble and should also do just fine if all is normal. I don’t mean to say that choosing to own a portfolio with little or no U.S. equities in it is easy to do given U.S. equities have beaten the rest of the world by as much as they have over the last 15 years, but keeping a normal amount of money in equities is a luxury the last two bubbles didn’t allow for. Today, building a diversified portfolio of risk assets that are priced to deliver equity-like-or-better returns is straightforward. While in this portfolio U.S. equities are most notable for their absence, there are still plenty of assets to choose from.
Conclusion
For the agnostic investor who is worried that AI might be a bubble but isn’t entirely convinced, the good news is that today, certainty is not required to move to a portfolio that is less dependent on the AI trade. Plenty of other risk assets are trading at fair or even compelling valuations, and even if today’s financial markets turn out to be rationally priced, there is no long-run expected return give-up for tilting your portfolio away from the AI darlings and into those other assets. Value stocks everywhere are very cheap, and in the U.S. and EAFE markets, deep value stocks are trading at some of the widest discounts on record. Non-U.S. small value stocks are also attractive, particularly in Japan, where they benefit from both a very undervalued yen and the opening of the market for corporate control. Liquid alternatives benefit from decent yields on cash and wide valuation spreads across various asset classes, and government bonds are priced to provide capital gains in a recession and a decent yield if the global economy holds together.
It’s always possible that if markets in general continue to move higher, our current 2000-like opportunity set might turn into a 2007- or even a 2021-like dilemma for investors. But to get there, we’d need to see good returns from a wide array of assets, not just continued levitation in AI. While agnostic investors would face more difficult choices if the rally continues, they could also take solace in the strong returns of the well-diversified portfolios that got them to that point. As bubbles go, AI looks like one of the easy ones for an agnostic investor to handle.
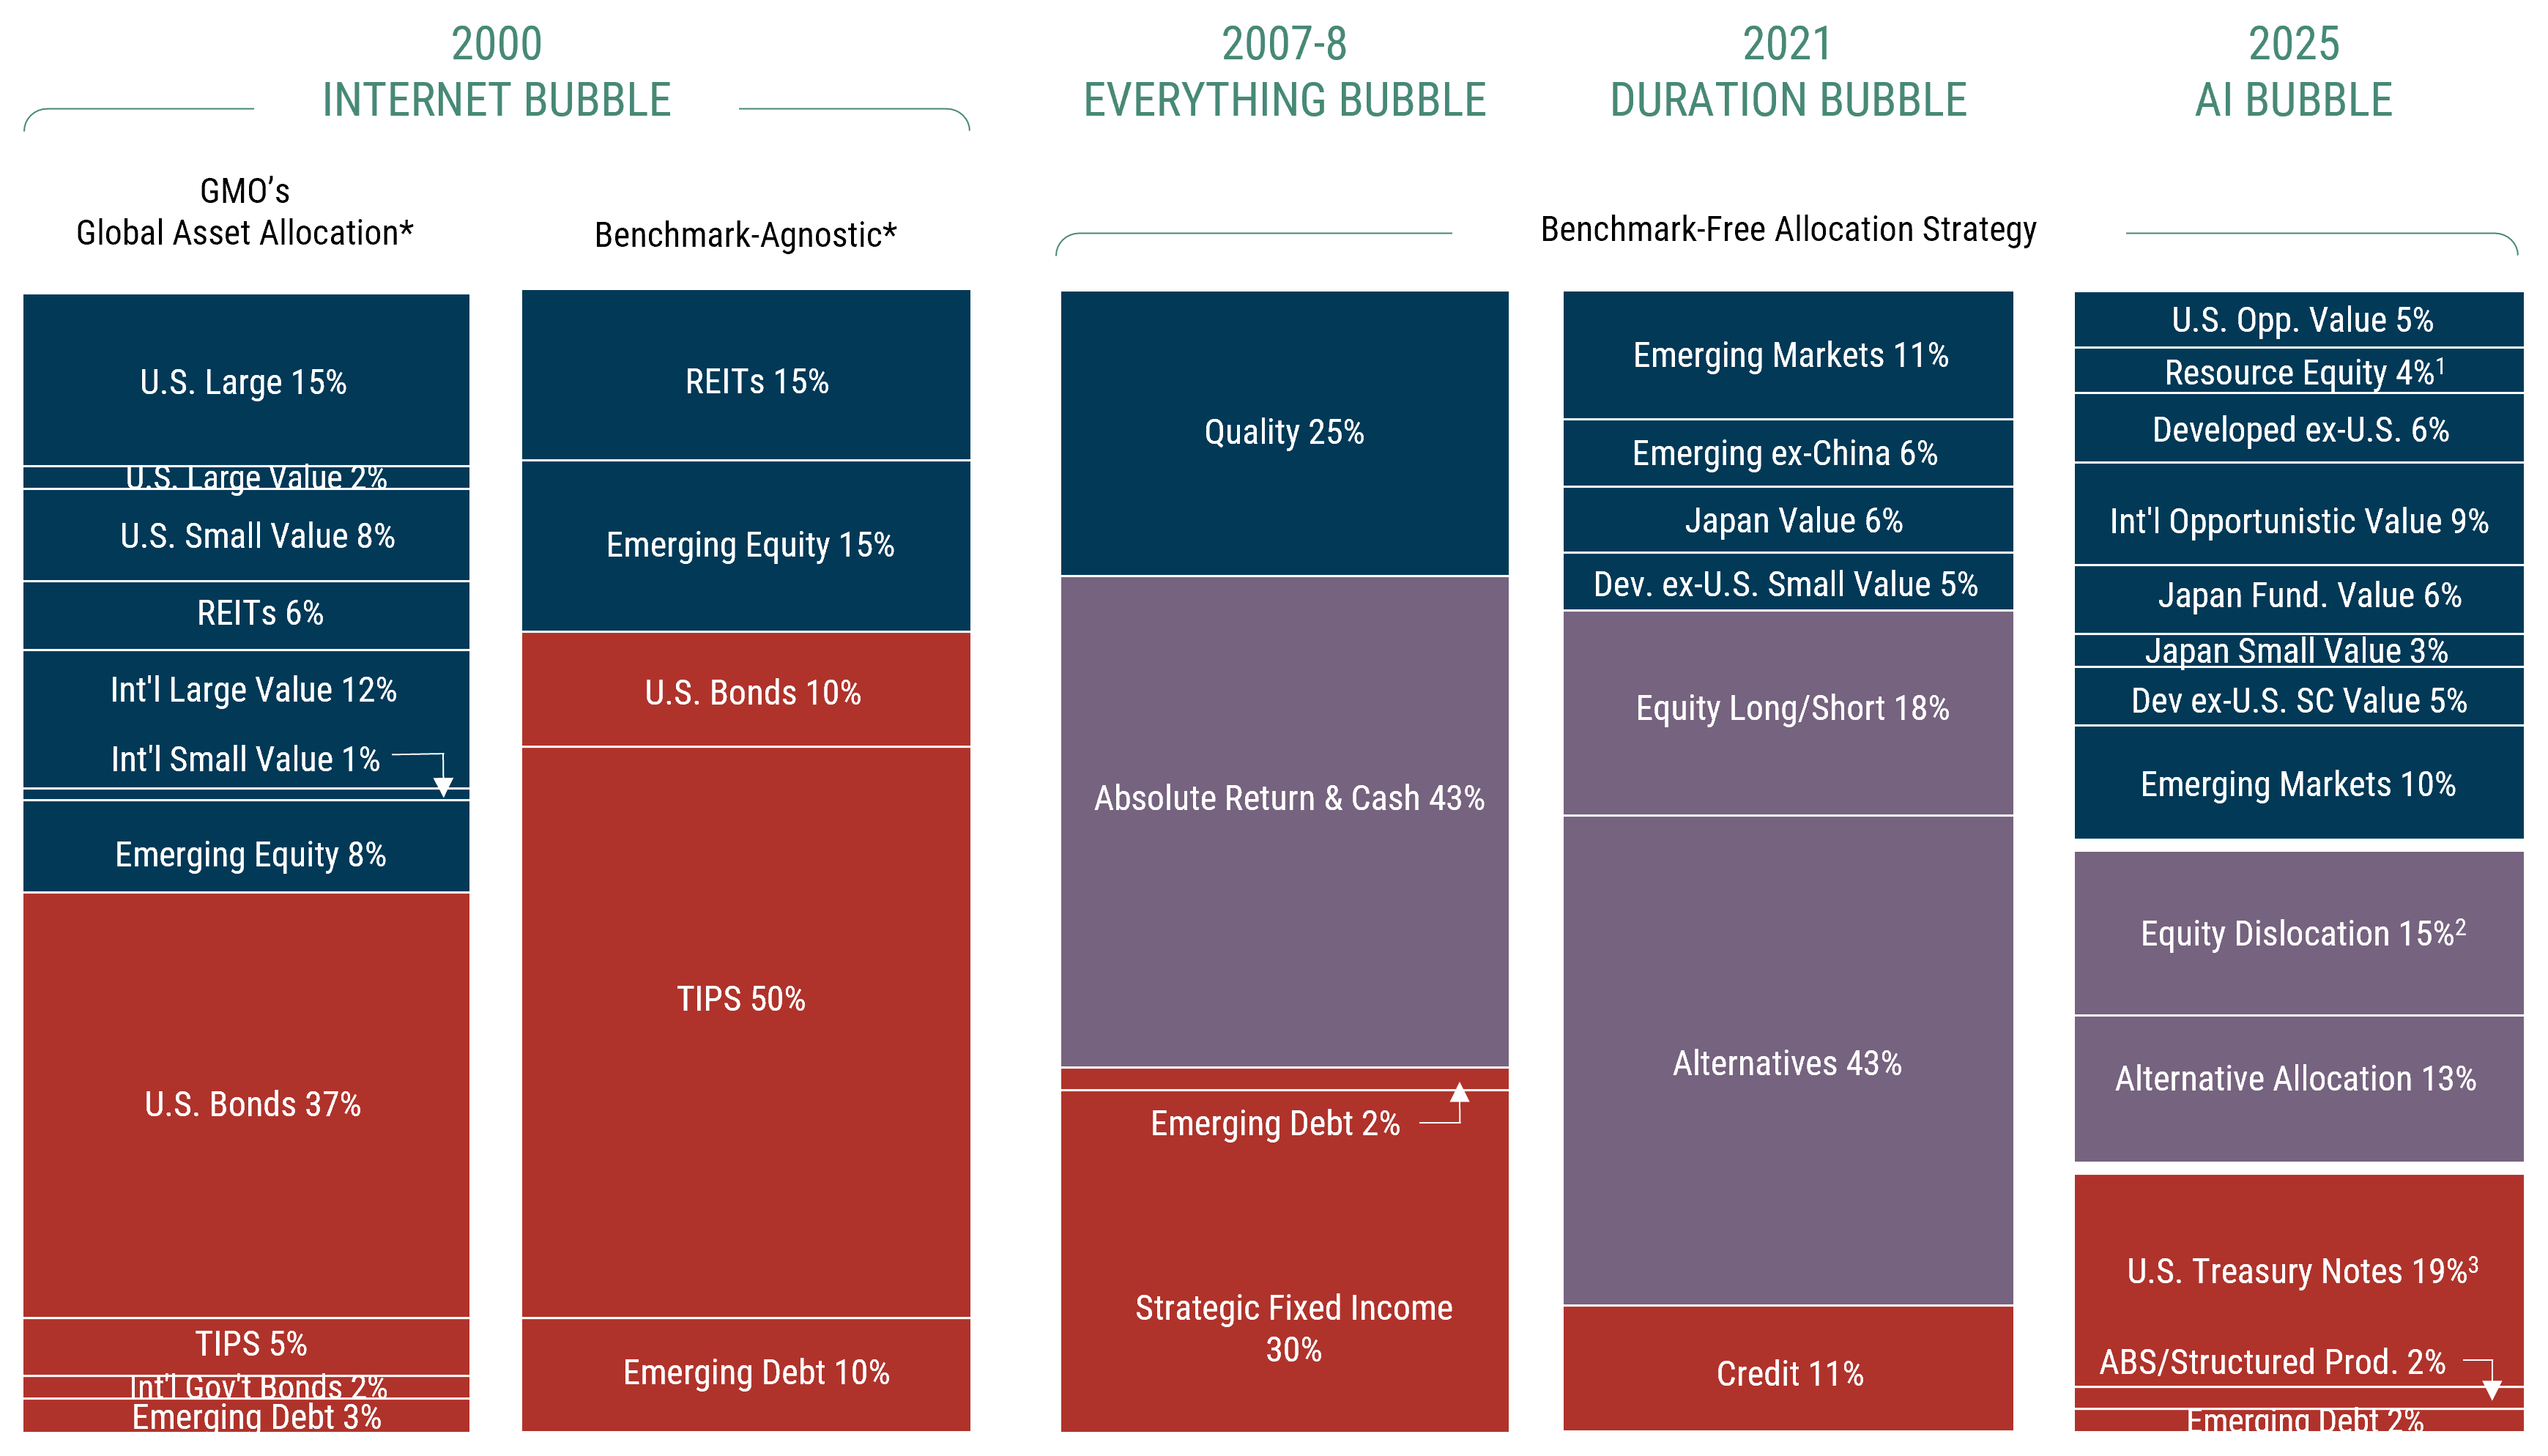
Appendix
GMO Asset Allocation Portfolios at Bubble Peaks
Exhibit 5 shows the positioning of GMO’s Asset Allocation portfolios during each bubble, as well as the current allocation for the GMO Benchmark-Free Allocation Strategy.
Exhibit 5: GMO Asset Allocation at Bubble Peaks
Source: GMO
*GMO’s Global Asset Allocation Strategy has a 65% MSCI ACWI/35% Bloomberg U.S. Aggregate benchmark. Benchmark-Free Allocation Strategy was incepted in the fall of 2001. Benchmark Agnostic portfolio represents the portfolio proposed to clients in the fall of 1999.
1Includes GMO’s Resources and Climate Change strategies.
2Total allocation to Equity Dislocation is 18.9% inclusive of exposure within Alternative Allocation.
3The headline exposure to U.S. Treasury Notes should not be considered in isolation of the portfolio’s overall duration profile inclusive of collateral and other exposures.
The above information is based on a representative account in the strategy selected because it has the fewest restrictions and best represents the implementation of the strategy. Weightings are as of the date indicated and are subject to change. The groups indicated above represent exposures determined pursuant to proprietary methodologies and are subject to change over time.
The 2000 Internet Bubble
In 2000, our primary multi-asset portfolio was a balanced strategy with defined allowable ranges around benchmark weights.
We were 32% underweight U.S. large cap stocks, 14% overweight a combination of U.S. small value and REITs, neutral on international developed stocks, 5% overweight emerging market equities, and 12% overweight fixed income. We were torn by the fact that we were taking crazy amounts of tracking error versus the benchmark while also wasting 15% of our portfolio on U.S. large cap stocks, which we believed offered the worst risk/reward trade-off in the world at the time. In the fall of 1999, that tension prompted us to talk to clients about investing in a benchmark-free manner in which we would never hold assets solely to control tracking error relative to a benchmark.
We weren’t hired to run a live benchmark-free portfolio until the fall of 2001, but we’ve labeled the portfolio we believed to be appropriate at the time for investors who cared more about earning real returns than tracking error “Benchmark Agnostic.” Our Benchmark-Agnostic portfolio had 40% of its allocation in risky assets, split between REITs, emerging equity, and emerging debt. The other 60% was in TIPS (50%) and U.S. investment-grade bonds (10%).
2007-8 Everything Bubble
By the time the next bubble came about, we had transitioned a number of our asset allocation clients to benchmark-free portfolios. We had moved to a very defensive portfolio by mid-2007 and continued taking risk off the table through the summer of 2008, culminating in the August 2008 portfolio we’ve labeled “2007-8 Everything Bubble,” shown in Exhibit 5.
2008 marked our lowest ever allocation to stocks (all of which were invested in the GMO Quality Strategy) and our highest allocation to cash and liquid alternatives. We also had a healthy allocation to bonds.
2021 Duration Bubble
By the end of 2021, we came close to matching our 2008 low point in equity allocation and exceeded our 2008 allocation to alternative strategies.
Between equity long/short and other alternatives, non-traditional short-duration strategies made up 60% of the portfolio. Furthermore, about half of the credit allocation was to floating rate securities, which also had effectively no interest rate duration. We’ve labeled that portfolio “2021 Duration Bubble.”
2025 AI Bubble
Today, we believe GMO’s Benchmark-Free Strategy has a strong expected return despite the AI Bubble, largely by virtue of owning stocks that have little or nothing to do with that theme.
Current allocations are about 50% stocks, 28% liquid alternatives, and 20% Treasuries. Given our current forecasts, our Benchmark-Free portfolio has an expected return of 6.5% real 23 (if our forecasts are spot on) versus 0.2% real for a 60% MSCI ACWI/40% Bloomberg U.S. Aggregate Bond portfolio. If everything turns out normal despite appearances, the portfolio has an expected return of 4.5% real, in line with the 60/40 benchmark if it, too, proves normal.
Despite having a little less than half of its weight in equities, this portfolio has risen 17.9% in 2025, 24 more than 4.5% ahead of a 60% MSCI World/40% Bloomberg U.S. Aggregate Bond portfolio and 4.1% ahead of the S&P 500. Despite the fact that AI feels like the only investment story anyone cares about, non-U.S. stocks, particularly deep value stocks, have significantly outpaced the S&P 500 this year. So far, it has not been necessary to lean into the AI trade to achieve strong returns. Even if the AI Bubble continues to inflate for a while longer, it is perfectly plausible that this trend continues. A rising tide need not only lift the most expensive boats.
On Robert Shiller’s Total Return CAPE, the S&P 500 is trading above its 1929 and 2021 peaks and is about 13% lower than the 2000 peak. On standard CAPE, it is closer still to the 2000 peak. On price/sales and price/book, it is at an all-time high.
Thinking Machines raised $2 billion earlier this year at a $10 billion valuation, apparently without telling investors what their plan was. Admittedly, they seem to have come up with one since then, and investors must think it’s a good one, given they’re raising capital at a $50 billion valuation about three months later. Must be one hell of a plan.
AMD rose 24% the day it announced their arrangement with OpenAI, and Oracle leapt 36% upon the announcement of theirs.
While Palantir trades at 120 times sales, almost certainly higher than any other megacap company in history, Rigetti Computing and D-Wave Quantum trade at 1007 and 318 times sales, respectively. As those two companies are directly competing with Microsoft, Alphabet, IBM, and other extremely deep-pocketed companies in the nascent quantum computing space, it shows almost touching faith by investors to assume they will somehow wind up the winners if quantum computing ever amounts to anything.
The degree of “this time is different” is truly next-level this time around. The inimitable Matt Levine pointed out in his October 15 column "OpenAI Has a Business Plan" that Sam Altman effectively said in an interview that their business plan was, “We will create God and then ask it for money.” Mark Zuckerberg also recently said on the ACCESS podcast that they’d rather risk misspending a couple hundred billion dollars than risk missing out on being first to superintelligence.
For an excellent book on bubbles, we recommend “Devil Take the Hindmost” by our former colleague, Edward Chancellor. His new book, co-written with Jeremy Grantham and coming out this January, “The Making of a Permabear,” is well worth a read too!
The “Nifty 50” era of the early 1970s was certainly a bubble in large cap growth stocks relative to small cap value stocks, but the overall U.S. stock market was substantially cheaper at the peak of the Nifty 50 in 1972 than it had been in the mid-1960s, and the valuation peak of the 1960s was substantially lower than what had been reached in 1929.
While the basic idea behind our asset class forecasts has been consistent since we started publishing them in 1994, some details have changed with time. It’s worth noting that in 2000, we assumed assets would take 10 years to revert to fair value. Starting in 2003, we changed this assumption to 7 years. Beginning in the mid-2010s, we also began contemplating multiple scenarios of equilibrium interest rates.
You could have done even better by biasing your portfolio toward the value half of those groups, given value stocks were trading at their widest-ever discounts to the market.
While we had started talking to clients about investing in a benchmark-free manner in the fall of 1999, we didn’t get our first client in the strategy until the fall of 2001. The paper portfolio of our recommendations would have done even better than the Global Asset Allocation Strategy we were running at the time.
The specific benchmark was 48.75% S&P 500/16.25% MSCI ACWI ex-U.S./35% Bloomberg U.S. Aggregate Bond. Almost all our clients at the time had a significant home bias to their equity portfolios.
It’s Everywhere, in Everything: The First Truly Global Bubble (Grantham 2007).
Equities, REITs, and emerging debt.
Cash, TIPS, and U.S. and international government bonds.
In the spirit of full disclosure, although we had written several pieces warning investors about both a stock bubble and the problem of excessively low bond yields at the time, we had yet to label it a “duration” bubble in print. See Government Bonds Have Given Us So Much, Do They Have Anything Left to Give? (Inker 2020), Speculation and Investment: Why Today's Highfliers Are so Likely to Fall Back to Earth (Inker 2021); and Let the Wild Rumpus Begin: (Approaching the End of) The First U.S. Bubble Extravaganza (Grantham 2022).
By this point, we were explicitly considering multiple scenarios for incorporating equilibrium interest rates into our forecasts, and this chart is the weighted average of those scenarios. If we had only been making the valuation assumptions we made in 2000 or 2007, the forecasts would have been even more negative, and the slope of the regression line would have been negative.
While investors are more used to thinking about the duration of fixed income instruments than assets with variable cash flows, it’s easy to explain why equities and real estate are longer duration than traditional bonds. While a bond has a maturity date, equities and real estate are perpetuities. Beyond that fact, their cash flows grow with inflation, which means expected cash flows, even in the fairly distant future, have a meaningful contribution to their present value. And just as with bonds, the lower the yield on those assets, the higher the duration gets.
2021 was also an utter nightmare for risk parity portfolios. While risk parity portfolios offer ostensible diversification across a variety of risks, the one risk they inherently lean heavily into is duration risk—exactly the wrong call in a duration bubble.
While 14% is more than half of 26%, a 14% loss requires a ~16% gain to regain the loss, whereas a 26% loss requires a ~35% gain–more than twice as much.
As of November 18, 2025, a 60% MSCI ACWI/40% Bloomberg U.S. Aggregate bond portfolio has returned +6.8% since the end of 2021 vs. our Benchmark-Free Allocation Strategy’s return of +20.8%, net of fees, for the same period.
The fact that AI truly does appear to be a technological breakthrough certainly does not mean it can’t be a bubble. The internet was a breakthrough. Railroads and, before them, canals were breakthroughs. Investors seem to be particularly prone to overestimating the returns on investing in technological breakthroughs, not least because they tend to throw so much money at them that competition decimates the return on capital on that investment.
These expected returns are for U.S. dollar-based investors and are a weighted average of the different equilibrium interest rate scenarios we contemplate.
Assuming our strategies perform in line with their benchmarks. Security selection alpha would add to that return, except in the case of liquid alternatives, where we assume Equity Dislocation will return 6% above cash due to the wide spread between value and growth stocks globally, and Alternative Allocation, where we are assuming 4% above cash given a generally good opportunity set.
As of November 12, 2025.
Disclaimer: The views expressed are the views of Ben Inker through the period ending November 2025 and are subject to change at any time based on market and other conditions. This is not an offer or solicitation for the purchase or sale of any security and should not be construed as such. References to specific securities and issuers are for illustrative purposes only and are not intended to be and should not be interpreted as recommendations to purchase or sell such securities.
Copyright © 2025 by GMO LLC. All rights reserved.
On Robert Shiller’s Total Return CAPE, the S&P 500 is trading above its 1929 and 2021 peaks and is about 13% lower than the 2000 peak. On standard CAPE, it is closer still to the 2000 peak. On price/sales and price/book, it is at an all-time high.
Thinking Machines raised $2 billion earlier this year at a $10 billion valuation, apparently without telling investors what their plan was. Admittedly, they seem to have come up with one since then, and investors must think it’s a good one, given they’re raising capital at a $50 billion valuation about three months later. Must be one hell of a plan.
AMD rose 24% the day it announced their arrangement with OpenAI, and Oracle leapt 36% upon the announcement of theirs.
While Palantir trades at 120 times sales, almost certainly higher than any other megacap company in history, Rigetti Computing and D-Wave Quantum trade at 1007 and 318 times sales, respectively. As those two companies are directly competing with Microsoft, Alphabet, IBM, and other extremely deep-pocketed companies in the nascent quantum computing space, it shows almost touching faith by investors to assume they will somehow wind up the winners if quantum computing ever amounts to anything.
The degree of “this time is different” is truly next-level this time around. The inimitable Matt Levine pointed out in his October 15 column "OpenAI Has a Business Plan" that Sam Altman effectively said in an interview that their business plan was, “We will create God and then ask it for money.” Mark Zuckerberg also recently said on the ACCESS podcast that they’d rather risk misspending a couple hundred billion dollars than risk missing out on being first to superintelligence.
For an excellent book on bubbles, we recommend “Devil Take the Hindmost” by our former colleague, Edward Chancellor. His new book, co-written with Jeremy Grantham and coming out this January, “The Making of a Permabear,” is well worth a read too!
The “Nifty 50” era of the early 1970s was certainly a bubble in large cap growth stocks relative to small cap value stocks, but the overall U.S. stock market was substantially cheaper at the peak of the Nifty 50 in 1972 than it had been in the mid-1960s, and the valuation peak of the 1960s was substantially lower than what had been reached in 1929.
While the basic idea behind our asset class forecasts has been consistent since we started publishing them in 1994, some details have changed with time. It’s worth noting that in 2000, we assumed assets would take 10 years to revert to fair value. Starting in 2003, we changed this assumption to 7 years. Beginning in the mid-2010s, we also began contemplating multiple scenarios of equilibrium interest rates.
You could have done even better by biasing your portfolio toward the value half of those groups, given value stocks were trading at their widest-ever discounts to the market.
While we had started talking to clients about investing in a benchmark-free manner in the fall of 1999, we didn’t get our first client in the strategy until the fall of 2001. The paper portfolio of our recommendations would have done even better than the Global Asset Allocation Strategy we were running at the time.
The specific benchmark was 48.75% S&P 500/16.25% MSCI ACWI ex-U.S./35% Bloomberg U.S. Aggregate Bond. Almost all our clients at the time had a significant home bias to their equity portfolios.
It’s Everywhere, in Everything: The First Truly Global Bubble (Grantham 2007).
Equities, REITs, and emerging debt.
Cash, TIPS, and U.S. and international government bonds.
In the spirit of full disclosure, although we had written several pieces warning investors about both a stock bubble and the problem of excessively low bond yields at the time, we had yet to label it a “duration” bubble in print. See Government Bonds Have Given Us So Much, Do They Have Anything Left to Give? (Inker 2020), Speculation and Investment: Why Today's Highfliers Are so Likely to Fall Back to Earth (Inker 2021); and Let the Wild Rumpus Begin: (Approaching the End of) The First U.S. Bubble Extravaganza (Grantham 2022).
By this point, we were explicitly considering multiple scenarios for incorporating equilibrium interest rates into our forecasts, and this chart is the weighted average of those scenarios. If we had only been making the valuation assumptions we made in 2000 or 2007, the forecasts would have been even more negative, and the slope of the regression line would have been negative.
While investors are more used to thinking about the duration of fixed income instruments than assets with variable cash flows, it’s easy to explain why equities and real estate are longer duration than traditional bonds. While a bond has a maturity date, equities and real estate are perpetuities. Beyond that fact, their cash flows grow with inflation, which means expected cash flows, even in the fairly distant future, have a meaningful contribution to their present value. And just as with bonds, the lower the yield on those assets, the higher the duration gets.
2021 was also an utter nightmare for risk parity portfolios. While risk parity portfolios offer ostensible diversification across a variety of risks, the one risk they inherently lean heavily into is duration risk—exactly the wrong call in a duration bubble.
While 14% is more than half of 26%, a 14% loss requires a ~16% gain to regain the loss, whereas a 26% loss requires a ~35% gain–more than twice as much.
As of November 18, 2025, a 60% MSCI ACWI/40% Bloomberg U.S. Aggregate bond portfolio has returned +6.8% since the end of 2021 vs. our Benchmark-Free Allocation Strategy’s return of +20.8%, net of fees, for the same period.
The fact that AI truly does appear to be a technological breakthrough certainly does not mean it can’t be a bubble. The internet was a breakthrough. Railroads and, before them, canals were breakthroughs. Investors seem to be particularly prone to overestimating the returns on investing in technological breakthroughs, not least because they tend to throw so much money at them that competition decimates the return on capital on that investment.
These expected returns are for U.S. dollar-based investors and are a weighted average of the different equilibrium interest rate scenarios we contemplate.
Assuming our strategies perform in line with their benchmarks. Security selection alpha would add to that return, except in the case of liquid alternatives, where we assume Equity Dislocation will return 6% above cash due to the wide spread between value and growth stocks globally, and Alternative Allocation, where we are assuming 4% above cash given a generally good opportunity set.
As of November 12, 2025.