Shades of 2000
Executive Summary
The years leading up to the 2000 stock market bubble were extraordinary and unprecedented. They caused unique pain to the portfolios of valuation-driven investors. The valuation extremes, though, created the greatest opportunity set for valuation-driven investors since the Great Depression. While the events of the last decade have not been as striking as those of the late 1990s, the recent cycle has gone on for significantly longer and the pain caused to our portfolios has begun to approach 1990’s levels. As the current cycle has ground on slowly but surely, the valuation extremes have moved wider, creating an opportunity set for valuation-driven investors that looks as extraordinary as what we saw 20 years ago.
Most of us have times in our professional lives we prefer not to think too much about. In my case, the period from 1997 to early 2000 was that time. It seemed as if every single thing that could go wrong for us from an investment standpoint did. Sure, value stocks were drastically underperforming, but emerging equity and debt didn’t have to go through a crisis simultaneously. Long-Term Capital didn’t have to blow up taking with it a whole series of assets that had little or nothing in common with each other besides the fact that anyone with an eye to history would have judged them relatively cheap. In my own personal contribution to ensuring nothing would go right, I convinced our U.S. quantitative equity team to make a tiny change to our stock momentum model. It disqualified any stock from being purchased on momentum grounds if it was trading at over 25 times fair value on our intrinsic value model. It removed a grand total of one stock from our equity portfolios.1 Unfortunately, that stock was America Online; in the course of 1999, that omission lowered the return of our U.S. Core strategy by something over 1 percentage point.
The relative performance of our global equity and multi-asset strategies over the last half of the 1990s was, frankly, unimaginably bad. Exhibit 1 shows the performance of each strategy relative to its respective benchmark from 1994 to 1999.
Exhibit 1: GMO Global Equity Allocation and Multi-Asset Performance vs. Benchmarks (1994-99)
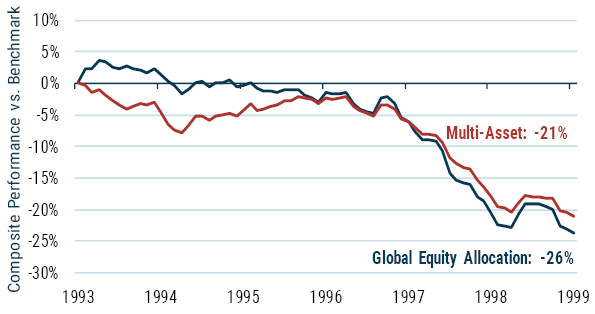
As of 12/31/99 | Source: GMO
All performance is net of fees.
For strategies with tracking error in the 3% to 4% range, these numbers were the kind of events that should have happened about every 900 years.2 Those of our clients that stayed with us were unsurprisingly rather annoyed and quite tired of listening to our argument that the prospective returns for our strategies were actually very good. We were often told, “You just don’t get it,” and asked, “How can you make up for the lost ground?”
Happily, for those clients that believed enough of what we were saying to stick around, on or about the turn of the millennium things changed. The next decade saw the strategies win by amounts that well rewarded their patience.
Exhibit 2: GMO Global Equity Allocation and Multi-Asset Performance vs. Benchmarks (1994-2009)
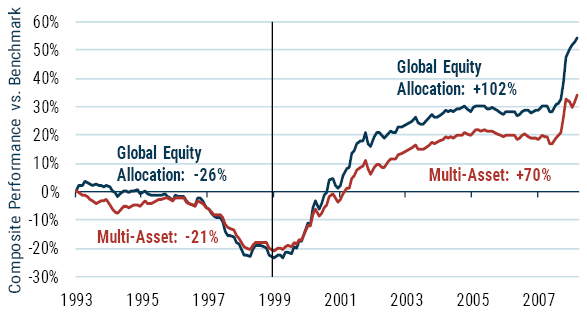
As of 2/28/09 | Source: GMO
All performance is net of fees.
Ever since 2000, we have always assumed that neither the pain from the 1990s, nor the opportunity set that the pain created, would come our way again. And on a day-to-day and month-to-month basis, nothing quite like it has occurred. But there is more than one way for things to get to extremes. The performance of some of our strategies is once again approaching the 1990s-style cumulative pain level, as we can see in Exhibit 3.
Exhibit 3: GMO Global Equity Allocation and Multi-Asset Performance vs. Benchmarks (1994-2019)
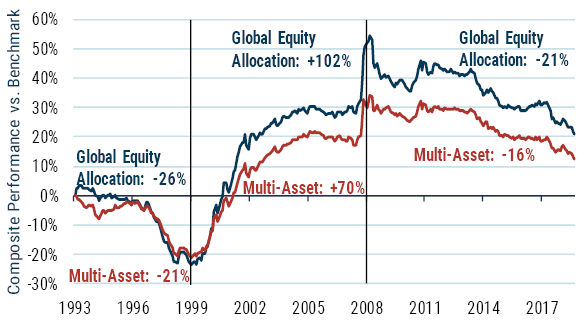
As of 8/31/19 | Source: GMO
All performance is net of fees.
While the magnitude of our underperformance has been 20% to 25% less than it was last time around, its duration has been particularly painful. This period has lasted over 10 years instead of the 5 years of the late 1990s. Unsurprisingly, our clients are once again finding their patience wearing thin.
Now, just because the pain has been notable doesn’t necessarily mean that the opportunity created is correspondingly impressive. To assess the current opportunity set, we have the advantage that we have been publishing our asset class forecasts since the mid-1990s. This history allows us to compare the opportunity set through time on the forecasts we have used to build our portfolios. Exhibit 4 shows this for the two strategies we’ve been looking at so far.
Exhibit 4: Forecast of Global Equity Allocation and Multi-Asset Portfolios vs. Benchmarks (1996-2009)
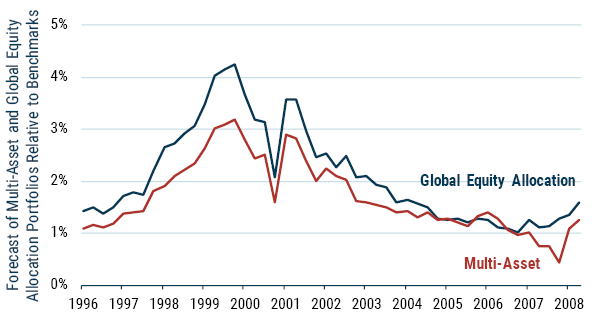
Source: GMO
Forecasts are the “Mean Reversion” forecasts published by GMO at the time.
In the run-up to 2000, the forecasts for both portfolios got better and better relative to their benchmarks, driven largely by the extraordinary discount of value stocks in the late 1990s. As the Internet bubble burst and valuation disparities normalized, our portfolios delivered extraordinary outperformance and the superiority of our portfolios based on our own forecasts slowly waned. In the 2000 case, the poor prior performance set the stage for better times for our portfolios, which was appropriately reflected in the forecasts we were seeing at the time.
What about this time around? Exhibit 5 updates the expected return charts through August 2019.
Exhibit 5: Forecast of Global Equity Allocation and Multi-Asset Portfolios vs. Benchmarks
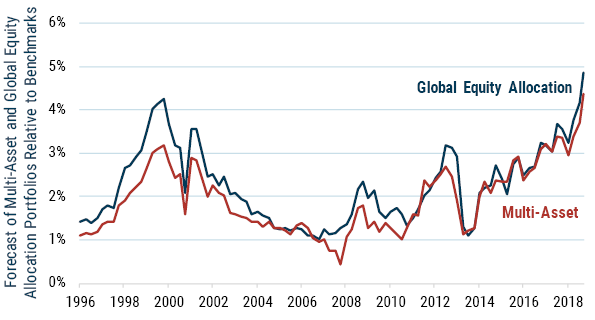
Source: GMO
Forecasts are the “Mean Reversion” forecasts published by GMO at the time.
For both the global equity portfolio and the multi-asset class portfolio, things appear to be even better than they were in 2000. On the face of it, our portfolios have never had a better opportunity set than they have today, at least relative to traditional portfolios. How can that be, when the value opportunity was better in 2000? Part of the reason is that other asset allocation opportunities beyond the value style are even better than they were then. Table 1 shows the percentile rank of the valuation spread for regional stock valuations and style valuations.
Table 1: Asset Allocation Opportunities within Equities
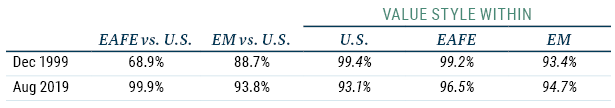
As of 8/31/19 | Source: GMO
Valuation spreads are calculated on an average of several capital proxies.
In both the U.S. and EAFE markets, 1999 was a more extreme value opportunity. Not only were both spreads into the 99th percentile, but the only datapoints more extreme were the months immediately surrounding December 1999. But EAFE and emerging are both significantly cheaper relative to the U.S. today than they were back then. And while value is not quite as well-positioned in the developed world, it is slightly better positioned in emerging than it was then.
Now come the caveats. The forecasts I have been using for these calculations are our “Mean Reversion” forecasts, which assume that all valuations are going to revert to long-term averages. In 2000, those forecasts assumed it would take 10 years for valuations to revert to normal, whereas now we use a 7-year reversion period. This means today’s forecasts generally have slightly larger amplitudes than the ones from back then. And beyond the calculation details, many investors made the case in 2000 that long-term averages were not meaningful anymore and the future would be far different from the past. From the standpoint of the world from 2000 to 2010, those investors proved to be wrong, as asset prices generally moved toward long-term averages. The case for believing that today’s world is different does seem stronger to us than it did then. While my guess is that future generations will look on a world with 30% of all investment grade developed market bonds trading at a negative yield3 as evidence that we had collectively lost our minds for a while, I’m significantly less confident in that assertion than we were in saying the S&P 500 was stupidly overvalued in 2000.4 Given that uncertainty, today we have another set of forecasts that we also use in building our portfolios – the “partial mean reversion”5 forecasts – that assume interest rates have permanently moved lower and have driven down other assets’ required returns as well. The forecasts in that scenario are marginally less friendly to our portfolios, but not materially so, as we can see in Exhibit 6, which also makes an adjustment for the 10-year reversion period of the 2000 forecasts relative to the 7-year reversion period we use today.
Exhibit 6: Forecast Portfolio Spread to Benchmark
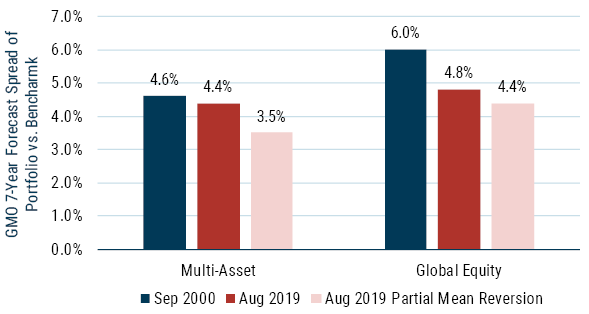
Source: GMO
Forecasts are the “Mean Reversion” forecasts published by GMO at the time. The “7-year Equivalent Forecast” for Sep 2000 is calculated by multiplying the forecast spread by 10/7. This is a slight oversimplification of what a true 7-year forecast would have said at the time but should be quite close.
Adjusting the 2000 forecasts for full comparability does make today’s opportunity set look slightly less extraordinary than the 2000 opportunity set and using the Partial Mean Reversion forecasts affect the multi-asset portfolios at the margin as well. However, the opportunity set today is far and away the best one we have seen in 20 years and it is very much in the ballpark of the 2000 event.
And for multi-asset portfolios, this is also not the end of the story. In 2000, we had not yet launched our Benchmark-Free Allocation Strategy, where we are free to put together a portfolio without worrying about our tracking error to a traditional portfolio.6 In that strategy we have the advantage of not needing to hold any U.S. equities in order to control our tracking error against a global equity benchmark. And in that portfolio, we can do even better than we can in our other multi-asset portfolios. The forecast differential for that portfolio today is 5.5% in the mean reversion scenario and 4.6% in partial mean reversion.7 A narrowing of these levels of forecast spreads would serve as strong tailwinds for our portfolios, enabling us to outperform benchmarks as we did in the early to mid-2000s.
There is, of course, no absolute guarantee that valuations will revert even part way to historical levels. This time may in fact be different. But even in a world in which today’s valuations persist indefinitely, we believe our portfolios still have a strong inbuilt advantage due to their substantially higher income and earnings. In that world, it would take a long time to make up for the relative losses we’ve suffered as valuations moved to extremes, but in that dreary, low-return world, an extra percent or so of returns every year would go a long way.
Today is not 2000, and today’s opportunities are not quite the same as the ones we had at our disposal 20 years ago. But in our estimation, they are similarly extraordinary and far better than anything we had seen before that event or have seen since.
Download article here.