Despite headlines and swoons, equity markets have rallied strongly YTD and over the last 12 months, with developed ex-U.S. Value stocks outpacing most other groups. GMO International Value ETF (GMOI) has outperformed the MSCI World ex-U.S. Value by 3.6% YTD and by 6.3% over the trailing 12 months (NAV, through 7/31). Over this period, GMOI has also significantly
outperformed MSCI World ex-U.S. and S&P 500 indexes.
GMOI is an actively managed value portfolio; the key differentiator in its approach is the willingness to strongly lean into the current best valuation opportunity. Furthermore, the strategy incorporates both quality and growth as key determinants of valuation. Due to extraordinarily wide valuation spreads, GMOI has dialed deeply into the very cheapest stocks, resulting in a portfolio that trades at a discount to MSCI World ex-U.S. and MSCI World ex-U.S. Value.
Holding the most attractively priced names allowed the portfolio to significantly outperform the value index during a period when valuation was well-rewarded. The portfolio held up well despite the outbreak of conflict between the U.S. and Iran; selection within Energy has been positive, and key overweight positions (as of 7/31), such as Equinor (2%) and TotalEnergies (3.5%), have relatively limited exposure to the Strait of Hormuz. In addition to Energy, significant YTD contributors to excess return include Materials and Canadian Financials, where GMOI had strong selection in banks, including TD Bank (2.6%) and Bank of Nova Scotia (3.3%).
Sources of Potential Future Return
The team continues to see opportunities within international deep value and believes it offers a compelling, differentiated source of return, even after a period of strong performance. This outlook is supported by three sources of potential future return:
- International stocks trade at reasonable valuations (and a significant discount to the U.S. equity market)
The international equity universe remains cheap relative to the U.S., with a P/E ratio of 20.9x, an almost 30% discount to the S&P 500’s 29.2x. U.S. companies need to deliver extraordinary results to grow into those valuations, whereas non-U.S. companies simply need to avoid disappointing too terribly. The burden of proof is on the U.S. equity market to justify its inflated valuations – we prefer to be hunting for bargains outside the U.S.
The GMOI portfolio trades at a 35% discount to the MSCI World ex-U.S. index and a 14% discount to the MSCI World ex-U.S. value index, making it ideal for investors who want to take advantage of today’s unusually disparate equity valuations. - Value spreads remain historically wide
Value stocks continue to trade at a considerable discount to growth stocks, and GMO fully exploits this advantage by dialing into the deep value cohort. Despite considerable realized outperformance, this segment continues to trade at a historically wide discount (20th percentile vs. history) due to high idiosyncratic volatility. A few upside surprises caused select stocks to reprice; GMOI has taken profit on these names and reinvested in cheaper stocks, maintaining its valuation advantage. - Exposure to cheap currencies
The U.S. dollar remains very expensive (79th percentile vs. history as of 7/31). Investors may benefit from exposure to cheaper currencies like the Euro and the Yen, either through currency appreciation or just stronger earnings growth, as companies operating in cheap currencies have a low-cost advantage.
U.S. DOLLAR REMAINS VERY EXPENSIVE
The U.S. dollar is just off its 40-year high
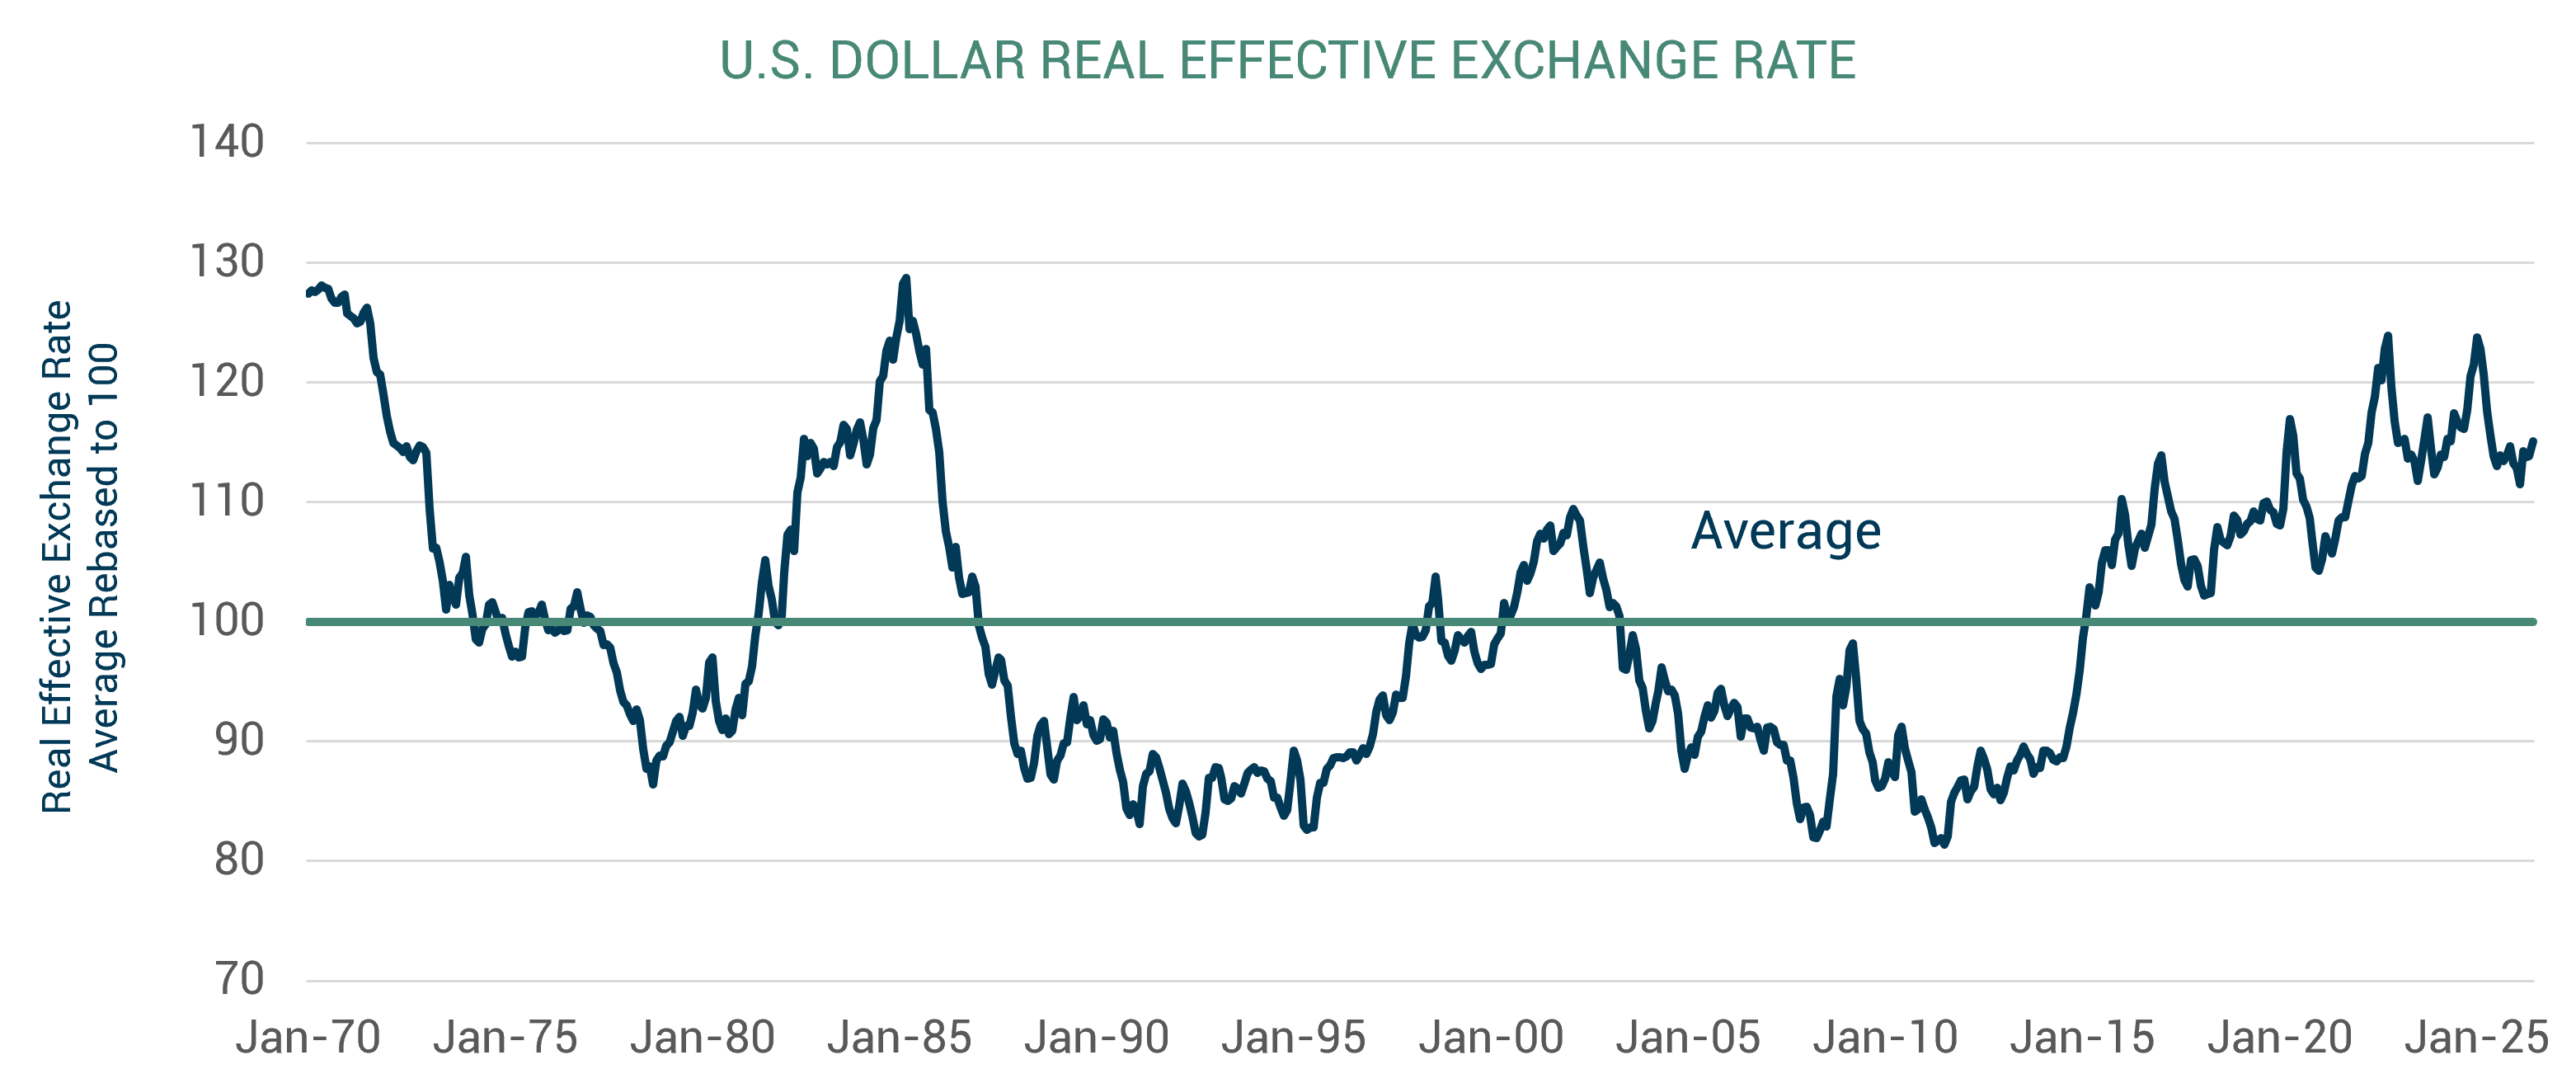
As of 6/30/26 | Source: BIS, GMO
Bank of International Settlements Narrow Real Effective Exchange Rate
Bottom Line
With non-U.S. equities trading at a meaningful discount to the U.S., value spreads still wide, and the dollar expensive, we believe GMOI remains well positioned for investors seeking a differentiated source of long-term return.
To go deeper on the investment thesis, explore the role of active portfolio rotation, and why GMO continues to see opportunities within international deep value, read our related research:
- The Case for Acting Now in International Deep Value
- How a "Big Bet" Remains Poised for Future Outperformance
For the latest portfolio information, performance, holdings, and additional materials, visit the GMOI Fund Page.
STRONG OUTLOOK AND STRONG PERFORMANCE
As of 7/31/2026
|
|
YTD Total Return |
Trailing 12 Month
|
Price/Earnings Ratio |
| GMOI NAV (net of fees) | 20.6% | 42.4% | 13.6x |
| MSCI World ex-U.S. Value | 17.0% | 36.1% | 15.9x |
| MSCI World ex-U.S. | 11.4% | 25.0% | 20.9x |
| S&P 500 | 10.1% | 19.6% | 29.2x |
AVERAGE ANNUAL TOTAL RETURN
(EXCHANGE TRADED FUND, NAV) IN USD
As of 6/30/2026
|
|
Inception |
QTD |
YTD |
1-Year |
Since Inception |
| GMO International Value ETF | 10/28/2024 | 4.70 | 12.18 | 32.90 | 30.32 |
| MSCI World ex-U.S. Value | 8.15 | 10.85 | 29.33 | 28.65 | |
| Value Added | -3.44 | 1.33 | 3.57 | 1.67 |
AVERAGE ANNUAL TOTAL RETURN
(EXCHANGE TRADED FUND, MARKET PRICE) IN USD
As of 6/30/2026
|
|
Inception |
QTD |
YTD |
1-Year |
Since Inception |
| GMO International Value ETF | 10/28/2024 | 3.87 | 12.07 | 32.62 | 30.36 |
| MSCI World ex-U.S. Value | 8.15 | 10.85 | 29.33 | 28.65 | |
| Value Added | -4.28 | 1.22 | 3.29 | 1.71 |
AVERAGE ANNUAL TOTAL RETURN
(EXCHANGE TRADED FUND, NAV) IN USD
As of 7/31/2026
|
|
Inception |
MTD |
QTD |
YTD |
1-Year |
Since Inception |
| GMO International Value ETF | 10/28/2024 | 7.54 | 7.54 | 20.63 | 42.38 | 34.10 |
| MSCI World ex-U.S. Value | 5.56 | 5.56 | 17.01 | 36.07 | 31.07 | |
| Value Added | 1.98 | 1.98 | 3.62 | 6.31 | 3.03 |
AVERAGE ANNUAL TOTAL RETURN
(EXCHANGE TRADED FUND, MARKET PRICE) IN USD
As of 7/31/2026
|
|
Inception |
MTD |
QTD |
YTD |
1-Year |
Since Inception |
| GMO International Value ETF | 10/28/2024 | 7.58 | 7.58 | 20.56 | 42.06 | 34.17 |
| MSCI World ex-U.S. Value | 5.56 | 5.56 | 17.01 | 36.07 | 31.07 | |
| Value Added | 2.01 | 2.01 | 3.54 | 5.99 | 3.10 |