
Listen to this Quarterly Letter
Executive Summary
As the AI build-out attracts extraordinary amounts of capital, we argue that the catalyst for a potential bubble break may come from equity supply rather than disappointing AI demand:
- Bubbles need fresh capital, and rising supply often breaks them.
- In AI, that supply may come through SpaceX lockup releases, the likely IPOs of Anthropic and OpenAI, and hyperscaler-driven secondary issuance.
- Today’s passive, benchmark-aware, and constrained markets leave fewer buyers willing to absorb new equity supply.
- Data suggests each 1% increase in equity supply has historically cut market value by roughly 4% over the next year.
- Rising supply could pressure returns before weak AI economics become obvious.
Introduction
Investment bubbles are inherently dangerous beasts. Like a natural Ponzi scheme, an investment bubble needs to draw in ever larger amounts of capital to keep it going. Nothing attracts capital like apparent success, so an inflating bubble that is creating fortunes for those who got in early will inevitably draw in capital. Unfortunately, this means the amount of money lost when the bubble bursts can outstrip the gains created on its way up.
For professionals, avoiding bubbles can also be treacherous because getting out too early is generally an even more unforgivable sin than staying in too long. If you stay too long, you will at least have plenty of company losing money in the ensuing bear market. But nothing infuriates clients more than seeing everyone else get rich as the bubble inflates, and the tracking error involved in avoiding bubble securities only grows as the bubble goes on. This makes bubble timing an incredibly high-stakes game, with investors who see the signs awaiting some mystical catalyst to mark the market top in time for them to get out.
We generally consider ourselves much better at spotting bubbles than calling their tops, but in the particular case of the AI bubble, we think we know what will catalyze its inevitable demise: supply. Increasing supply is often the proximate cause of a bubble bursting. The interesting question, which only time will answer, is supply of what?
Some bubbles are killed by increasing supply of the good in question. The British Railway boom, for example, was undone by excessive railway investment, which caused returns on capital in the sector to collapse when demand failed to keep pace. Other bubbles die a different sort of death, brought down more by the supply of the assets investors are snapping up than by the physical supply of the technology that inspired the bubble in the first place. The 2000 Internet Bubble appears to fit this pattern. While the build-up of fiber optic capacity ultimately outstripped the growth of internet traffic, the bubble burst well before that became common knowledge. Instead, the market roll-over seems to have been driven by a flood of internet-related share issuance, which eventually made the natural Ponzi-scheme dynamic impossible to sustain—even though disappointing fundamental news about internet growth had yet to arrive.
In the decades since 2000, the stock market has, if anything, become even more sensitive to supply. This makes equity supply a good candidate to hit the market even before excessive investment in AI outstrips the plausible demand for AI services. Plenty has been written about the huge amounts of AI revenue that will be required to justify today’s massive investments. Our guess is that, in the end, demand will fail to keep up with supply and the ROI on the AI build-out will prove disappointing. But much less has been written about why the stock market has become ever more sensitive to changes in supply and demand for shares. The rest of this paper focuses on that sensitivity and how, coupled with the huge amount of equity supply coming to the market in the coming quarters, it could easily turn the market lower even before it becomes obvious that AI revenues are falling short of investors’ expectations.
Financial Supply & Demand
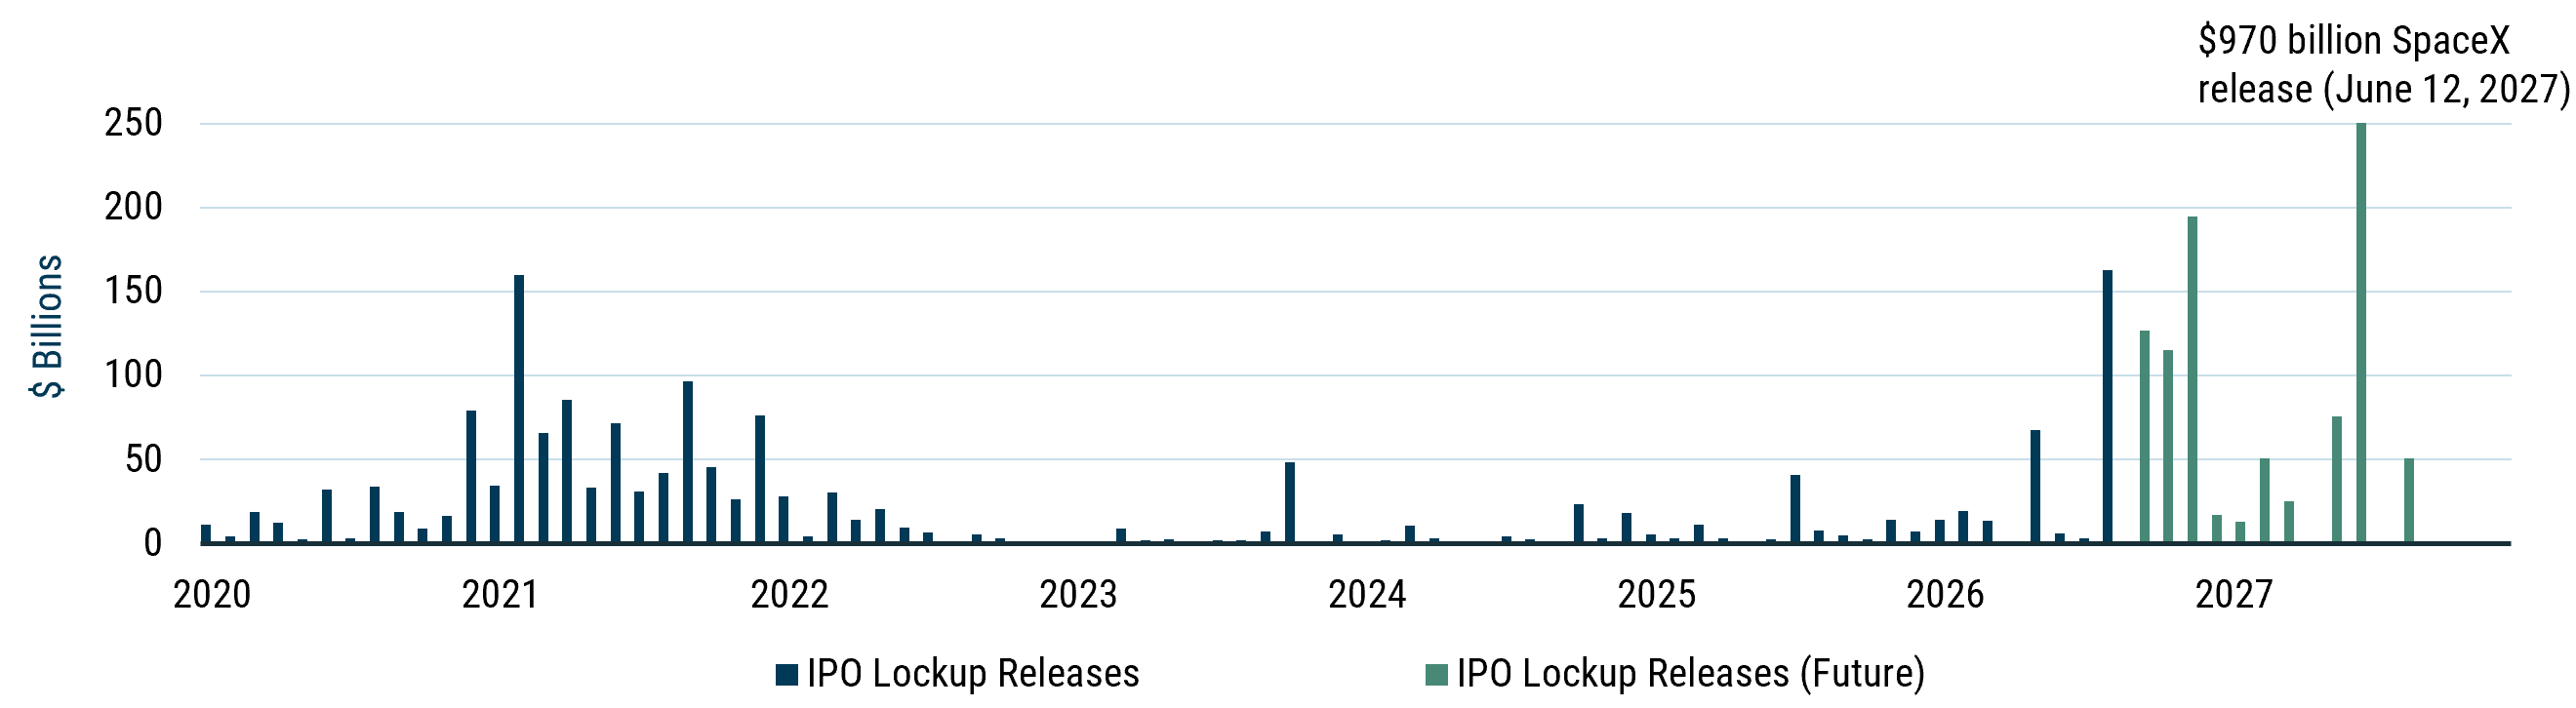
On June 12, 2027, the last batch of roughly $2 trillion of SpaceX shares will be released from its contractual “lockup” (Exhibit 1). This will allow individuals and institutions that bought or received SpaceX stock when the company was private—from endowments and foundations to company employees—to sell their shares to willing buyers in public markets. Our best guess is that most non-Elon shareholders will sell. Employees need cash to pay down mortgages or interest on SpaceX-collateralized debt. Foundations have been cash-strapped in a distribution-lite world and have little desire to hold massive stock-specific risk. Endowments are even more in need of liquidity. And happily, SpaceX seems to have lots of willing buyers. 1
Exhibit 1 : IPO Lockup Releases
As of 6/30/2026 I Source: GMO, SpaceX Filings
To buy SpaceX stock, investors will need to offer formerly private SpaceX shareholders the going market price. Since most investors don’t have a whole lot of idle cash 2 , they will likely need to raise the funds by selling assets—and the assets most likely to be sold are liquid equities. If the formerly private SpaceX shareholders then reinvest all that cash in other liquid equities, the transaction should cause very little stress for markets; it would effectively be a swap of SpaceX shares for shares of everything else. 3
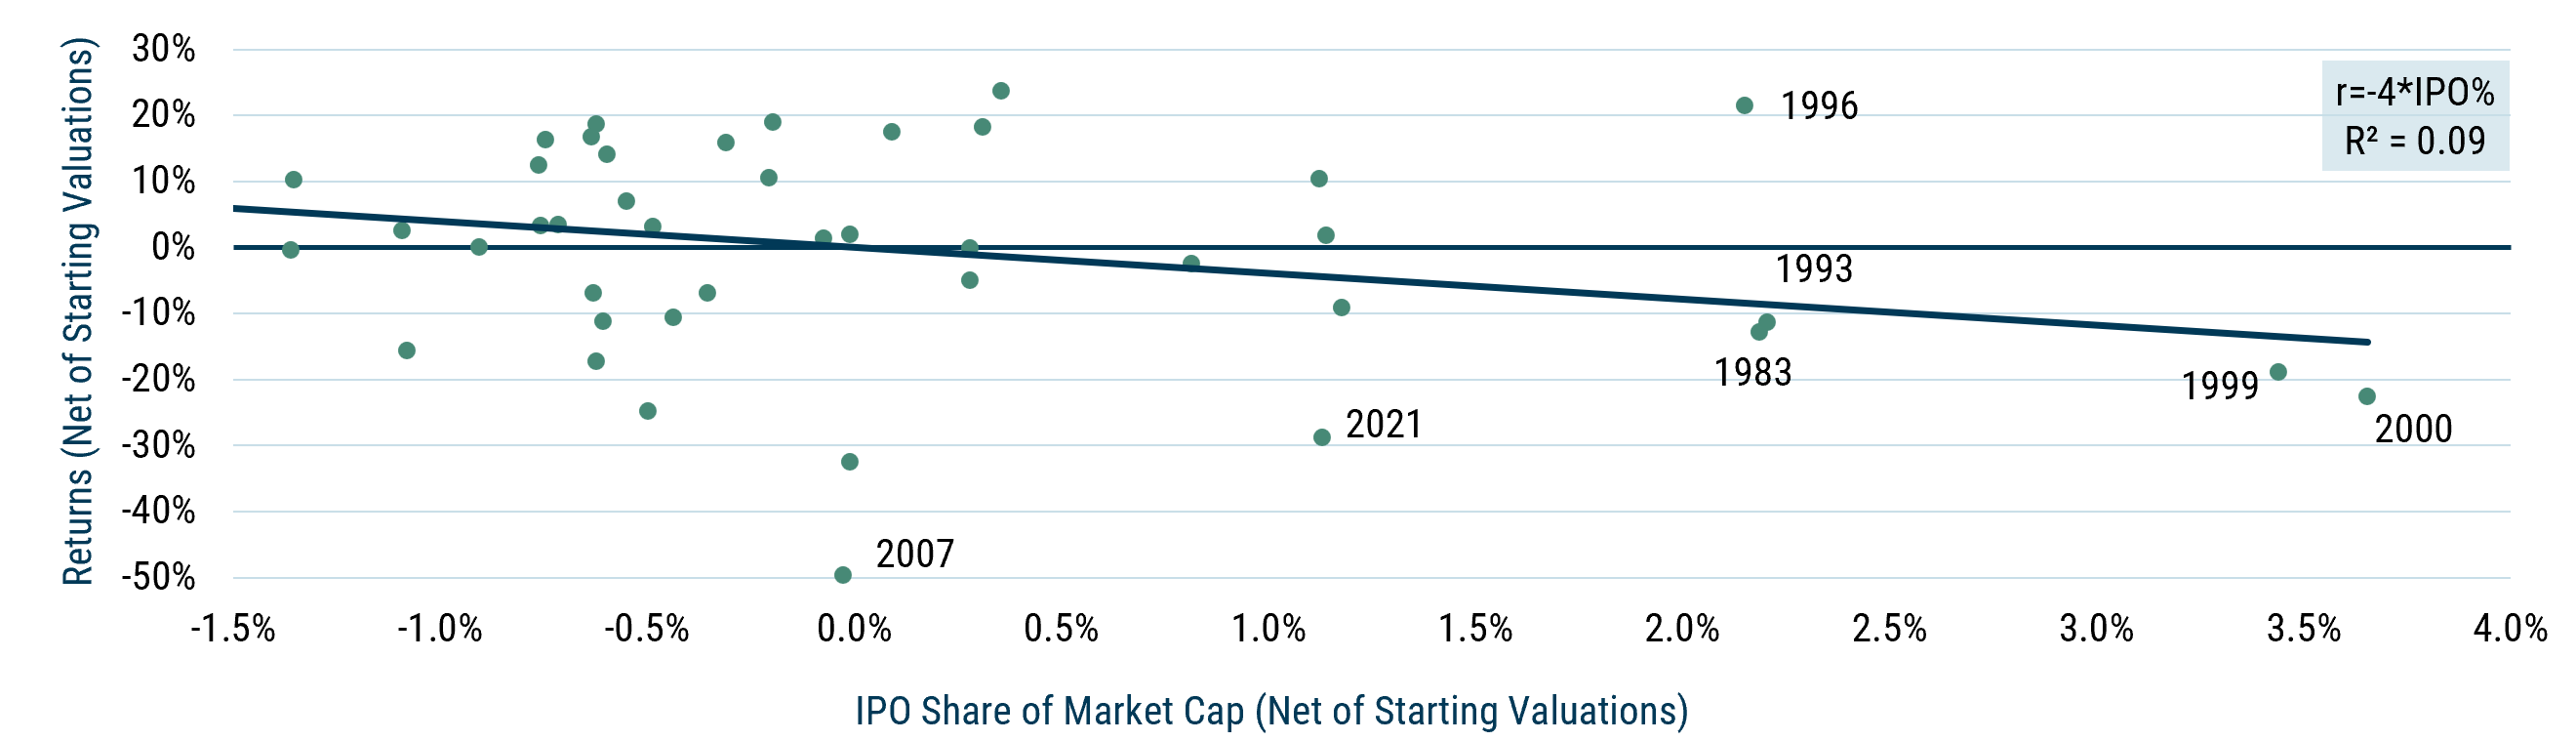
But if the formerly private SpaceX shareholders do not simply buy other equities and instead want to use some of the cash to pay capital gains taxes, reduce obligations, invest in a new AI-focused venture capital vehicle, or purchase caviar, then this is not merely a stock-for-stock swap. Formerly private SpaceX shareholders will not be the ready buyers of all the stock that needs to be sold to fund SpaceX purchases. This means public equity supply will rise more than demand, and the result, as we have seen time and again in the wake of large IPO waves, will be lower share prices. 4 As Exhibit 2 shows, controlling for valuations, a 1% increase in the market share of IPOs has historically led to an approximate 4% decrease in prices. 5
Exhibit 2 : U.S. IPO Issuance vs. S&P 500 Return
As of 6/30/2026 I Source: Jay Ritter, Compustat, Worldscope, Bloomberg, MSCI, and GMO
Both IPO and next-year S&P 500 return are residualized on contemporaneous forward 1-year earnings yield (Frisch–Waugh–Lovell), so the slope is the IPO coefficient holding valuation fixed.
On the face of it, this increase in equity supply should not matter. Financial assets—unlike consumption goods—should be priced solely on the claims to the cashflows they beget 6 .The price of Starbucks coffee should be determined by how much people like said coffee (demand) and how many alternatives to it exist (supply). The price of Starbucks Corporation shares, on the other hand, should depend only on investors’ future cashflow expectations, discounted at a rate that compensates them for the riskiness of said cashflows. Whether 100 or 1,000 Starbucks shares trade in secondary markets, or whether other coffee chains decide to go public, 7 should not affect Starbucks's value at all unless it affects the company’s expected cashflows or their perceived riskiness. Which means that in a profit-maximizing world where investors can choose from a wide gamut of assets, any risk-return discrepancies caused by shifting supply and demand should be arbitraged away. An idiosyncratic flow—“I took too much leverage on AI stocks and now need to sell them all; oops”—might occasion temporary price changes, sure. But it shouldn’t take long for profit-maximizing arbitrageurs to pounce on the opportunity, bringing prices back in line with fair values.
The real world has some pure profit maximizers who are looking to take advantage of aberrant prices. But the real world mostly contains constrained profit maximizers. The portfolio manager of a U.S. equity fund, for instance, might think European equities and Argentinian debt look cheap, but unless her prospectus allows those securities, she cannot buy them. She might also think U.S. equities as a whole look expensive, but still find it almost impossible to meaningfully reduce her fund’s exposure. 8 This might seem reasonable—a U.S. equity fund is, by definition, meant to own U.S. equities. But even within that remit, this manager is probably constrained. She may hate certain benchmark-heavy assets while being forced to own them because of benchmark-relative position limits. She may think today’s benchmark-relative opportunity set is exceptional, but be unable to take more risk because of a tracking error constraint. Even within her own asset class, this investor cannot focus purely on profit maximization.
The reasons for so many constraints abound. Institutions delegate their portfolio management, and it is easier to compare and track managers within specialized boxes. Underperforming managers have an asymmetric incentive to take outsized risk, so setting clear risk limits is important. And because benchmarks can be easily replicated by passive vehicles, they make helpful measuring sticks with which to judge active performance. More interesting than the reasons, however, are the consequences.
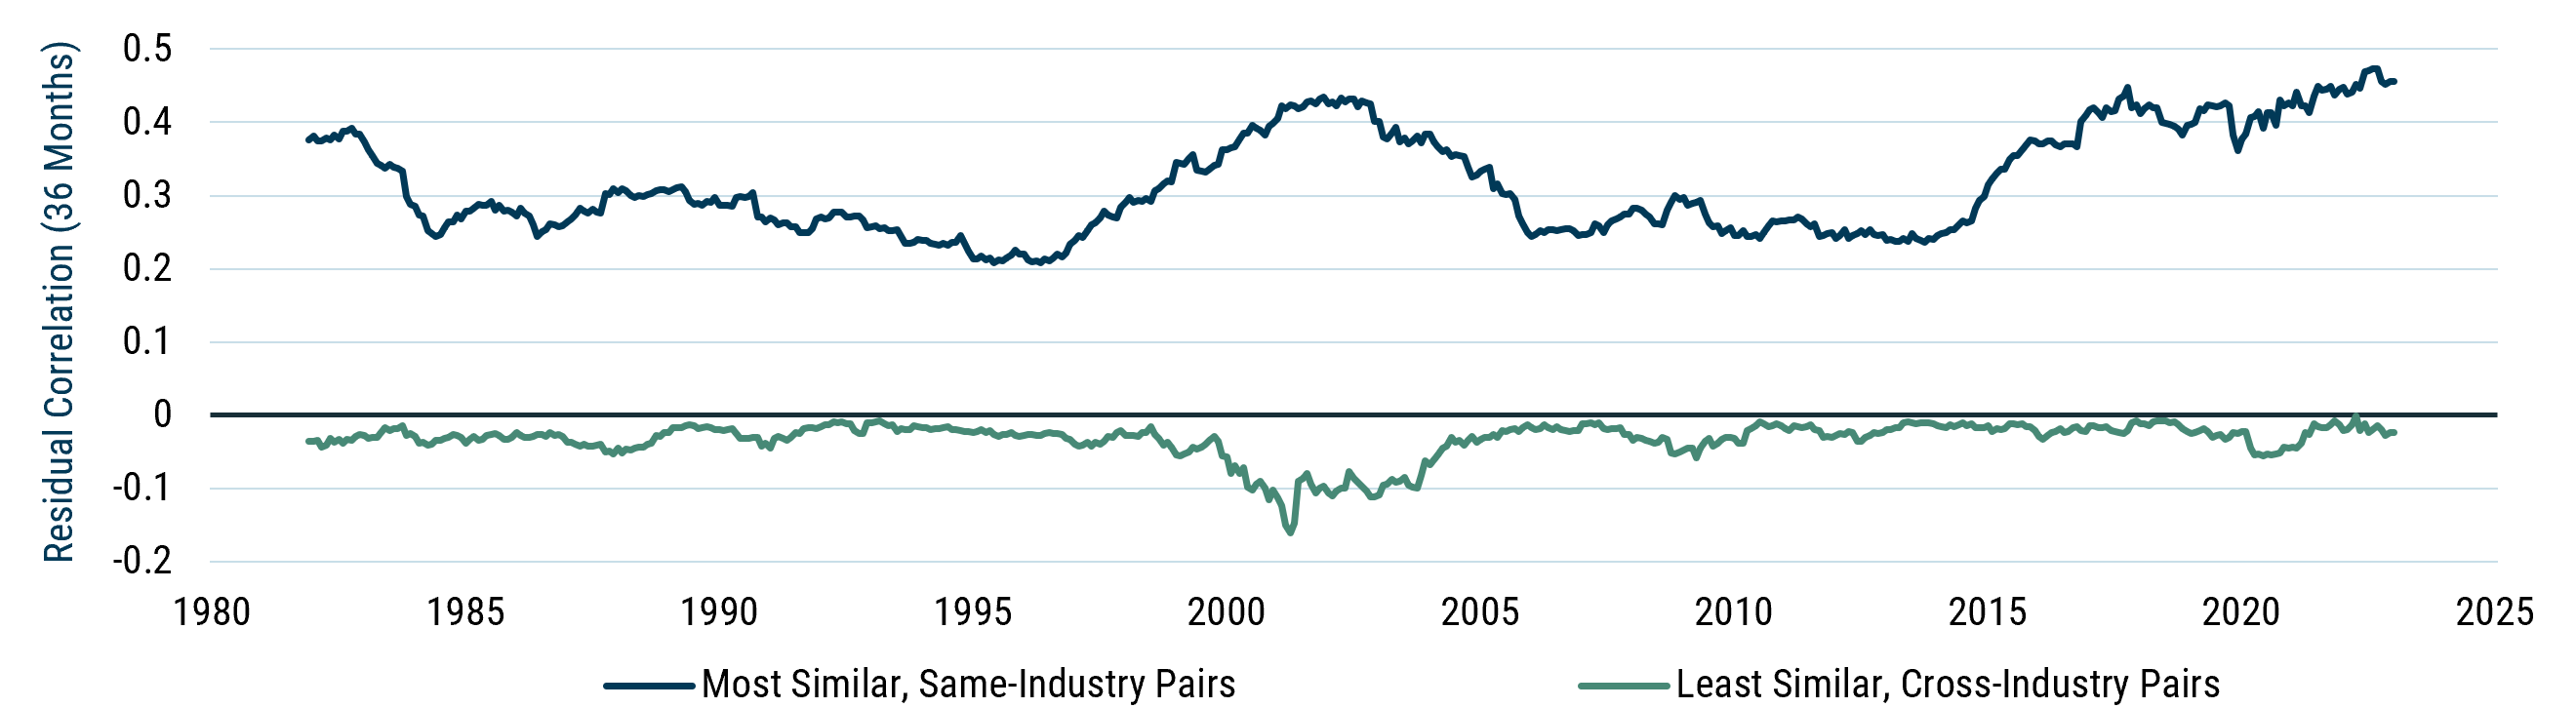
The first consequence is that markets are segmented. The focus on specialists tends to link the pricing of securities that are obvious neighbors, but it also creates wedges between assets that look less alike. As more investment managers move from looking across assets and asset classes to focusing on niches within an asset class, fewer comparisons get made. You might compare Microsoft and Exxon if your job is to trade U.S. equities, but that will be much harder to do if you are a growth manager—and virtually impossible if you sit in a growth tech pod. With fewer investors willing to trade between Microsoft and Exxon, it also becomes much easier for the prices of those two securities to drift farther apart. Indeed, one phenomenon that has become clearer over time is that stock correlations have risen for similar businesses while remaining solidly at zero for stocks dissimilar in industry and style.
Exhibit 3 : Average Pairwise Correlation
Most vs. Least Similar Stocks (Russell 3000 Proxy)
As of 6/30/2026 I Source: Compustat, Worldscope, Bloomberg, MSCI, GMO
Similarity based on GMO Asset Allocation risk model characteristics and GICS industry groups; pairwise correlations of monthly residual returns (each stock minus the cap-weighted universe return that month) over the trailing 36 months. Most Similar = closest decile among same-industry pairs. Least Similar = farthest decile among cross-industry pairs.
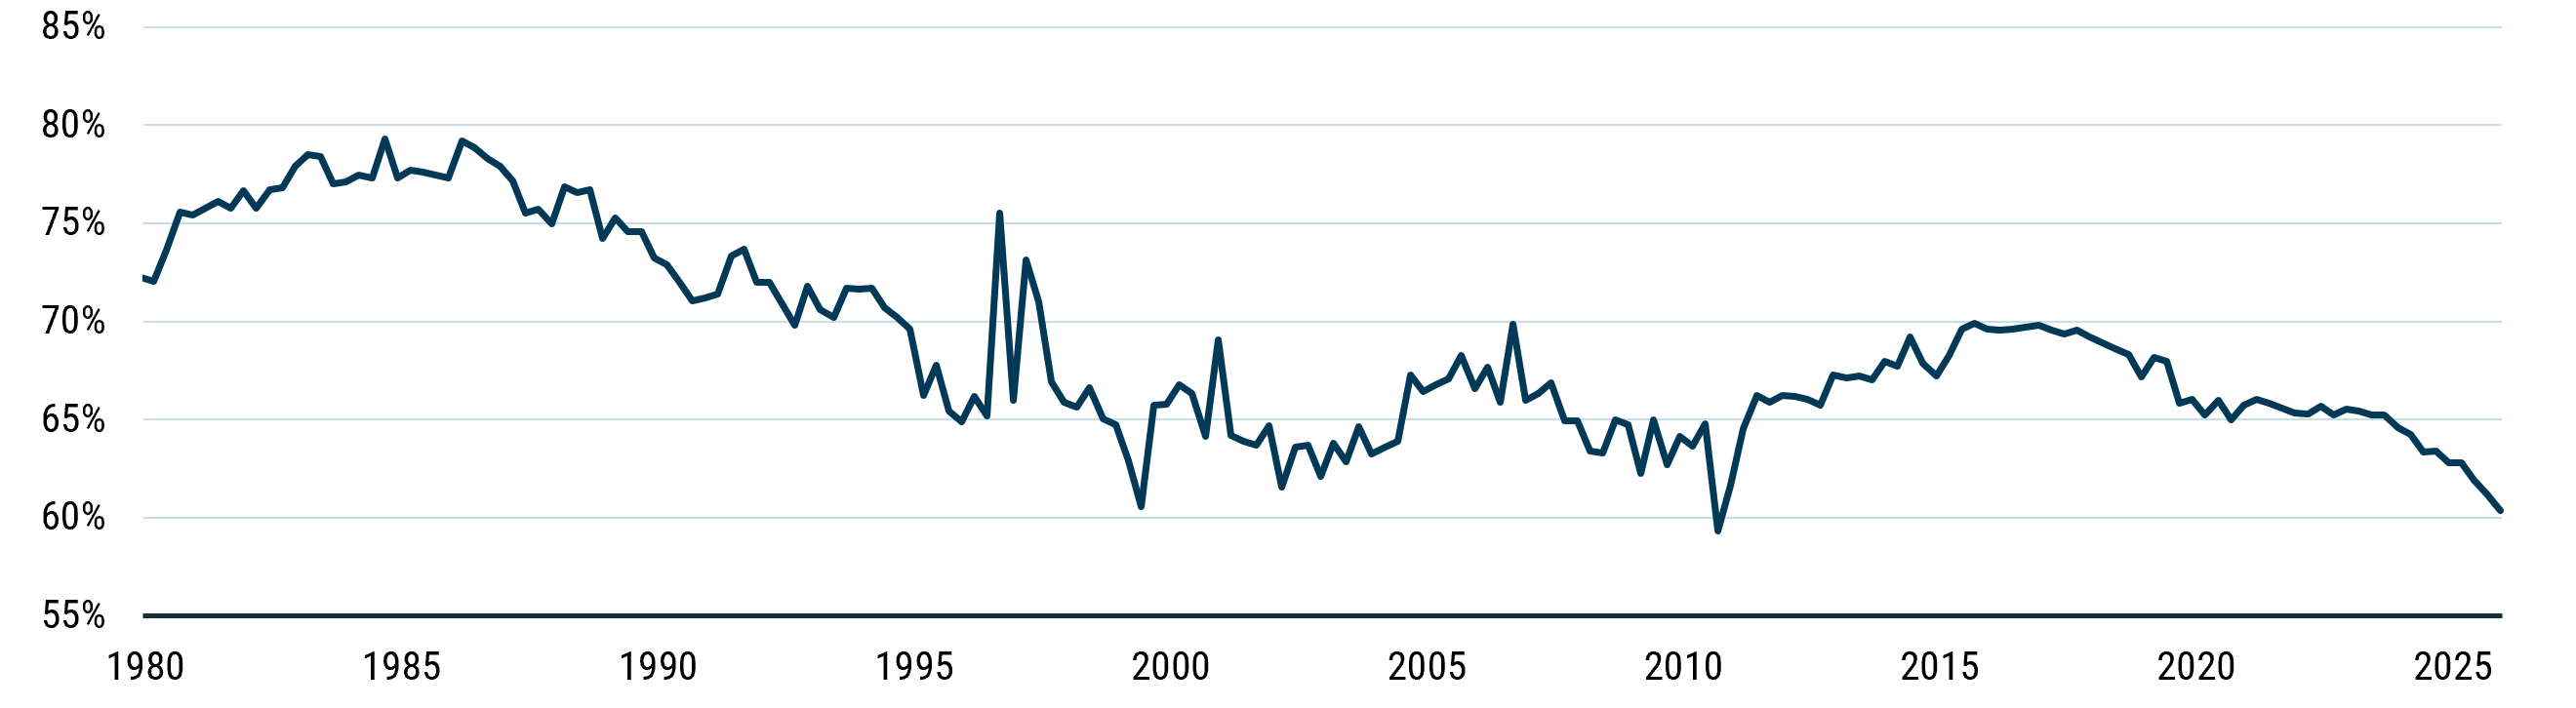
The second consequence is that benchmarks matter to a rather unreasonable degree. In the 1980s, almost 80 cents of every dollar allocated to a U.S. active equity mutual fund went to off-benchmark positions. That number declined gradually over the years, reaching 60 cents in 2025, driven partly by less reliance on fundamental stock-pickers and partly by a broader shift toward benchmark awareness. This decline may not seem dramatic, until you consider that over 50% of equity assets are now allocated to passive vehicles (up from less than 10% in 1980), and that passive vehicles simply do not take off-benchmark positions. We have gone from a world where roughly 75% of dollars were consistently looking for better opportunities to one with less than half that amount in “active” capital. In plain English, only 30 cents of every dollar allocated to equity markets is used to buy or sell securities opportunistically. 9 That means any investor looking to trade has a much smaller fraction of the market willing to trade with them. 10
Exhibit 4 : Active Share of Active U.S. Equity Funds Benchmarked to the S&P 500
As of 6/30/2026 I Source: Cremers & Petajisto, Thomson Reuters, Factset, GMO
U.S. common-stock funds with ≥ 10 holdings and ≥ $10 million in AUM, and active share superior to 50%.
It is somewhat mind-boggling to think that a supermajority of shares in U.S. equities owned by professional investment managers will be neither bought nor sold, no matter what happens to prices. 11 And while stocks could still be valued entirely off discounted cashflow streams—you “only” need the remaining active dollars to be highly price- and information-sensitive—that seems far from plausible. For one, we see remarkably little change in holdings despite extreme price volatility. 12 Secondly, academic studies of exogenous demand shocks, such as index inclusions or forced sales by mutual funds, confirm this price insensitivity. On average, these studies find that a 1% increase in demand for a stock tends to raise its price by roughly 1%. 13
To be honest, a 1% price move on a 1% flow doesn’t seem worth getting too exercised over. At the end of the day, that’s roughly the price elasticity of demand for regular consumption goods like cars or shellfish. But single stocks should not trade like shellfish. With literally hundreds of substitutes for any stock, all theoretically assessed on the same criteria (risk and return), even a small medium-term impact from flows on prices tells us we live far from the land of pure profit maximizers. And that gap gets wider as we turn away from assets with many close substitutes, like single stocks, and turn toward assets with few close alternatives, like the U.S. stock market.
The Stock Market Cares a Lot About Flows
Very few investment vehicles actively change their U.S. equity allocation. As of May 2026, roughly 83% of the approximately $30 trillion in active and passive mutual funds and ETFs was held in funds that only trade U.S. equities 14 . In fact, only 3% of (non-TDF) equity-owning funds 15 can trade in or out of equities from other asset classes. This means that even if all asset allocators behaved like GMO—moving portfolios meaningfully as the opportunity set changes—they still could not fully smooth the price dislocations created by flows.
Nor do the ultimate asset owners, such as retirees and sovereign wealth funds, significantly alter their asset allocations. Only about 10% of 401(k) and IRA accounts, which make up most of the $45 trillion in retirement assets, change their asset mix in any given year, 16 and sovereign wealth funds are likewise loath to change their asset mixes. In fact, the world’s largest sovereign wealth fund 17 has shifted its target equity allocation only twice over the past twenty years, most recently in 2017, when it moved from 60% to 70%. All of which means that few dollars are actually chasing opportunities across asset classes.
The corollary, much as with single stocks, is that when flows do cross asset classes, they matter a lot. Our best estimate of this effect—measured by looking at how various predictable, non-informative flows impact the price of the U.S. stock market—is that every 1% increase in the supply of equities leads to a 4% decrease in the stock market’s total value over the next 12 months. 18 That is not particularly surprising given how few investors change their allocation to equities in response to lower prices. 19 Nor is it helped by the record-high equity allocation of U.S. investors, who have never had so much of their liquid assets tied up in public equities.
Exhibit 5 : Aggregate Investor Allocation to Equities
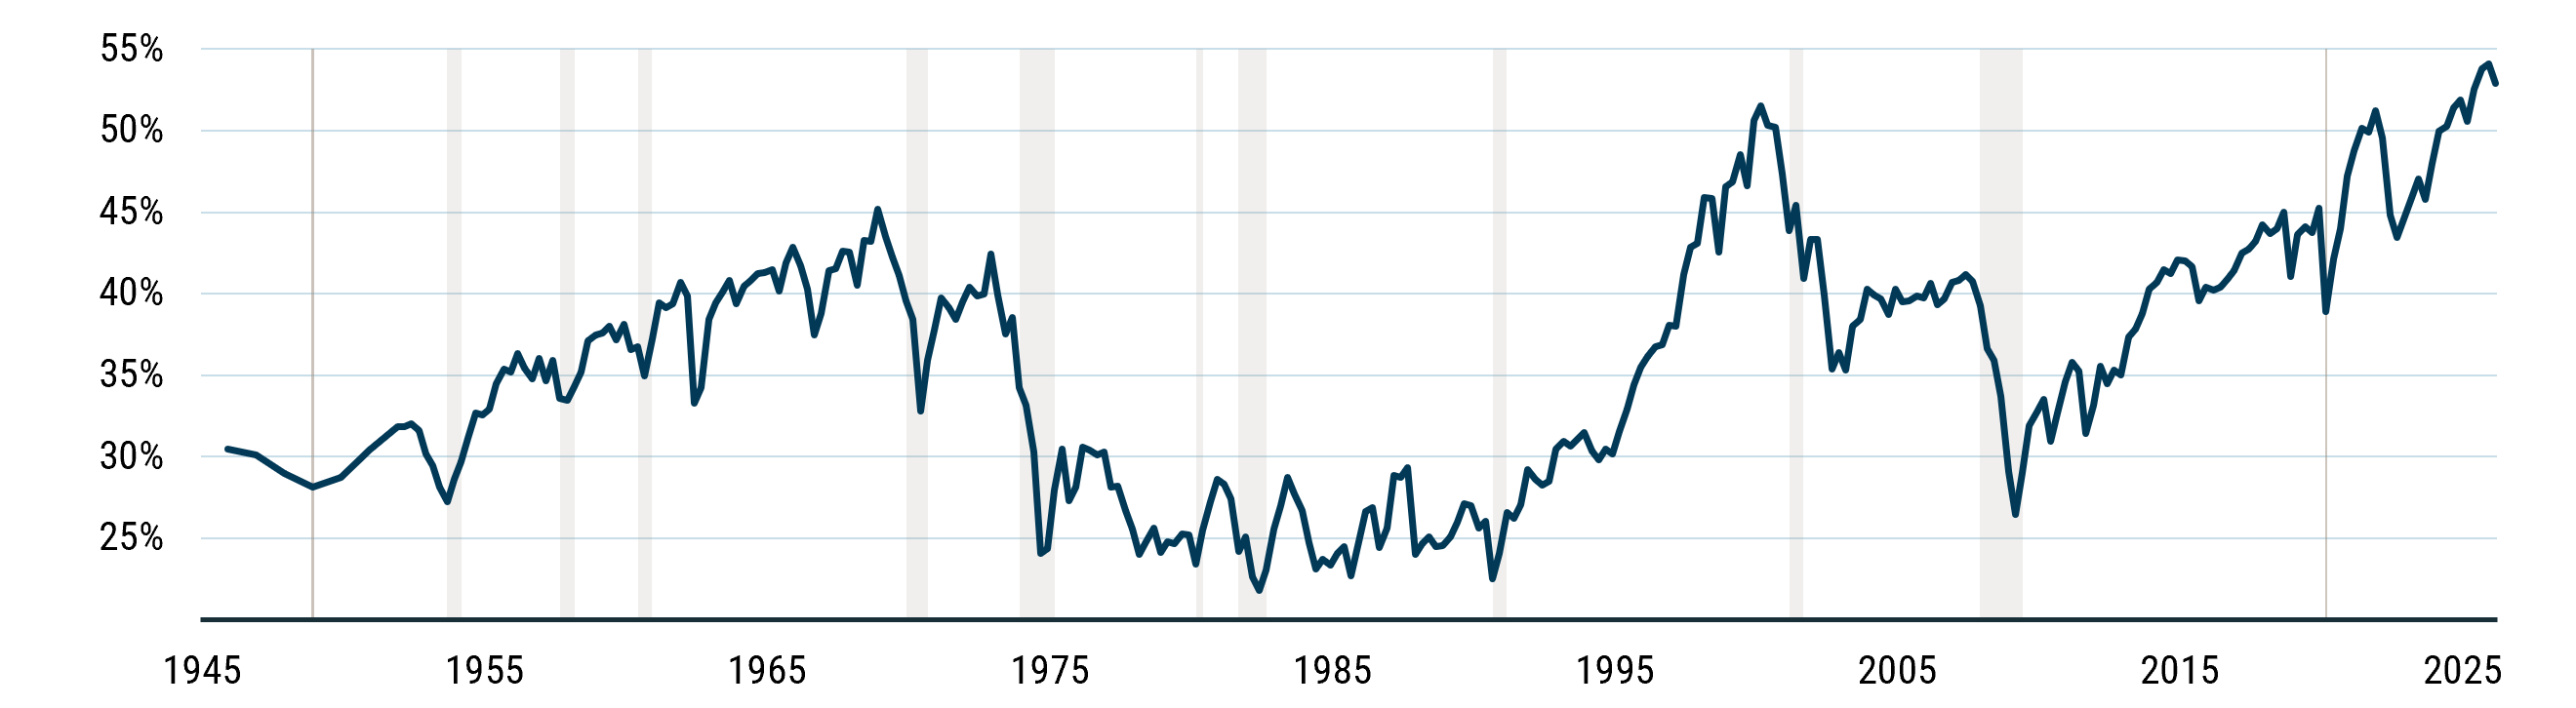
As of 6/30/2026 I Source: Jay Ritter, Compustat, Worldscope, Bloomberg, MSCI, GMO
Based on the measure put forth by Philosophical Economics (https://www.philosophicaleconomics.com/2013/12/the-single-greatest-predictor-of-future-stock-market-returns/).
Aggregate investor allocation to equities is domestic corporate equity liabilities (nonfinancial plus financial) divided by that equity plus debt securities and loans of households, nonfinancial corporates, federal, state/local, and the rest of the world. Shaded bands are National Bureau of Economic Research (NBER) recessions.
Now consider what is happening to equity supply. SpaceX’s non-Elon sales alone exceed 1% of the U.S. stock market’s value. We are likely to see IPOs from both Anthropic and OpenAI—together valued at about 5% of the U.S. stock market’s total investable market cap 20 —over the next 12 months. For the first time in twenty years, with the brief exception of the GFC, we are seeing net dilution in the U.S. stock market (i.e., share issuance exceeding share buybacks) as the hyperscalers continue their capital expenditure spree. In aggregate, we are going from a world where equity supply was shrinking by roughly 1% per annum (with buybacks exceeding primary or secondary issuance) to one in which equity supply will be increasing by close to 5%, if not more.
Exhibit 6 : U.S. Net Primary and Secondary Equity Issuance
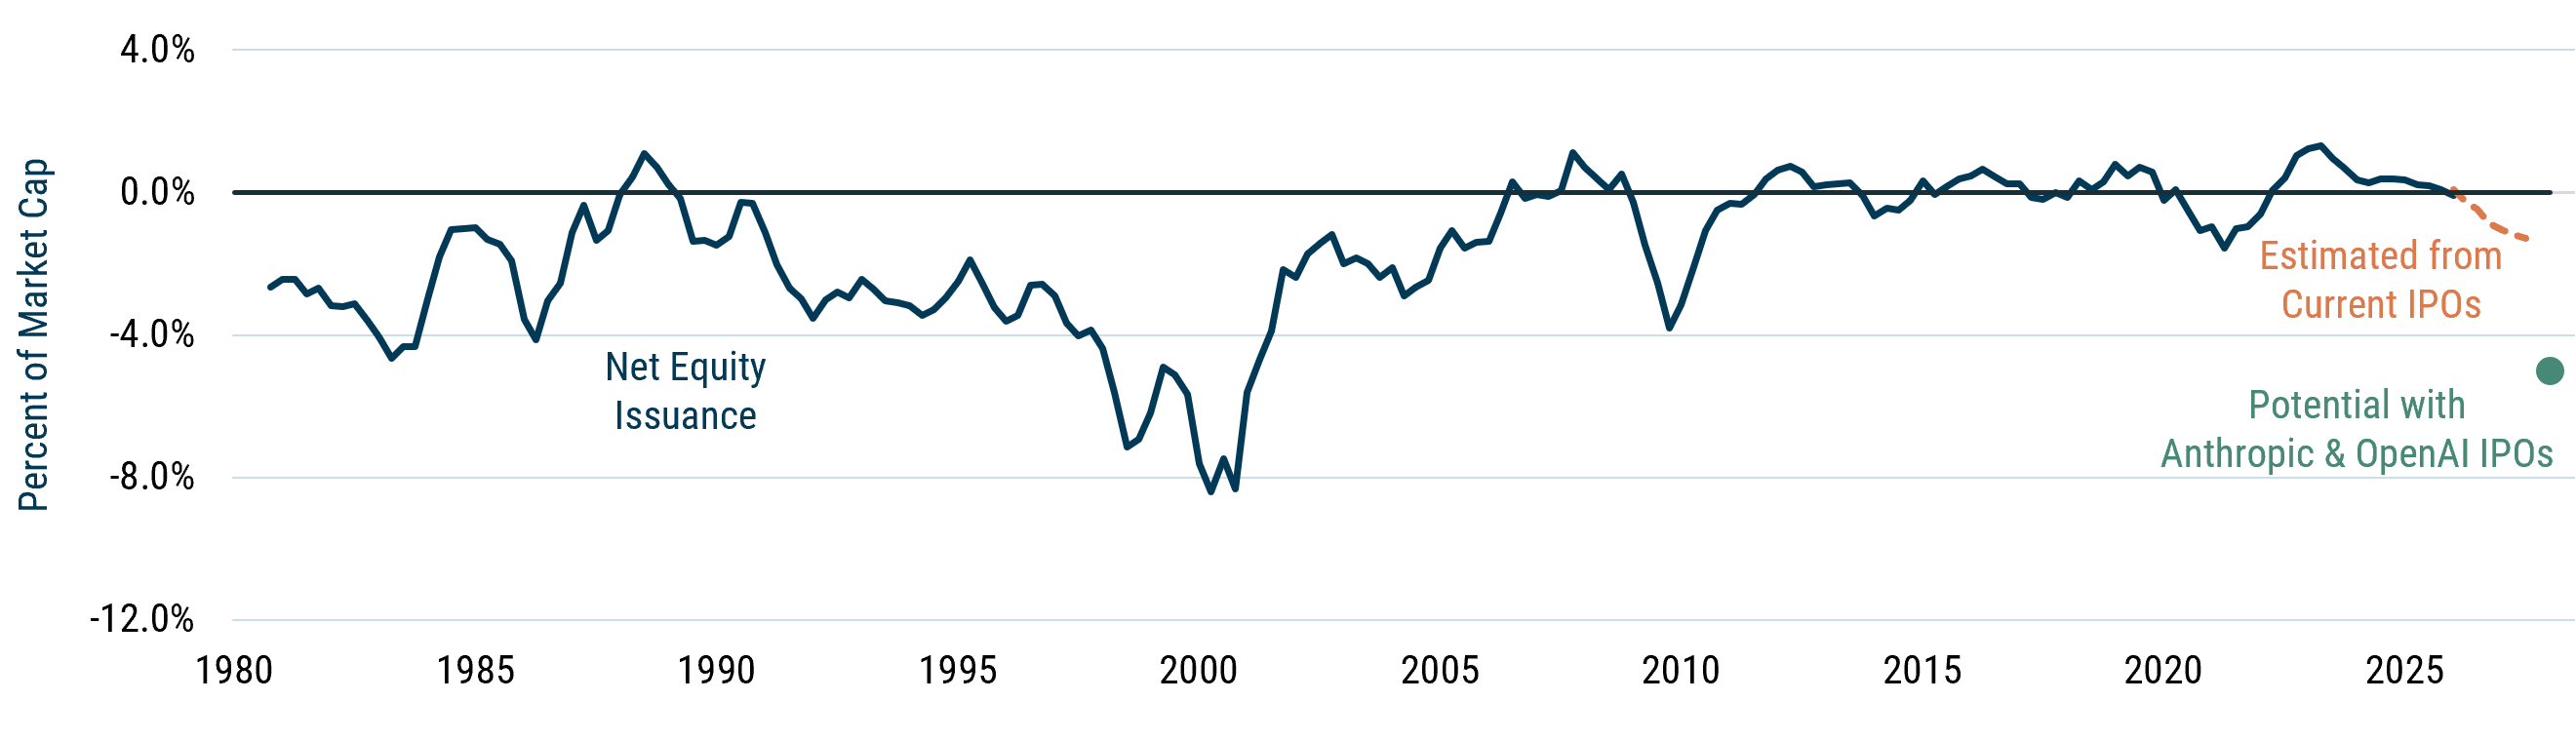
As of 6/30/2026 I Source: Jay Ritter, Compustat, Worldscope, Bloomberg, MSCI, GMO
If you believe our 4x multiplier, this means we should expect returns that are some 20% below average (roughly 6% real) over the next 12–18 months from the headwind of rising equity supply alone. And even that 20% ignores the risks from today’s extremely expensive valuations, outsized profit expectations, and the macro and geopolitical issues that global markets have cheerfully ignored so far. In the Internet Bubble, issuance seems to have instigated the initial leg of the bear market. But once the market started moving lower, high valuations and the falling profit margins associated with that era’s overinvestment turned a regular downturn into a halving of the market—and something far worse for the internet darlings. Nothing tells us a similar event is off the table for today’s market.
Conclusion
The apparent rise in stock-price sensitivity to supply shocks has implications for professional investors well beyond the overall market. Coupled with supply- or demand-generating mechanisms like leveraged single-stock ETFs or insanely over-leveraged AI hedge funds, we’ve already seen the havoc that such sensitivity can wreak on the markets. Honestly, we’d guess that the topic gets less ink than it deserves because investors with the ability to exploit some of these implications have little incentive to explain how they are doing so. But when it comes to the overall market, we are not talking about arbitrage opportunities so much as a shift in the risk/reward trade-off—and that shift is important enough to share and harmless enough to our strategies that there is no reason not to. We believe the equity supply already coming to market is large enough to have a meaningful dampening effect on likely returns—perhaps a 20% hit relative to normal over the next year and a half, if history is a decent guide.
That is by no means guaranteed, of course. It’s always possible that demand grows along with supply and the market avoids stumbling over the next few quarters. But bubbles have a Ponzi-like feedback loop: if the market absorbs this round of supply without a meaningful hiccup, it will only encourage yet more supply, eventually overwhelming the market’s ability to absorb it all. At the same time, the capital raised will almost certainly fund more AI capacity, ultimately pressuring the returns on investment in that space. Given enough time, weak returns on investment will do in the bubble as additions to supply outpace demand and returns on the aggregated AI investment prove disappointing. But in a market as sensitive to equity supply as this one seems to be, prices are likely to turn before the market truly knows that has happened.
Not least of which are Nasdaq 100 ETFs.
Consider, for one, that any U.S. equity fund purchasing SpaceX stock probably holds close to 100% of its assets in U.S. equities, and therefore definitionally needs to sell something to fund the SpaceX purchase. This is clearest of all for purely passive funds.
With market makers bearing a little bit of inventory risk and making a lot of money.
Most of the time, a company’s release of its own stock doesn’t cause that much of an effect on the day that the lockup expires. This is because a) not all shares are sold that same day, and b) the market pre-positions for this, with lots of short-sellers synthetically increasing supply ahead of the release. This effect is much easier to pre-position for at the single stock level than at the market level (read the rest of this letter!).
In 1999–2000, IPOs peaked at ~5% of total market cap. It doesn’t take much new supply to overwhelm the market.
This is not always and everywhere true, seeing as financial assets with claims to no cashflows whatsoever can, by virtue of calling themselves a “currency,” become the subject of cult-like adoration (and ransomware enthusiasts), amassing tremendous value along the way.
Assuming we’re not going to the extreme of assuming coffee chains being listed will meaningfully affect gains from diversification.
For example, if her fund is named “U.S. Equity Fund,” she’ll have to obey the SEC’s naming rule and hold at least 80% of it in U.S. equities.
To be fair, claiming active share as “money available for opportunistic buying and selling” may be aggressive; asset owners might just like some of what their benchmarks own, and they might be willing to depart radically from their benchmarks should the right opportunity arise. When we look at the maximum active share of individual funds over the past five years, however, it has also drifted down. We therefore think it likely that benchmarks have become more important, despite (or perhaps due to) the rise of passive investing.
This could be offset by the ultimate asset owners being much more nimble in their allocations than they have been historically. A move from defined benefit plans (where there was some activity) to 401(k)s and Roth IRAs (where fewer than 10% of investors change their allocation or contribution mixes in any given year) suggests that this is hardly the case.
Barring a change so drastic that it causes benchmarks to add or remove a security, of course.
The rejoinder here is that prices could be volatile while holdings are persistent, so long as information shocks are equally volatile (that is, if Apple’s stock exhibits a 20% idiosyncratic price swing over a quarter, it’s because everyone received the same information that suggested Apple should be worth roughly 20% less). Though information shocks should obviously affect both prices and demand, and you can’t simply look at the volatility of holdings relative to the volatility of prices to bound elasticities; it takes genuine mental athleticism to think aggregate information swings are volatile enough to be a more likely cause of the relative stability of holdings than constraints-led inelasticity.
This is the inverse of demand elasticity.
Our assumption is that 100% of capital in U.S. equity funds goes to U.S. equities, 60% of capital in global equity funds goes to U.S. equities (consistent with the U.S. weight in MSCI ACWI), and 36% of the capital in hybrid funds goes to U.S. equities (consistent with a 60/40 global equity/bond mandate).
These statistics come from ICI’s May 2026 release on active and index investing (https://www.ici.org/research/stats/combined_active_index_0526). ICI excludes funds that invest primarily in other funds (like target-date funds, or TDFs), which modestly understates the amount of asset allocation that can occur. TDFs, however, are far from price sensitive.
See FAQ: Passive Investing (Inker and Pease 2024) for evidence.
Norway’s Government Pension Fund Global (GPFG).
We estimate this from blending the impact of a variety of quasi-exogenous flows on prices with the flow multipliers found in the academic literature.
Gabaix and Koijen (2020), the main academic reference on the topic, places the flow multiplier at ~5x.
With OpenAI’s IPO floating at ~$1.5 trillion and Anthropic’s at ~$2 trillion.
Disclaimer: The views expressed are the views of Ben Inker and John Pease through the period ending September 2026 and are subject to change at any time based on market and other conditions. This is not an offer or solicitation for the purchase or sale of any security and should not be construed as such. References to specific securities and issuers are for illustrative purposes only and are not intended to be and should not be interpreted as recommendations to purchase or sell such securities.
Copyright © 2026 by GMO LLC. All rights reserved.
Not least of which are Nasdaq 100 ETFs.
Consider, for one, that any U.S. equity fund purchasing SpaceX stock probably holds close to 100% of its assets in U.S. equities, and therefore definitionally needs to sell something to fund the SpaceX purchase. This is clearest of all for purely passive funds.
With market makers bearing a little bit of inventory risk and making a lot of money.
Most of the time, a company’s release of its own stock doesn’t cause that much of an effect on the day that the lockup expires. This is because a) not all shares are sold that same day, and b) the market pre-positions for this, with lots of short-sellers synthetically increasing supply ahead of the release. This effect is much easier to pre-position for at the single stock level than at the market level (read the rest of this letter!).
In 1999–2000, IPOs peaked at ~5% of total market cap. It doesn’t take much new supply to overwhelm the market.
This is not always and everywhere true, seeing as financial assets with claims to no cashflows whatsoever can, by virtue of calling themselves a “currency,” become the subject of cult-like adoration (and ransomware enthusiasts), amassing tremendous value along the way.
Assuming we’re not going to the extreme of assuming coffee chains being listed will meaningfully affect gains from diversification.
For example, if her fund is named “U.S. Equity Fund,” she’ll have to obey the SEC’s naming rule and hold at least 80% of it in U.S. equities.
To be fair, claiming active share as “money available for opportunistic buying and selling” may be aggressive; asset owners might just like some of what their benchmarks own, and they might be willing to depart radically from their benchmarks should the right opportunity arise. When we look at the maximum active share of individual funds over the past five years, however, it has also drifted down. We therefore think it likely that benchmarks have become more important, despite (or perhaps due to) the rise of passive investing.
This could be offset by the ultimate asset owners being much more nimble in their allocations than they have been historically. A move from defined benefit plans (where there was some activity) to 401(k)s and Roth IRAs (where fewer than 10% of investors change their allocation or contribution mixes in any given year) suggests that this is hardly the case.
Barring a change so drastic that it causes benchmarks to add or remove a security, of course.
The rejoinder here is that prices could be volatile while holdings are persistent, so long as information shocks are equally volatile (that is, if Apple’s stock exhibits a 20% idiosyncratic price swing over a quarter, it’s because everyone received the same information that suggested Apple should be worth roughly 20% less). Though information shocks should obviously affect both prices and demand, and you can’t simply look at the volatility of holdings relative to the volatility of prices to bound elasticities; it takes genuine mental athleticism to think aggregate information swings are volatile enough to be a more likely cause of the relative stability of holdings than constraints-led inelasticity.
This is the inverse of demand elasticity.
Our assumption is that 100% of capital in U.S. equity funds goes to U.S. equities, 60% of capital in global equity funds goes to U.S. equities (consistent with the U.S. weight in MSCI ACWI), and 36% of the capital in hybrid funds goes to U.S. equities (consistent with a 60/40 global equity/bond mandate).
These statistics come from ICI’s May 2026 release on active and index investing (https://www.ici.org/research/stats/combined_active_index_0526). ICI excludes funds that invest primarily in other funds (like target-date funds, or TDFs), which modestly understates the amount of asset allocation that can occur. TDFs, however, are far from price sensitive.
See FAQ: Passive Investing (Inker and Pease 2024) for evidence.
Norway’s Government Pension Fund Global (GPFG).
We estimate this from blending the impact of a variety of quasi-exogenous flows on prices with the flow multipliers found in the academic literature.
Gabaix and Koijen (2020), the main academic reference on the topic, places the flow multiplier at ~5x.
With OpenAI’s IPO floating at ~$1.5 trillion and Anthropic’s at ~$2 trillion.