Listen to this Insight
After years of U.S. equity dominance, conditions were shifting coming into 2026. Earnings growth outside the U.S. had begun to converge, wide valuation gaps narrowed modestly, and investor interest in international equities was rebuilding. While the Iran war injected uncertainty and temporarily dampened enthusiasm for non‑U.S. stocks, the underlying setup remains intact. Developed non‑U.S. equities still trade at approximately 25-50% discounts to U.S. stocks across various valuation ratios as of 3/31/2026, 1 and the U.S. dollar remains near generational highs—conditions that historically have created fertile ground for international value leadership once risk appetite stabilizes.
That improving backdrop was already beginning to show up in investor behavior prior to the conflict. According to BofA Global Investment Strategy, capital had been flowing into international equities at a record pace, with the four‑week moving average of inflows peaking at roughly $65 billion as of late February. While the outcome of the Iran conflict is unknowable and could alter near‑term fundamentals—particularly through an adverse oil shock, to which non‑U.S. markets may be more sensitive than the U.S.—we believe non‑U.S. equities (particularly value stocks) enter this period with a larger valuation cushion to absorb negative surprises relative to U.S. markets that continue to price in far more favorable outcomes.
Not All Value Is Created Equal: Why Deep Value and Quality Matter Today
While in our view international equities appear cheap relative to the U.S., we believe deep value 2 is by far the most attractive segment, trading today at a substantially wider discount than normal.
For investors seeking to capitalize on this move, the question is not whether to add international exposure, but how. Value strategies built on simplistic and largely backward-looking metrics carry risks: low growth and value traps. GMO's seeks to overcome these challenges by employing three core principles:
- Rebuilding the Financials
Reported accounting increasingly fails to capture economic reality in a world dominated by intangible investment and aggressive buybacks. GMO constructs proprietary financial statements to better reflect true profitability and capital allocation. - Considering Growth and Quality
GMO is willing to pay a premium for profitable growth, strong balance sheets, and what we view as high‑quality businesses when valuations make sense. The discipline is valuation, not avoiding good companies. - Focusing on Where Value is Most Mispriced
Historically, across most market environments, deep value stocks have outperformed other value segments, including "shallow" value stocks (which comprise the 20–50% percentile of cheapest stocks). Today, deep value is unusually inexpensive relative to the broader market (the MSCI World ex‑U.S. universe), including other value cohorts.
A Scarce Solution for an Attractive Opportunity
According to Morningstar, there are nearly 170 Value ETFs in the U.S., but only 57 focused on non-U.S. equity markets. The opportunity set narrows further for investors seeking deep value exposure in international developed markets when filtering for:
- active management
- developed ex-U.S. market focus
- deep value (Price/Earnings <15x, Price to Book <1.5x)
- quality (Return on Equity >12%)
…the universe shrinks dramatically.
Only one ETF meets all these criteria at meaningful scale: GMO's INTERNATIONAL VALUE ETF (GMOI)
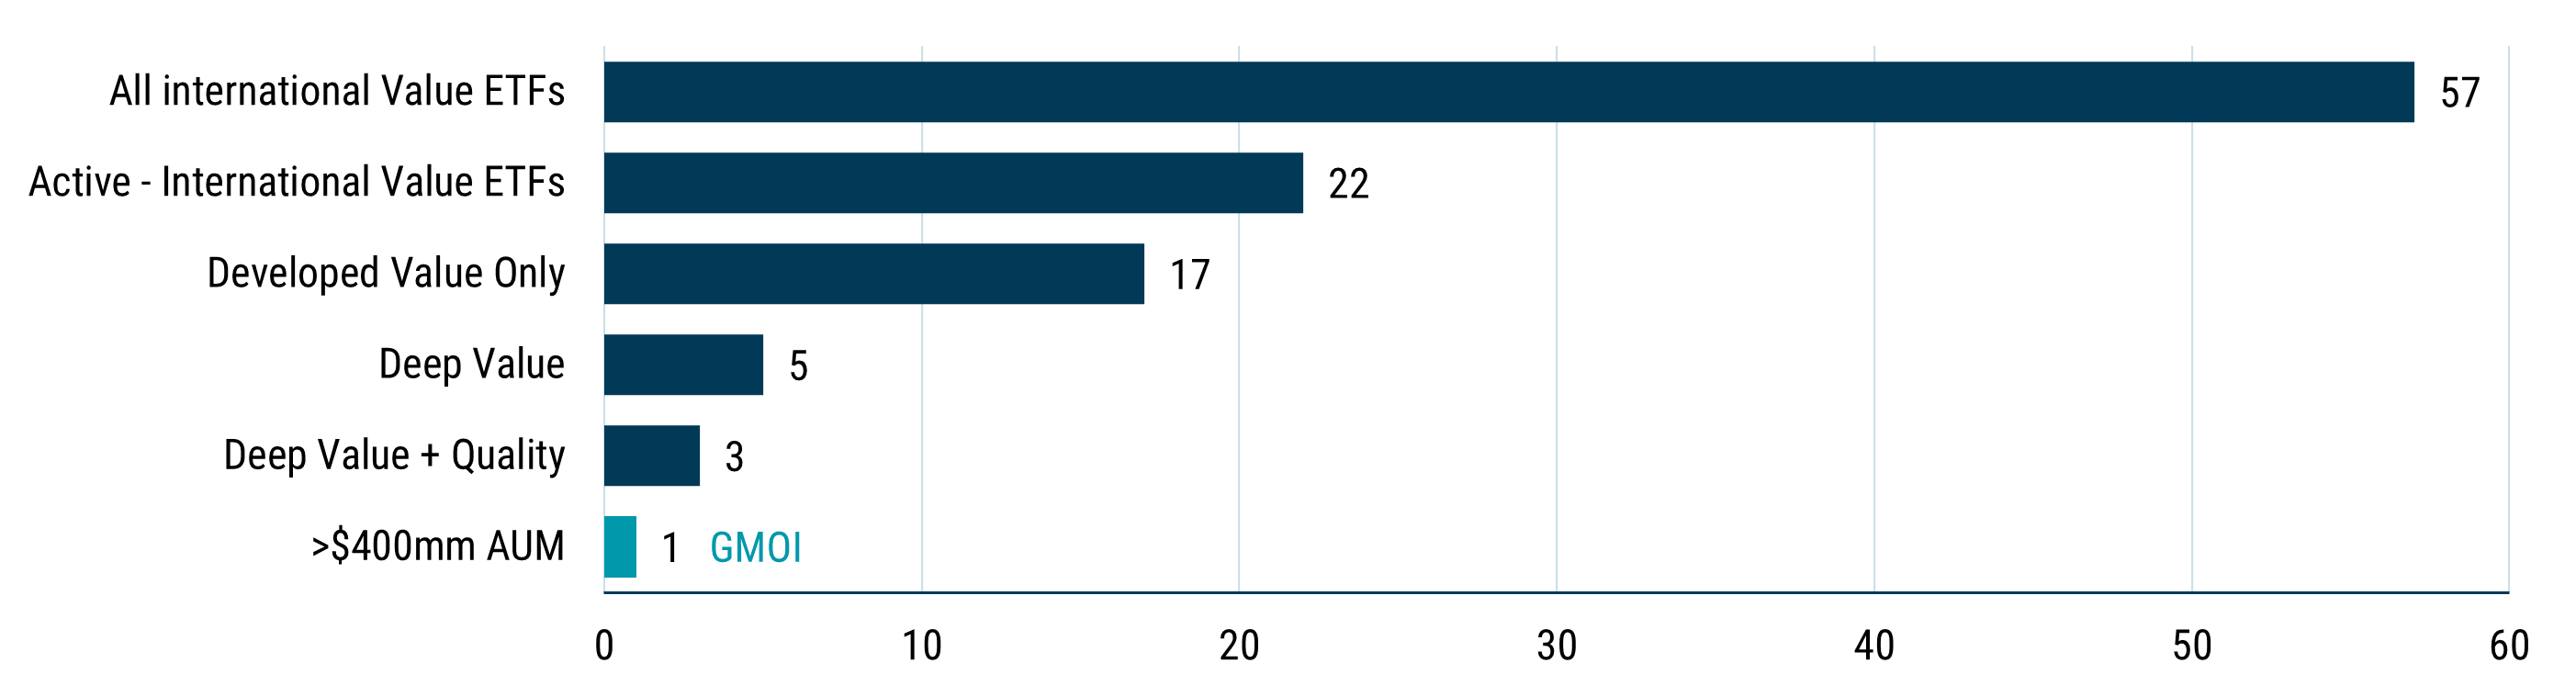
As of 12/31/2025 | Source: GMO, Morningstar, ETF Action
Deep Value defined as P/E < 15x and P/B <1.5x
Quality defined as ROE > 12%
We believe larger ETF scale can reinforce investor confidence and adoption improving liquidity and usability benefits that tend to compound as assets grow.
Past performance and is not indicative of future results.
International Value (GMOI) at a Glance
GMOI rose 62.9% (at NAV) from the end of 2024 through 4/15/2026 but continues to offer a compelling combination of value and quality. The fund holds companies across the capitalization spectrum with a weighted median market cap of more than $45 billion. Key metrics (as of 3/31/2026) include:
- Trades at 11.2x forecasted earnings
- 29% cheaper than the MSCI World ex USA Index
- 11% cheaper than the MSCI World ex USA Value Index
- Quality metrics (ROE and Debt/Equity ) near or better than the MSCI World Value index.
GMOI employs a top-down approach, concentrating in the cheapest 20% of developed non-U.S. stocks using proprietary valuation models. The objective is to identify securities that are genuinely cheap relative to fundamentals, not just superficially discounted.
The Bottom Line
We believe broad global equities are fairly to richly valued, but value and deep value equities in international markets trade at abnormally wide discounts. Traditional value approaches often confuse cheap with attractive. GMO’s approach starts with valuation discipline but refuses to abandon growth and quality.
For investors seeking developed ex‑U.S. deep value exposure that actively screens for value traps, we believe GMOI offers a differentiated solution in an active ETF.
Source: GMO, MSCI
Defined as the cheapest 20% of the MSCI World ex-U.S. Universe based stock valuations calculated on a blend of Price/Sales, Price/Gross Profit, and Price/Economic Book. Groups of value and market are then weighted by the square root of market cap.
Performance data quoted represents past performance and is not predictive of future performance. The investment return and principal value of an investment will fluctuate so that an investor’s shares, when redeemed, may be worth more or less than their original cost. Current performance data may be lower or higher than the performance data provided herein. To obtain performance information to the most recent month-end, visit www.gmo.com.
Expense Ratio of 0.60% is equal to the Fund’s Total Annual Operating Expenses set forth in the Fund’s most recent prospectus dated October 28, 2025.
The price-to-book (P/B) ratio is a financial metric that compares a company’s market value to its book value, total assets minus total liabilities.
The price-to-earnings (P/E) ratio is the proportion of a company's share price to its earnings per share (EPS).
Return on equity (ROE) is a measure of a company's financial performance. It is calculated by dividing net income by shareholders' equity.
The debt-to-equity (D/E) ratio is used to evaluate a company's financial leverage. It's calculated by dividing a company's total liabilities by its shareholder equity.
The MSCI World Index captures large and mid cap representation across Developed Markets countries. The index covers approximately 85% of the free float-adjusted market capitalization in each country.
The MSCI World Value Index captures large and mid cap securities exhibiting overall value style characteristics across Developed Markets countries. The value investment style characteristics for index construction are defined using three variables: book value to price, 12-month forward earnings to price and dividend yield.
Exchange Traded Funds (ETFs) are bought and sold through exchange trading at market price (not NAV), and are not individually redeemed from the fund. Shares may trade at a premium or discount to their NAV in the secondary market. Brokerage commissions will reduce returns. The portfolio is actively-managed, is not managed relative to a benchmark and uses an index for performance comparison purposes only and, where applicable, to compute a performance fee.
Risks associated with investing in the Fund may include: (1) Market Risk - Equities: the market price of equities may decline due to factors affecting the issuer, its industries, or the economy and equity markets generally. Declines in stock market prices generally are likely to reduce the net asset value of the Fund's shares; (2) Management and Operational Risk: the risk that GMO's investment techniques will fail to produce desired results, including annualized returns and annualized volatility; and (3) Non-U.S. Investment Risk: the market prices of many non-U.S. securities (particularly of companies tied economically to emerging countries) fluctuate more than those of U.S. securities. Many non-U.S. markets (particularly emerging markets) are less stable, smaller, less liquid, and less regulated than U.S. markets, and the cost of trading in those markets often is higher than it is in U.S. markets. For a more complete discussion of these and other risks, please consult the Fund's Prospectus.
The GMO ETF’s are distributed in the United States by Foreside Fund Services LLC. GMO and Foreside Fund Services LLC are not affiliated.
An investor should carefully consider the fund’s investment objectives, risks, charges and expenses before investing. This and other important information can be found in the fund’s prospectus. To obtain a prospectus please visit www.gmo.com. Read the prospectus or summary prospectus carefully before investing.
Disclaimer: The views expressed are the views of the Asset Allocation team through the period ending May 2026, and are subject to change at any time based on market and other conditions. This is not an offer or solicitation for the purchase or sale of any security and should not be construed as such. References to specific securities and issuers are for illustrative purposes only and are not intended to be, and should not be interpreted as, recommendations to purchase or sell such securities.
Copyright © 2026 by GMO LLC. All rights reserved.
Source: GMO, MSCI
Defined as the cheapest 20% of the MSCI World ex-U.S. Universe based stock valuations calculated on a blend of Price/Sales, Price/Gross Profit, and Price/Economic Book. Groups of value and market are then weighted by the square root of market cap.