Executive Summary
The U.S. economy faces a severe downturn, which will undoubtedly depress near-term corporate profitability. However, we on the Focused Equity team believe that longer-term concerns about corporate profit margins are overblown. We wanted to share why we remain sanguine that U.S. public companies, particularly the high-quality businesses that we invest in through our Quality Strategy, can recover and sustain their prior levels of profitability when the Covid-19 crisis passes.
Concerns about margins and profitability are not new but are especially acute as we enter a recession. In the decade following the Great Recession, the net income margin of the S&P 500 rose to all-time highs of 15%, versus a historical median of 9%, creating worries among investors that margins would naturally decline from what seem to be excessively high levels (see Exhibit 1). A decline toward historical median profit margins would cut earnings by 44%, presenting a significant headwind to future equity returns. However, we believe that the most important factors behind this margin expansion are likely to prove durable, and the simple fact of net margin expansion does not imply that margins are especially likely to fall.
Exhibit 1: S&P 5001 Net Income Margins Over Time
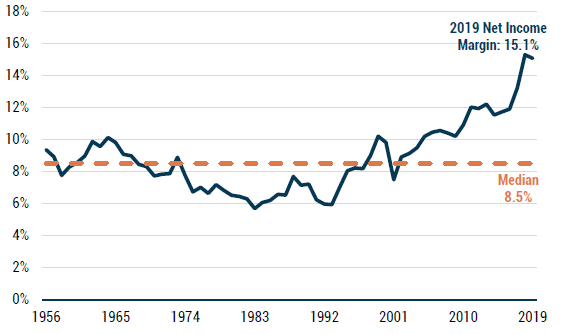
As of 3/31/2020 | Source: GMO, Worldscope
As shown in Exhibit 2, the expansion of net income margins over the last 30 years can be broken down into 3 semi-independent drivers: the expansion of EBIT margins, mostly caused by mix and composition effects; the decline in effective corporate taxes, driven by falling tax rates; and the decline in interest expense, propelled by falling interest rates. We do not see a strong argument for why these drivers should revert.
Exhibit 2: S&P 500 Margin Expansion Walk (1989-2019)
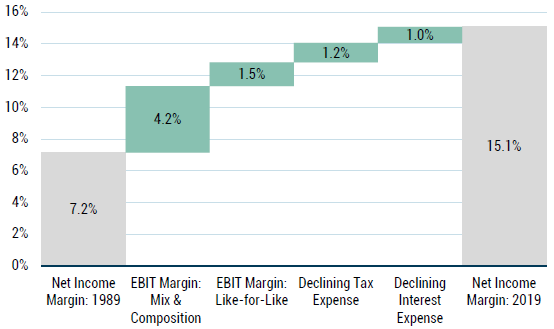
As of 3/31/2020 | Source: GMO, Worldscope
The most significant driver of net margin expansion has been the increase in corporate operating margins over time (see Exhibit 3). Since the early 1990s, operating margins have trended up, with meaningful declines only occurring during recessions. We believe that these operating margin trends have been driven primarily by changes in the composition of the index that obscure a relatively steady underlying economic reality.
Exhibit 3: S&P 500 EBIT Margins
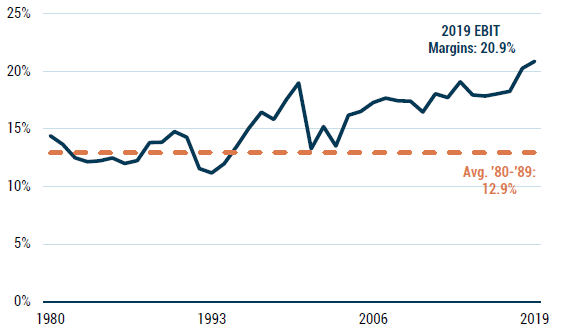
As of 3/31/2020 | Source: GMO, Worldscope
When higher operating margin companies outgrow the index, or new additions have higher margins than the index average, the margin profile of the index goes up, even if individual companies’ margins remain constant. To separate out mix effects as a driver of margin expansion, we conducted a “same-store” analysis of S&P 500 companies’ operating margins; we analyzed how the operating margins of companies with 10+ years of history in the index compared against their own historical median margins over time. On this same-store basis, there was only modest margin expansion, with just 1.5 percentage points of S&P 500 margin expansion attributable to companies expanding their own operating margins (see Exhibit 4). Thus, the majority of the expansion in operating margin has been driven by mix effects: new additions to the index have come in at margins well above the index average over time, and higher growth of higher-margin companies has also had a significant impact.
Exhibit 4: S&P 500 “Same-Store” EBIT Margin Index
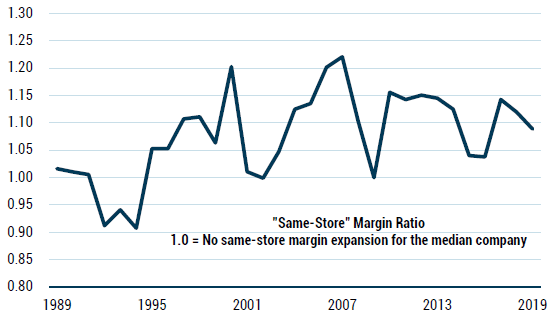
As of 3/31/2020 | Source: GMO, Worldscope
We would worry about companies taking up their margins significantly on a like-for-like basis, as that would imply risk of reversion from factors like under-investment, price taking, or other monopolistic behavior vulnerable to an anti-trust response or potential future competition. Mix effects, however, have no such risk: different sectors of the economy have always operated with different margin structures due to varying degrees of competitiveness, riskiness, capital intensity, accounting rules, and other factors. Unless there is a reason to believe that the mix shifts driving S&P 500 margin expansion will unwind, the mix-driven portion of the margin expansion should prove durable, and may well continue over time, as high-margin/high-growth sectors like the technology industry continue to outpace the index.
There is an additional subtlety to interpreting operating margin levels and expansion: operating margins inconsistently measure the proportion of value in a transaction that companies keep as profit. For many of the current and potential investments in our Quality Strategy, the types of revenues our companies earn often represent just a small portion of the economic value they generate, which leads to structurally high and stable operating margins.
Many of the companies we analyze facilitate economic transactions, but unlike a traditional retailer or manufacturer, book only small portions of the associated economic transaction as revenue. Coca-Cola, for instance, is effectively a franchisor to local bottlers, who generate considerably greater levels of sales than what Coca-Cola recognizes as revenue. When Coca-Cola began acquiring bottlers in 2010, it booked much more revenue at a much lower margin until it reversed course, with significant bottler divestitures beginning in late 2016. Or, consider Amazon: in 1999, 3% of its gross merchandise sales came from third-party merchants (3P), with 97% coming from its own inventories (1P). In 2018, 58% of gross merchandise sales came from 3P sales.2 The economic substance of 1P and 3P transactions is similar – Amazon facilitates the transfer of a product to a consumer for a markup or a fee – but the revenue booked on a 3P transaction is just Amazon’s commission, a fraction of the full gross merchandise sale value it would book as revenue had the transaction been 1P. Thus, without Amazon’s characteristic reinvestment of profit into new initiatives, its reported margin would increase while its margin against gross merchandise sales would remain largely unchanged.
Exhibit 5: Coca-Cola Adjusted EBIT Margins
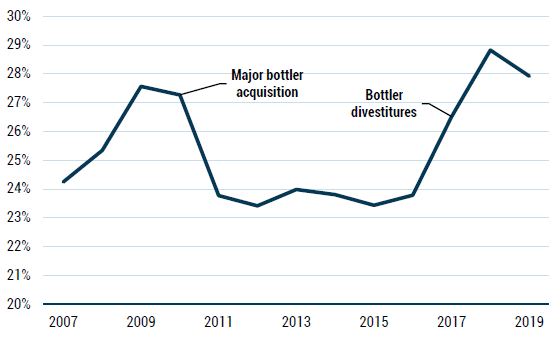
Source: GMO, company filings and press releases
When we look across the most successful companies today, we see numerous cases in which reported margins are elevated according to how accounting rules assess the revenue component of an economic transaction: Walmart, for instance, is growing its 3P online “marketplace” sales; Apple is taking commissions on app store sales; and UnitedHealth Group is administering self-insured plans, with no premiums.
The best companies often take only a small portion of the economic value they create as revenue, creating powerful pricing umbrellas and defensive earnings. In our Quality Strategy, we hold many companies that fit this description: over one-third of the portfolio consists of companies that earn significant revenues that understate the economic value they facilitate; this is one of the factors that gives us confidence that these companies can maintain outsized margins over time (see Exhibit 6).
Exhibit 6: Quality Strategy Holdings
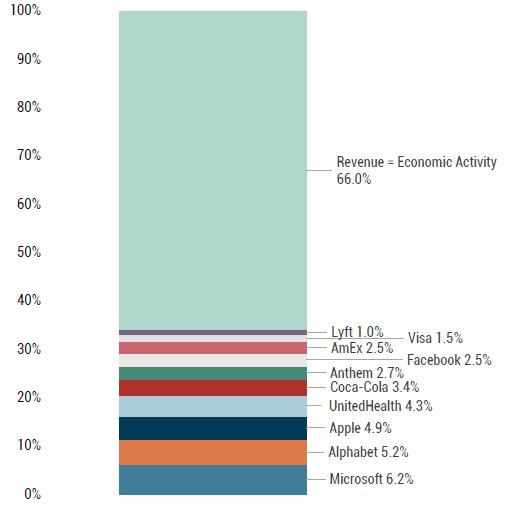
As of 3/31/2020 | Source: GMO
The above information is based on a representative account in the Strategy selected because it has the fewest restrictions and best represents the implementation of the Strategy.
While operating margin expansion has been the largest driver of net income margin expansion, tax and interest expense have also been significant contributors. They, too, are not obviously primed to revert to prior levels.
As Exhibit 7 shows, across the developed world corporate tax rates have been falling for decades, due to tax cuts, globalization, and changes in industry mix. There have been multiple cuts to U.S. corporate tax rates since the 1980s, with the statutory rate significantly reduced during the Reagan and Trump administrations. Subtler reductions in corporate taxes, such as acceleration of depreciation, have also steadily pushed down effective tax rates, and have been passed under both Democratic and Republican administrations. Even Joe Biden, who is campaigning on a central idea of rewinding time back to the Obama administration, is proposing to unwind only half of the 2017 statutory tax rate cuts. The economic logic behind these cuts is clear: in addition to implicitly penalizing saving and investment, corporate income taxes have unclear tax incidence and encourage significant distortions of economic activity to reduce the tax burden, while potentially making the taxing nation a less attractive place to invest and do business. Ergo, it seems more likely than not that statutory tax rates will fall while tax deductions continue to rise.
Exhibit 7: Effective Tax Rates Over Time
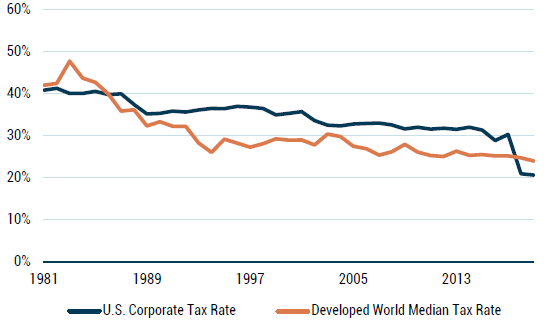
As of 3/31/2020 | Source: GMO, Worldscope
Globalization has created further opportunities for companies to reduce their taxes. As countries compete to attract corporate investment and revenue, it should be no surprise that there is a global race to the bottom with respect to countries’ corporate tax rates. Beyond falling tax rates, economic logic implies corporate profit and investment will shift, on a real or accounting basis, to lower-tax regimes: while the specific regulations and loopholes may change over time, creative tax accountants and lawyers will continue to find ways to allocate taxable profit to the lowest-tax countries, steadily reducing the tax burden on multinational corporations. Though there is always the possibility that a renewed political focus on corporate profits could lead to higher taxes, we note that populist and anti-corporate sentiment did not lead to tax rate hikes even in the aftermath of the 2008 financial crisis. Thus, the economic and political drivers of falling corporate tax rates remain intact, and we believe a steady-or-declining effective corporate tax rate for the S&P 500, in aggregate, is more likely than not for the foreseeable future.
Treasury yields have been declining for almost 40 years (see Exhibit 8), and this has been the primary driver of declining net interest expense against sales over time, as leverage levels against sales have held relatively stable since the late 1980s. Rates could rise or fall – we are agnostic to their trajectory from here – but we do not assume that this relatively small driver of margin expansion will necessarily prove to be a headwind going forward.
Exhibit 8: S&P 500 Net Interest Rate and 10-Year Treasury Yield
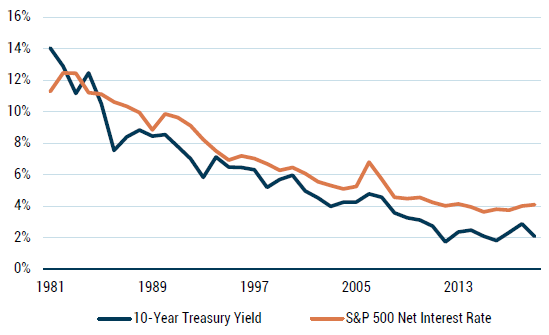
As of 3/31/2020 | Source: GMO, Bloomberg
Make no mistake: the challenges of Covid-19 will undoubtedly pressure the profits of almost all companies, even those in the highest-quality businesses. But on the other side of this crisis, we believe we will see a strong recovery in profitability, and attractive returns for our investments.
Download article here.