Executive Summary
It is commonly assumed that growth stocks are bigger beneficiaries of falling interest rates than value stocks, an assumption driven by a belief that growth stocks are much longer “duration” than value stocks due to the fact that more value in growth companies comes from relatively more distant cash flows. While it is true that value stocks do generally offer higher current income than growth stocks, a focus on this aspect gives a false idea of how returns are generated in both investing styles. A more comprehensive analysis of the drivers of return for the value and growth styles of investing shows that their durations are much closer than most investors realize. Given the wide discount at which value stocks are currently trading globally, we expect value to continue to outperform the market over the next few years, but that belief neither assumes nor requires any particular moves in interest rates.
Over the last few weeks, we have seen a rise in bond yields alongside an outperformance in global value stocks relative to growth stocks. While we at GMO have certainly been happy to see some recovery in value stocks (and we are confident that this recovery has much further to run), the moves have only reinforced a narrative that has been gaining ground in recent years – that value stocks are a “shorter duration” asset than growth stocks and should naturally outperform whenever interest rates are rising and underperform when they fall. This narrative is a tempting one, as it both matches with the pattern of performance for value and growth stocks in recent years and comports with a simple model of how returns are generated. However, the narrative is flawed because the simple model of value and growth stocks that it portrays is too simple and is missing a key driver of returns. Neither value nor growth indices hold a constant set of securities through time, and this inherent turnover (“rebalancing”) has profound effects on the returns they deliver over time. This turnover pulls the effective duration of value and growth stocks quite close together. It also explains why, in the long run, growth stocks wind up generating much lower returns than the combination of their growth and income imply. The prevalence of the duration narrative in the financial world and the fact that value stocks are probably somewhat more cyclical than growth stocks at the moment mean that the correlation between value stocks and bond yields may well continue for some time to come. But as it turns out, there is little truth to the argument that a value-driven equity portfolio is a materially shorter duration investment than a growth-driven one. Given the wide discount at which value stocks are currently trading globally, we expect value to continue to outperform the market over the next few years, but that belief neither assumes nor requires any particular moves in interest rates.
The Correlation Between Bond Yields and Value
It is not an illusion that the performance of value versus growth has been correlated with bond yield moves in recent years, although it is easy to overestimate the magnitude of the effect. In the three years ending February 2021, the correlation between monthly changes in the 10-Year Treasury Note yield and the performance of the Russell 1000 Value versus Growth has been +0.28. Taking a longer perspective shows that this has not been a particularly consistent pattern over time though, as we can see in Exhibit 1. The varying correlation of value’s relative performance means that value does not simply win when rates rise and lose when they fall despite the narrative of late.
EXHIBIT 1: 36-MONTH CORRELATION BETWEEN BOND YIELD CHANGES AND VALUE VS GROWTH RETURNS
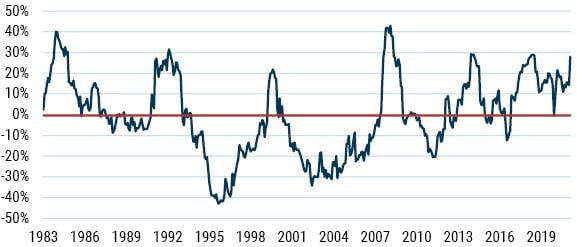
As of 2/28/2021 |Source: Russell Investments, Federal Reserve
Correlation is between monthly yield change on 10-Year constant maturity Treasury Note and the monthly return of Russell 1000 Value less Russell 1000 Growth.
Since 1983, the average correlation between the two series has been -0.003. In the period of Value’s struggles since 2007, it has been somewhat higher at about +0.1, but still nothing all that striking. Today’s correlation is one of the higher datapoints we have seen over the last 30 years, though, and narratives have a certain amount of staying power, so I would not be at all surprised to see the correlation remain meaningfully positive in the coming months. But as history shows, value stocks have not had a notably different sensitivity to interest rates than growth stocks in the longer run, and economically there isn’t a compelling reason why they should.
Components of Return for Stock Investing
The basic concept of thinking about the duration of stocks is a reasonable one, with the minor twist that one should use a real discount rate, not a nominal one.1 A stock is indeed worth the present value of the cash flows it will deliver. Because some of those cash flows will not be received for years, that present value really is quite sensitive to changes in the discount rate applied to them. As my colleague John Pease writes in the appendix to this piece, different assumptions can give you quite different answers as to just what the duration of stocks is, but for most reasonable assumptions it is pretty long duration by fixed income standards. But once we move from thinking about the overall stock market to thinking about a style of stock investing, life gets more complicated because the drivers of return are more complicated as well.
Actually, even in the case of an investment in the “stock market,” there is still some nuance to the drivers of stock returns that is not entirely intuitive. Exhibit 2 shows the components of return for an investment in the S&P 500 since 1983.
EXHIBIT 2: S&P 500 COMPONENTS OF REAL RETURN
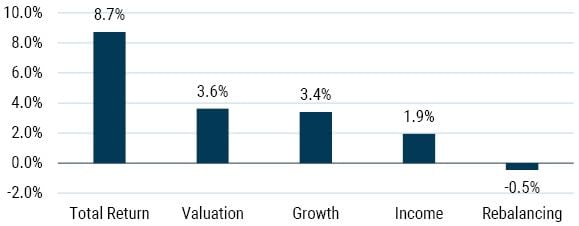
Data from 1983-2020 | Source: Standard & Poor’s, Compustat, GMO
The real return to the S&P 500 has been a very healthy 8.7% above inflation over the past 38 years. Looking under the surface, the most important drivers of this return were growth, income, and valuation shift, all of which had a positive impact on total returns. Valuation shift represents the +3.6% return investors achieved by the end of 2020 because the S&P 500 traded at a higher valuation than it did at the end of 1982. While this was the single largest driver of return over this period, it is not one that can be logically counted on going forward. Leaving aside the question of whether today’s stock market valuation is a fair one, positive returns from valuation shift in the long run requires ever-rising valuations. That’s close to an economic impossibility in a world where new equity can be issued at will by companies. The higher the price afforded to equity, the greater the incentive to create it, as the recent SPAC mania has demonstrated. Growth and income, on the other hand are two long-term sustainable major sources of return for the stock market, and we would expect them both to be materially positive in any long period of time. In this period, real growth added +3.4% to returns. Income, which for this purpose is inclusive of both stock buybacks and stock issuance alongside dividend payments, chipped in +1.9%. These three were the major components of return for the S&P 500 over this period, but they are not actually the only ones. There is also a fourth, represented by the bar labeled “Rebalancing,” which I referenced earlier. This component reflects the impact of companies that have entered or exited the S&P 500 over the years. For the period, it posted a negative return, costing investors -0.5% per year on average. This negative effect is the consequence of companies entering the S&P 500 with higher valuations than those that have left. It is easy to think of an investment in the S&P 500 as a buy-and-hold investment, but it is not, and the inevitable shuffling caused by rebalancing tends to make the index more expensive.2
Components of Return for Style Investing
For value and growth as styles, turnover of the stocks held is much higher and the rebalancing impact is a much more important component of returns. Exhibit 3 shows the components of return for the cheap half of the S&P 500 on a composite value measure.3
EXHIBIT 3: CHEAP HALF OF S&P 500 ON GMO COMPOSITE VALUE MEASURE
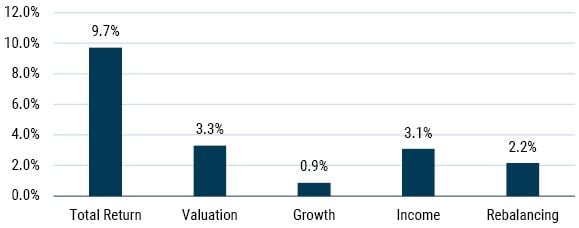
Data from 1983-2020 | Source: Standard & Poor’s, Compustat, GMO
This breakdown of returns shows the not very surprising result that value stocks have both higher income and lower growth than the market. However, it may seem surprising that the combination of income and growth for the value group was significantly less than that for the S&P 500, even though value outperformed over this period. The S&P 500 achieved a return from growth and income of +5.3% real, whereas those two components delivered only +4.1% for the cheap half. The upward push from rising valuations was less than for the S&P 500 at +3.3%, as value traded at a larger discount to the market by the end of 2020 than it did beginning in 1983. But the rebalancing effect that was a minor negative for the S&P 500 was a large positive for value, adding +2.2% per year. There are actually a number of different ways that companies enter or leave the value half of the S&P 500. A few of them cost value investors money, but the biggest effect is that when a value stock comes back into favor with investors and sees its valuation rise, it both outperforms and enters into the growth universe, which results in a positive impact on returns that does not impact the valuation of the remaining value group.4 In an average year, about 8-9% of the cheap half of the S&P 500 “graduates” to the expensive half, so the impact of this mechanism really adds up.
If we look at the equivalent components of return for the growth half of the S&P 500 in Exhibit 4, we see very different drivers of returns.
EXHIBIT 4: EXPENSIVE HALF OF S&P 500 ON GMO COMPOSITE VALUE MEASURE
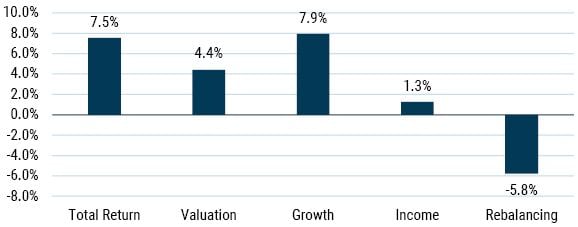
Data from 1983-2020 | Source: Standard & Poor’s, Compustat, GMO
Growth stocks over this period gave less income than the market at +1.3% annualized. But they more than made up for that with strong fundamental growth of +7.9%. The market did indeed correctly diagnose that the expensive half of the market would grow significantly faster than the market as a whole. But the returns to growth stocks were much less than the combination of growth and income would imply because the rebalancing effect that accrued so positively for value was a large negative for growth at -5.8%. As growth is the other side of the coin from value, it is not a surprise that the rebalancing effect is negative in that group, but just how negative is striking. As with value, there are multiple ways that growth stocks enter and leave the growth universe. The single biggest driver is the fact that a growth stock becoming a value stock tends to suffer a strongly negative return, but the other reasons for stocks entering and leaving the growth universe are also materially negative for returns.5 This negative rebalancing effect is not a consequence of the market being inefficient or growth investors being inherently mistake-prone. It is rather part and parcel of how the growth index is formed.6
Rebalancing and Changing Market Valuations
What does this all mean for the relative duration argument for value and growth stocks? If we look purely at the income component of returns, that duration argument seems to make sense. Income is a much larger piece of the total return for value stocks than it is for growth stocks. If the stock market valuation were to double relative to its historical average, the loss of income for value stocks would be much larger than for growth. If that were all there was to it, value stocks would indeed see their valuations rise far less than growth stocks if the required return to stocks were to fall considerably. But that is absolutely not all there is to value and growth investing, and the rebalancing effect largely counteracts the income effect.
Let’s take an extreme case where the new equilibrium valuation for the S&P 500 is an earnings yield of half the average level since 1983 and payout ratios remained unchanged. Such a shift would require the equilibrium return to stocks to fall by half, which would make it a decidedly mixed blessing for investors and is a more extreme scenario than we can imagine persisting in the long term.7 But for our purposes here, the extreme nature of the shift helps to demonstrate how relatively minor the “duration” effect should be on value stocks relative to growth stocks.
A doubling of the market valuation and a stable payout ratio obviously implies the return from income (detailed in Exhibits 2 and 3) falling by -50%, as we can see in Exhibit 5.
EXHIBIT 5: INCOME LOSS FROM A DOUBLING OF EQUILIBRIUM MARKET P/E
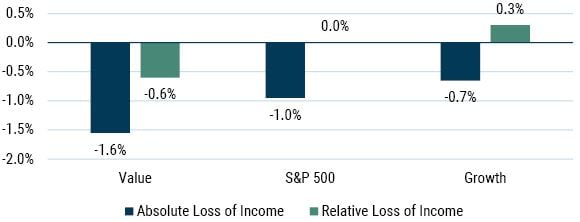
Data from 1983-2020 | Source: Standard & Poor’s, Compustat, GMO
Because value stocks generate more of their returns from income than other stocks do, the rise in overall valuations is a problem for them. The income from value stocks falls by 1.6%, 0.6% worse than for the S&P 500 as a whole. Growth stocks, by contrast, “gain” 0.3% relative to the market as income has always been a smaller part of their return. So, what needs to happen if we insist that value stocks give the same return premium versus the market at these higher valuations as they did when the market was cheaper? If income were the only way that value achieved its premium, the discount of value stocks would have to become much larger. Since 1983, the average valuation discount of value stocks has been 23%. In order to generate an extra 0.6% yield relative to the market, value stocks would have to move to a 44% discount. That is indeed a drastic change in their relative valuations and would mean that while the market doubled, they rose only 45%. That would imply that value stocks have less than half the duration of the market. But let’s see what would happen to the rebalancing effect if that were to occur. The rebalancing effect is a function of the frequency that value stocks move in relation to growth stocks and the relative valuation change when that occurs. When value traded at a 23% discount to the market, it resulted in a 2.2% per year positive effect. At a 44% discount to the market, the rebalancing effect would rise to 6.1% per year!8 The overall outperformance of value, instead of being stable at +1% annually would rise to +4.3% per year. While this would be a real boon to value managers, I cannot fathom how that situation would be allowed to persist. If we wanted to see the same relative performance for value stocks at the higher valuation for the market as we have seen since 1983, we would need the rebalancing effect to rise by 0.6% to counteract the fall in relative income. This would require the discount for value to rise from 23% to 27%. While that is not entirely immaterial, the doubling of the market valuation would imply a gain for value stocks of 92%.
The basic math for growth stocks is, of course, the reverse. While their duration is slightly longer than the market's, it is not much longer, because no growth stock remains a growth stock forever. The growth stocks that wind up disappointing the market see their valuations fall, and that underperformance grows quickly as the premium at which growth stocks trade widens. If growth stocks were to see their valuation premium widen more than a few percentage points as the overall market valuation rose, the negative rebalancing effect from those companies that disappoint investors would drag overall returns down far below that of the overall market.
Conclusion
The pattern of market movements since the start of the pandemic has tended to reinforce the narrative that value stocks are a “short duration” version of equities that outperform when bond yields rise and underperform when they fall. In the long run, however, value stocks have not shown much correlation to movements in the bond market. Given the drivers of return for value as an investment style, you could make the argument that value should have a slightly shorter duration than the overall stock market and growth stocks a slightly longer one. But the difference between them is small enough as to easily disappear in the noise of the market and cannot possibly explain the performance of value and growth stocks over the past few years. There may be other reasons to believe value stocks at present are more correlated to economic growth than growth stocks, and that correlation might well persist for a while. But neither history nor economics suggest that there is anything permanent or inevitable about there being a meaningful correlation between the performance of value stocks versus the market and shifts in bond yields. We do strongly believe that value stocks are trading at too wide a discount to the market at present. Should that discount contract as we have seen in past episodes of growth bubbles, value should outperform by a large amount over the next several years. A changing interest rate environment that causes a change to the prevailing narrative around asset prices is as good a candidate for a catalyst for that move as any, but a value recovery does not in any meaningful economic sense require a change in interest rates. And speaking on behalf of value managers, even staying at the current wide discount for value works out quite nicely for the expected returns to value as an investing style. Today’s wide spreads imply a larger than historical rebalancing effect in favor of value and against growth. That should be enough to provide a meaningful value tailwind if valuation spreads do not narrow from today’s levels.
Appendix
The Duration of Stocks
By John Pease | March 2021
In the 1938-39 biennium, two scholars of very different stripes and in very different contexts almost simultaneously introduced the concept of duration. First among them was Frederick Macaulay, who coined the term duration in describing the weighted maturity of a bond while he wrote a tome on the behavior of bond and stock prices. On the other side of the Atlantic and only a year later, Sir John Hicks – one of the foremost economists of the twentieth century – published Value and Capital, his magnum opus. Among its numerous contributions to microeconomic theory, V&C explored how sensitive the “capital value of a stream of payments” is to a change in discount rates, unknowingly generalizing Macaulay’s concept of duration to any arbitrary asset with some underlying cash flow stream.9
Hicks’ formulation of duration translates easily to equities. Even with cash flows that go out indefinitely, the sensitivity of the capital value of a stream of payments [read: price] to a change in discount rates can be easily derived for the equity market so long as we are willing to make a few simplifying assumptions. We show below that for a constant discount rate and a stable growth rate, the theoretical duration of the equity market tends to live somewhere between the market’s price-to-earnings and its price-to-dividend ratio, with the former – to our minds – laying the better claim.10
Let’s start with the simple case where changes to discount rates are completely unrelated to changes in growth rates. In such an environment, a drop in the required rate of return propels the value of all cash flows with no offsetting changes to the cashflows themselves, leading to a percentage boost in prices proportional to the P/D ratio.

While theoretically possible, it seems unlikely that the required rate of return on equities would suffer a uniform drop across all maturities with no change in growth expectations for the aggregate equity market. After all, any such drop in the cost of capital would be symptomatic of the supply of savings far outstripping the demand for investment – today and in future – an economic phenomenon that would likewise be leading growth expectations to fall.11 This is precisely why we in Asset Allocation assume that the equity market’s return on capital will be lower in states of nature where the real rate – and therefore the equity cost of capital – has shifted down for good.
If we recognize that changes in the discount rate and changes in return on capital go together, the duration of the equity market reads lower. A decrease in the discount applied to future cash flows will be somewhat offset by altogether lower cash flows, muting prices’ sensitivity to discount rate fluctuations. In the particular case where the return on capital and cost of capital co-move perfectly, the percentage change in prices will be proportional not to the P/D ratio, but to the market’s P/E. To see this, we first show that when the return on capital and cost of capital are equal, the P/E is the reciprocal of the discount rate,12 and we then derive the market’s duration.

In a world where real rates have collapsed, the equity market’s duration is often used as a justification for the high multiples at which stocks currently trade. The extent to which the market should appreciate in response to lower rates depends, fundamentally, on what has happened in tandem to the market’s growth prospects. If growth has been unaffected by the forces that have pushed down discount rates (or by the lower discount rates themselves), then the market’s duration is roughly its dividend multiple and its fair value is quite high. We find it more likely that the economic phenomena behind the decline in discount rates have likewise reduced return on capital and, as a result, brought down growth. The duration of broad equities, should we be correct, is likely more in line with the market’s P/E ratio, and its “fair value” – even in a low discount rate world – is probably not as high as first inspection would suggest.
Download article here.