There aren’t many laws of investing, but our favorite candidate – let’s call it the Munger Law – is that as you lengthen your holding period, your total return as a stock investor tends to approach the fundamental return of the underlying business in which you are invested. Investors in equity strategies with low turnover and longer holding periods ignore this at their peril – it is an important element in the thinking behind the GMO Quality Strategy.
We launched the Quality Strategy in 2004, harnessing a blend of fundamental and quantitative techniques. The current iteration, which places a greater emphasis on fundamental analysis, reached the 10-year mark at the end of June. This milestone seemed to us like a good moment to reflect on a key aspect of our Quality Strategy: hitching a ride on the strong fundamentals of strong businesses. 1 A decade, after all, should be long enough to reveal how those fundamentals can drive outcomes in a lower-turnover approach to investing.
The total returns achieved by an investor in a company – let’s call it QualCo – can be separated into two components: fundamental return and valuation change. The fundamental return is an outcome of QualCo management’s execution and the context of the business and can be measured via earnings per share growth and dividends received. The valuation change is largely externally imposed and reflects shifts in how the market views QualCo’s prospects.
EXHIBIT 1: GMO QUALITY STRATEGY – 10 YEARS OF RETURNS
Total Return vs. Fundamental Return
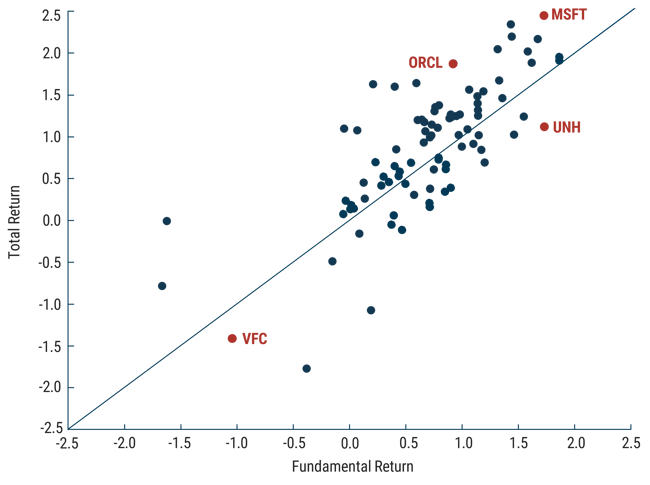
Natural log scale, holdings at 6/30/2015; returns through 6/30/2025 | Source: GMO
The above information is based on a representative account in the strategy selected because it has the fewest restrictions and best represents the implementation of the strategy.
Exhibit 1 shows how the fundamental return piece has contributed to individual stock returns over the last decade. The study looks at all positions in the Quality Strategy a decade ago (the QualCos of 2015, if you will). At opposite ends, we have Microsoft and VF Corporation. While Microsoft generated fundamental returns of around 450%, VF Corporation’s were around -66%, for a cumulative differential of a little over 10x. Over the decade, no plausible degree of revaluation could have closed the total return gap between these two names. The pull of fundamental returns became inexorable.
Although the relationship between fundamental returns and total returns after a decade is solid, valuations do matter – their impact is evident in the vertical distance between each stock observation and the diagonal line on the chart. It may surprise you to learn that UnitedHealth Group has generated a similar fundamental return to Microsoft over the last decade. It may also surprise you to learn that a decade ago, the two stocks sported very similar price-to-earnings multiples in the teens. UnitedHealth’s multiple has tended to be limited by regulatory uncertainty, while in 2015, the jury was still out on whether Satya Nadella could bring Microsoft back to life. In 2025, UnitedHealth is the one undergoing a reboot and has seen valuations shrink while the prospects for Microsoft continue to dazzle. The total return gap between the two has therefore been significant (though VF Corporation lags the pair by a huge margin for reasons we already articulated).
Oracle offers another angle. With fundamental returns well below those of either Microsoft or UnitedHealth, it has generated a total return between the two. In 2015, Oracle traded on a low multiple. It was a business advantaged by intellectual property and high switching costs, but one that was struggling to generate growth. Well, that struggle seems to have well and truly ended – valuations have jumped recently in response to a new phase of growth, and the biggest problem facing Oracle’s management now is how to fund the enormous opportunities associated with its AI-ready cloud infrastructure.
Why does the fundamental return dominate as the holding period lengthens? Because valuations are (kind of) bounded, whereas fundamental returns are (sort of) unbounded. This means they relate to time differently.
Let’s say that the market is moderately efficient and QualCo’s stock is somewhere between 30% undervalued and 30% overvalued at all times. If QualCo’s stock were to swing from the bottom to the top of that range in a year, that would imply an 86% contribution from valuation change (1.3/0.7-1). However, as we extend the time frame, the maximum annualized impact of movement within that range falls because the limits don’t change. Over five years, it’s 13% per annum, and after a decade, it’s 6% per annum. That’s not nothing, but it is the maximum possible impact of valuation over a decade in our example. You can see the direction of travel in Exhibit 2. 2
EXHIBIT 2: MAXIMUM IMPACT OF QUALCO’S VALUATION CHANGE OVER TIME
Assuming stock is never more than 30% over- or undervalued
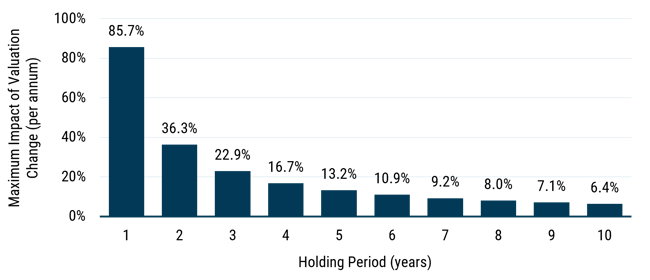
Source: GMO
By contrast, the fundamental return contribution can build quite a head of steam over a decade. Looking at our data, the S&P 500’s 90th percentile fundamental return since mid-2015 was 19.2 percentage points per annum above the 10th percentile, and 9.4 percentage points ahead of the median. This decade was not unusual; we see very similar results looking at 10-year periods since 1995.
So what? Well, if QualCo – by virtue of its competitive industry positioning and unimpeachable capital allocation – delivers top-decile fundamental returns, that is likely to matter more to your total return over a decade than its change in valuation. 3
Exhibit 3 returns to the empirical data and shows the total and fundamental returns again, this time unveiling the tickers and indicating how long each position was retained in the portfolio. While some of our mid-2015 holdings delivered disappointing fundamental returns, we are relieved to note that our fundamental work ruled out most (but not all) of the worst offenders before too much damage was done.
EXHIBIT 3: GMO QUALITY STRATEGY – 10 YEARS OF RETURNS
Total Return vs. Fundamental Return
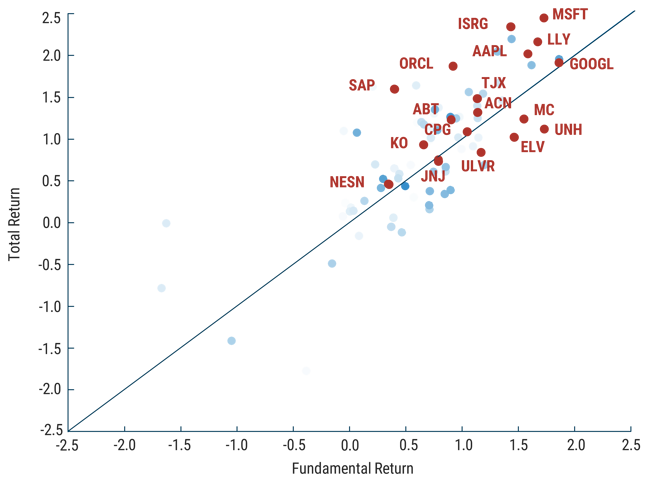
Natural log scale, holdings at 6/30/2015; returns through 6/30/2025 | Source: GMO
The above information is based on a representative account in the strategy selected because it has the fewest restrictions and best represents the implementation of the strategy.
Shading is proportional to holding period post-2015. Stocks we continue to hold in the portfolio today are shown in red.
Most of the stocks that we held for the duration, shown in red, delivered respectable fundamental returns (skewed to the right-hand side of the page), and happily, there was a greater proportion of positions finishing above the line (i.e., getting a positive contribution from changing valuation). Our Quality Strategy is a relatively low turnover affair, but we do try to initiate positions when they are trading at reasonable or better valuations, and we rebalance away from stocks where we judge valuations to be too high. Thus, the positive result from valuation change was, at the very least, the product of good intentions.
In short, fundamental returns mattered over the last decade. Of course, we care more about the coming decade than the last and will allocate capital with the same focus on long-term fundamental returns from here. That’s easy to say, but as we write in September 2025, the specter of uncertainty takes many forms. Markets are buffeted by a whole gamut of geopolitics from “jaw-jaw” to “war-war.” Saber-rattling on the U.S. domestic front has shaken confidence in regulated areas such as healthcare and clean energy. At the same time, transformative new technology has the potential to upend some proportion of economic activity. Quality remains our polestar because when the dust settles, competitively advantaged, relevant businesses run by disciplined management teams tend to generate stronger fundamental returns over time.
We define a high-quality company in terms of competitive advantage, relevance of business model, and capital discipline.
By 20 years, the maximum is 3%. And the average relative valuation impact for all stocks is zero by definition, whereas the average fundamental return for stocks must be close to the long-term return for equities (5-6% ahead of inflation).
Assuming our imagined level of market efficiency is approximately right.
Disclaimer: The views expressed are the views of the Focused Equity team through the period ending September 2025 and are subject to change at any time based on market and other conditions. This is not an offer or solicitation for the purchase or sale of any security and should not be construed as such. References to specific securities and issuers are for illustrative purposes only and are not intended to be, and should not be interpreted as, recommendations to purchase or sell such securities
Copyright © 2025 by GMO LLC. All rights reserved.
We define a high-quality company in terms of competitive advantage, relevance of business model, and capital discipline.
By 20 years, the maximum is 3%. And the average relative valuation impact for all stocks is zero by definition, whereas the average fundamental return for stocks must be close to the long-term return for equities (5-6% ahead of inflation).
Assuming our imagined level of market efficiency is approximately right.