Executive Summary
J.P. Morgan, benchmark provider for the GBI-EM series of local debt benchmarks, has begun the long-awaited phased inclusion of Chinese local government bonds into the GBI-EMGD benchmark. This is a very significant development for the asset class. By November 2020, the China subindex weight will reach the capped 10% of the benchmark, lowering the average pro forma yield by 26 bps, with a largely unchanged duration and credit quality. In this paper, we discuss what this means for our local debt portfolios. In terms of asset class valuations, China’s inclusion makes them less attractive. In terms of prospects for alpha, we believe duration positioning in Chinese interest rates poses the biggest challenge, in contrast with FX and sovereign/quasi sovereign credit, which is “business as usual,” as we have been including China in these processes for some time. Overall, we remain confident that our differentiated process can continue to generate sustainable returns in excess of the new benchmark.
Introduction
J.P. Morgan is the second bond benchmark provider after Bloomberg/Barclays to include Chinese local bonds in its flagship indices. The FTSE Russell WGBI (formerly Citi WGBI) has so far held out, citing continued access and hedging availability issues. Given the enormous size of the market (China will be 10% of the GBI-EMGD) and its idiosyncratic issues (both in a “developed markets”/reserve currency sense as well as an “emerging markets” one), in this paper we address how we will adapt our alpha processes in anticipation of this change.
In terms of the evolution of the benchmark, Table 1 shows the pro forma of the GBI-EMGD at the November 30 full inclusion date. Only nine Chinese bonds will enter, issues J.P. Morgan deems the “most liquid.” On average, they yield 2.9% and have a duration of 5.6. China will squeeze out other, smaller issuers, some of which have higher yields (South Africa, Russia, Turkey, for example) and others with lower yields (Czech Republic, Poland, Hungary, Thailand), most of which are in Europe. Net-net, the overall index yield is projected to fall by 26 bps on a pro forma basis. The duration will remain around the same at 5.5, and the credit quality will also remain unchanged at BBB/BBB/BBB (Moody’s/S&P/Fitch).
Table 1: Estimated Changes in Characteristics of GBIEM-GD with China inclusion as of 11/30/20
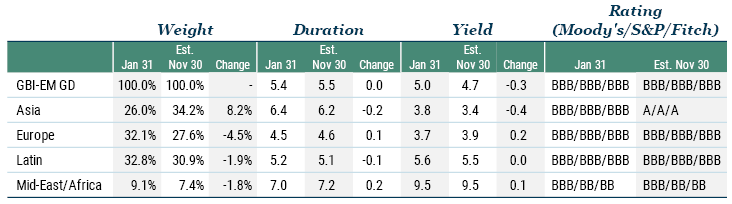
Source: J.P. Morgan
Before getting to China’s alpha potential, let’s consider how its inclusion will affect overall valuations in the asset class. Exhibits 1 and 2, taken from our Emerging Debt Quarterly Valuation Update,1 show China pro forma at 10% weight in our local debt valuation metrics. Exhibit 1 shows the GBI-EMGD weighted FX expected spot return framework applied across our FX universe. Unfortunately, due to our model’s view that CNY is overvalued, were it included today at 10% weight, it would shift the weighted-average GBI-EMGD benchmark metric from very close to our “attractive” threshold to the top of the neutral zone, thus making the asset class less attractive.
Exhibit 2 shows our interest rate valuation metric. Under this metric, our GBIEM weighted real interest rate differential falls to 1.57% when including China versus 1.7% without China.
Exhibit 1: GBI-EMGD Weighted Expected FX Spot Return with and without China
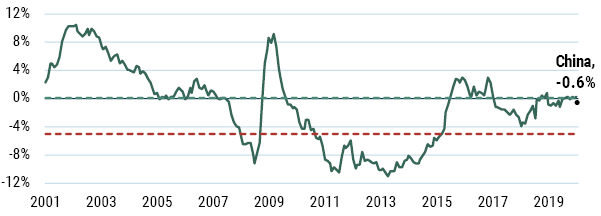
As of 1/31/20 | Source: GMO
Note: The green line represents our usual expected spot FX return without China with the last datapoint being January 31, 2020. The black dot is our new estimated GBI-EMGD weighted expected FX spot return using J.P. Morgan pro forma estimated weights with China’s full inclusion as of Nov 30, 2020.
Exhibit 2: GBI-EMGD Weighted Real Yield Excluding and Including China
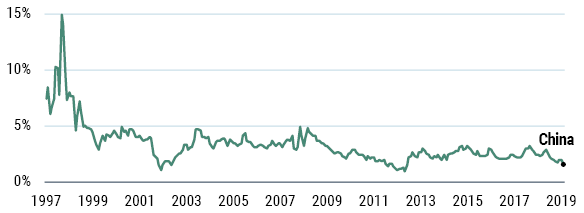
As of 1/31/20 | Source: GMO
Alpha Angles
Recall that our emerging debt strategies have alpha processes across the following dimensions: instrument selection, currency selection, interest-rate market selection, sovereign credit selection, and quasi-sovereign/corporate selection. We will take each of these in turn, describing how we will address China’s inclusion across our portfolios.
Instrument selection: Onshore China local bonds (those governed by Chinese law and custodied locally), are what are being gradually phased into the benchmark starting with 1% per month from February 28, 2020 through November 30, 2020. Table 2 details the extensive fees and taxes associated with accessing the bonds, making the achievement of headline benchmark returns extremely challenging unless these costs were to drop. Therefore, both to attempt to keep pace with the benchmark and generate alpha, we will concentrate our efforts on instrument selection, including the kinds of instruments we have employed since inception in other difficult-to-access markets. For example, we will look at a full range of offshore China sovereign and quasi-sovereign issues (in any currency including CNH/CNY). China also has a relatively liquid offshore non-deliverable interest-rate swap market (with tenors to five years), which can be used to recover the benchmark duration (with some basis to CGBs).
Table 2: China Estimated Service, Execution, and Trading Fees
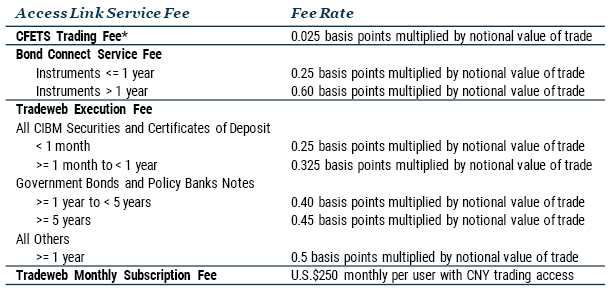
Source: Bond Connect
*0.025 basis points multiplied by the notional value of trade, capped at RMB 1,000 per transaction.
Sovereign and quasi-sovereign credit selection will follow our standard investment processes. As discussed recently by our colleague Carl Ross,2 China sovereign is a relatively opaque sovereign to assess given low transparency of fiscal measures related to sovereign credit worthiness. Furthermore, we normally rely on offshore bond disclosure documents to help assess sovereign credit risk. However, Chinese sovereign offshore bonds list only one risk factor (interest-rate risk). This is hardly the stance of a typical emerging country issuer. In the case of quasi-sovereigns (SOEs), the team is very familiar with the roughly 25 central-government issuers already in the external debt (EMBIG) benchmark, a subset of which (mainly banks) also issue in CNY/CNH either onshore or offshore. While we are leery of structural subordination issues of offshore bonds relative to onshore, we are even more leery of the inchoate relative state of disclosure and legal jurisdiction in onshore bonds, particularly as SOE “reform” comes with as-yet-unknown idiosyncratic default risks.
Currency selection has been part of the strategy since inception. Before the 2015 change in China’s FX policy, the strategy held USDCNY long as a positive-carry defensive position. More recently, while no longer positive carry, the strategy continues long USDCNY primarily for valuation reasons. We expect this active position to remain while USDCNY is near the level of 7, especially as virus-slowdown-related interest-rate cuts diminish the negative carry cost.
Interest-rate market selection is proving the most challenging, although in general this activity has the lowest weight in our overall alpha expectation already. As mentioned, China is a very large, mostly closed market, making it an unnatural candidate for our cross-market, relative-value-focused interest-rate strategy. Put simply, as of now, Chinese local bonds don’t dance to the same tune as the other markets. Table 3 shows the results of our principal component analysis (PCA) of rolling weekly changes in 5-year interest rates. As can be seen, Chinese onshore yields have some of the lowest correlations to the first component, which we identify as being changes in U.S./E.U. interest rates (accounting for about 32% of the variation in EM rates). Chinese yields also seem negatively correlated to the second component of the PCA, which accounts for about 9% of the variation in rates and which identified as being a good gauge of global risk sentiment. This contrasts with most other GBI-EMGD local rates, which are positively correlated to risk. A natural temptation would be to treat China rates as a stand-alone market and try to find factors that drive the outright direction of Chinese yields…but we would say that is even more difficult than trying to do so with USD interest rates. We had already set the evolution of our local interest-rate process as a top quantitative research priority for 2020, building on substantial groundwork during the past two years. China will simply be another market to be addressed in the process review.
Table 3: Results of PCA Analysis
(weekly rolling changes in interest rates from Jan 2011 to Feb 2020)
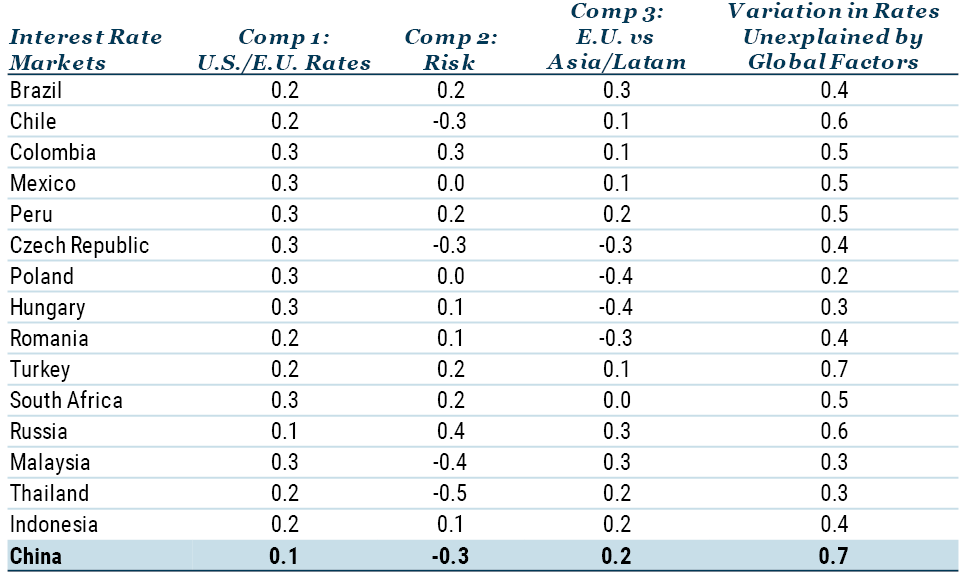
Source: GMO, Bloomberg
Conclusion
It is always exciting for us to look at new markets. While this one is challenging in terms of accessibility and even net-of-costs replicability, we are confident that we have the tools to generate alpha relative to this evolved benchmark. We believe the main thrusts of our investment process – security selection and currency selection, which together currently total 90% of the risk budget – already adequately capture China. We had already set the evolution of our local interest-rate process as a top quantitative research priority for 2020, building on substantial groundwork during the past two years, and we look forward to keeping you updated with the results of our findings.
Download article here.