Executive Summary
Investors today take for granted that the S&P 500 is an inherently superior group of stocks to those outside of the U.S. This belief stems not merely from better returns from the S&P 500 over the past 15 years, but also from superior fundamental growth for the S&P 500 relative to other stock indices. Investors consequently pay significantly higher multiples for U.S. large caps than they do for other stocks. But the superior fundamental performance of the S&P 500 is entirely due to mega-cap technology stocks. The rest of the S&P 500 has not shown particularly impressive fundamental performance but is still accorded a premium multiple. With the U.S. economy facing a unique and difficult set of negative supply shocks today, it seems unlikely that the average company in the S&P 500 will somehow start to prove exceptional from here. Even the “Magnificent Six” may struggle to justify their currently lofty valuations, although in their case, a continuation of their historical growth rates would suffice to do so. The rest of the world benefits from much lower valuations, growth on par with the U.S., a more tractable set of economic challenges, and the tailwind of a very overvalued U.S. dollar. We believe investors who are substantially overweight U.S. large cap stocks would be well advised to rethink their stance.
Introduction
Most investors believe that the U.S. economy is superior to the rest of the world and that the S&P 500 is better than all other groups of stocks. 1 The common wisdom is that if you invest in U.S. equities “for the long term,” you’ll compound capital at somewhere between 9% and 12%. Going outside the U.S., by contrast, is generally seen as needlessly risky: returns in the rest of the world have been somewhere between awful (China) and uninspiring (Europe) since the GFC, and it is a fact that no economy today can boast of the resilience we have seen in post-pandemic America.
The reason people are bulled up on the U.S. stock market is therefore quite straightforward: the U.S. has had a rip-roaring economy, and domestic equities have massively outperformed every other broad stock or bond index for over a decade. The S&P 500, for instance, has outpaced the rest of developed market equities 2 by a cumulative 150% in the past fifteen years. To state the obvious: that’s a lot. And those of us (and we really do mean us) who have been systematically underweight the U.S. for those fifteen years should readily admit ex-post that this was a mistake.
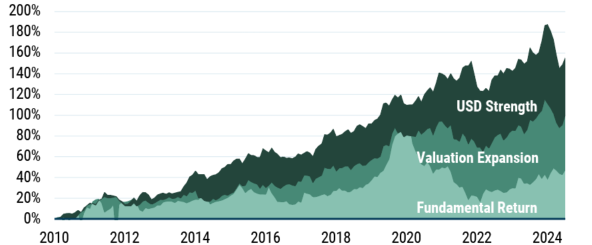
But simply flipping one’s decision because of a past mistake is a treacherous way to make decisions; investments made on the back of regret turn out poorly more often than not. To understand whether the past outperformance of the S&P 500 is likely to continue, we should understand the sources of that outperformance. If American companies delivered amazing revenue and earnings growth, and there are signs that they can continue doing this, we should want to own them. If they rallied because of overoptimism and complacency, we probably shouldn’t. In the spirit of understanding what happened in these 15 years of U.S. stock market exceptionalism, we therefore decompose the relative returns of the S&P 500 vs. MSCI World ex-USA into three components:
- The dollar’s rally,
- Relative valuation expansion, which picked up steam in 2015, and
- Fundamental outperformance (i.e., dividends, buybacks, and fundamental growth).
It bears mentioning that our measure of fundamental value in this piece is gross profit, or revenues minus the cost of goods sold. There are two reasons for this. The first is that gross profit is a pretty good proxy of the value added by a company (the business equivalent of GDP, if you will). A company whose gross profit is increasing has more money to fund operations, to expand R&D, and to pay distributions to shareholders. Net profit (also known as earnings) is a more common measure investors cite, but it has the cost of being a highly cyclical measure, and one that is more easily distorted by accounting rules. We have added an appendix with some of the main results shown on the Institutional Brokers' Estimate System’s (IBES) forward EPS estimates for those who are worried that the conversion of gross profit to earnings might have changed over time as the composition of indices – especially the S&P 500 – shifted (thus making the gross profit story less relevant). To be clear: the results are all qualitatively the same on both metrics. The story with gross profit is simply a lot cleaner, and the charts look nicer. So...
EXHIBIT 1: S&P 500 VS. MSCI WORLD EX-USA
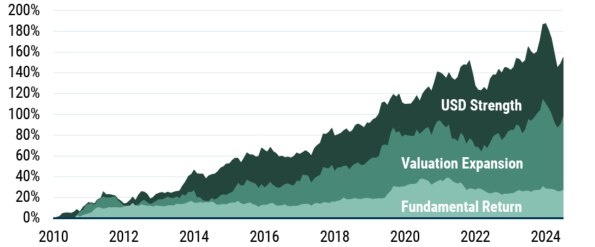
As of 6/30/2025 | Source: Compustat, Worldscope, MSCI, S&P Global, Bloomberg, GMO
Exhibit 1 does not deliver a ringing endorsement of U.S. equities. About 80% of their outperformance came from sources of return that are unlikely to repeat: the dollar strengthening against almost every currency in the world and relative valuations expanding. 3 For one, the dollar is already very expensive, and the U.S. administration is pushing for trade and monetary policies that actively make it less attractive for foreigners to hold dollar assets. Secondly, U.S. valuations are already quite high – somewhere between the 90th percentile on simple ratios like P/E and closer to their all-time records when contrasted with the opportunity cost of investing in other assets (like Treasuries). Valuations could become more stretched, of course, but it pays to remember that higher valuations always beggar future returns. 4
U.S. stocks did deliver on fundamental returns, though. That is, their non-valuation sources of returns – dividends, share repurchases, and organic growth – outdid the non-valuation sources of returns in the rest of developed markets. Given that U.S. companies are more expensive than their DM peers, this mostly implies that U.S. businesses outgrew their international competitors. 5 And this is probably why so many investors are happy to have most of their money in U.S. equities. They expect the fundamental outperformance (and particularly the fundamental growth) of the past to repeat; they think the companies of the future are [listed] American businesses.
On the face of it, this seems plausible: the U.S. has a lower regulatory burden, weaker anti-trust policies, and many of the world’s best and brightest. It has the leading companies in AI, cloud, media, and advertising. It has deep capital markets with unparalleled access to foreign and domestic capital. What the U.S. has been surprisingly modest on, despite all this, is growth.
American Unexceptionalism
We understand if, at this point, you are angrily pointing at the positive fundamental return contribution we discussed in Exhibit 1. Yes – over the past fifteen years, the S&P 500 has seen more growth than the rest of the MSCI World. There are two caveats, though:
- Most of that fundamental outperformance happened before 2015, and
- Most of that fundamental outperformance was provided by a few giant companies.
If we start the clock in December 2014 instead of December 2010, the U.S. fundamentally outperformed the rest of the developed markets by a smidge: an aggregate 3.8%. 6 Fast-forward to December 2019, and the fundamental outperformance since then is nil. 7 Any additional growth that U.S. companies were able to muster was simply not impressive enough to out-return their international peers.
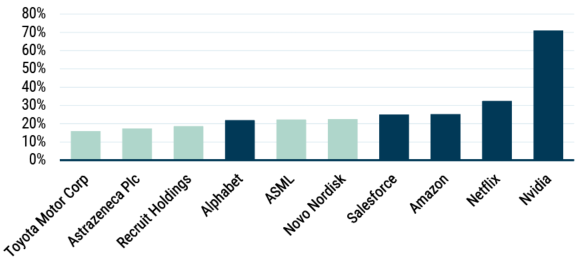
To be completely transparent, we were surprised by these numbers. We know that since 2019 some of the largest companies in the S&P 500 have been able to deliver extraordinary fundamental growth. The Magnificent Six, 8 which were all among the top 50 names by market cap in the S&P 500 five years ago, delivered amazing gross and net profit growth in the intervening years, and contributed a lot of return to investors in the index. Exhibit 2 shows their annualized fundamental returns, which – when contrasted with the historical average for equities everywhere (~6% real) – make clear why they are dubbed magnificent.
EXHIBIT 2: THE MAGNIFICENT SIX
Annualized Fundamental Return (2019-2024)
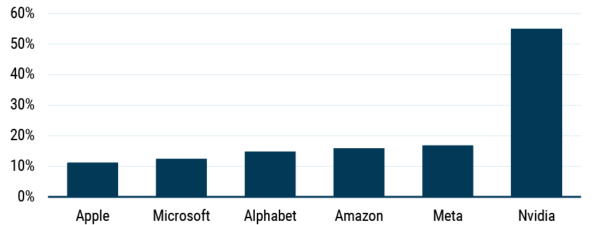
As of 12/31/2024 | Source: Compustat, Worldscope, MSCI, S&P Global, Bloomberg, GMO
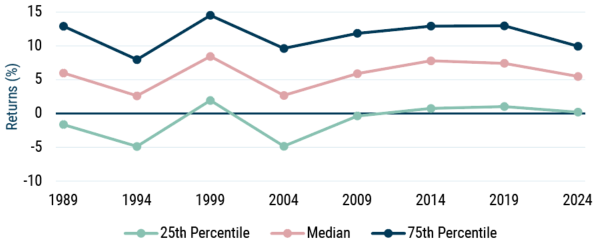
If the S&P 500’s fundamental return since 2019 wasn’t great, and some of the largest names in the index had great returns, the corollary is straightforward: most companies in the S&P 500 did not manage to deliver. To make this evident, Exhibit 3 shows the distribution of fundamental returns among the S&P 500 over non-overlapping five-year periods, starting in 1984. 9
EXHIBIT 3: S&P 500 FUNDAMENTAL RETURNS
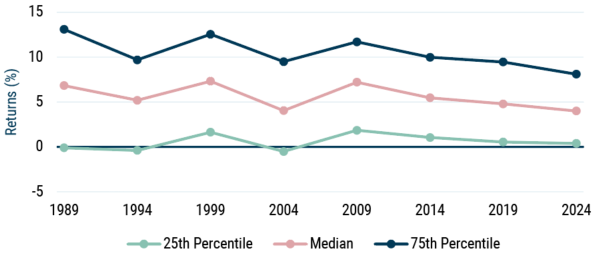
As of 12/31/2024 | Source: Compustat, Worldscope, MSCI, S&P Global, Bloomberg, GMO
The median fundamental return for a stock in the S&P 500 (ex-financials) 10 over the five years ending in December 2024 was an annualized 4.0%, 11 which is lower than it is for any other five-year increment since the mid-80s, 12 including the mediocre cycles ending in 1994 (5.2%) and 2004 (4.1%). A full 60% of the companies in the S&P 500 were unable to reach the “old norm” fundamental return of 6% real. The best that can be said of the recent period is that the companies that did the worst over the last five years did somewhat less badly than usual for underperformers.
Investors today do not seem to recognize that the fundamental growth of the vast majority of American companies over the last five to ten years has been mediocre. The magnificence of the success of the very largest companies in the U.S. stock market has led to an assumption that U.S. companies on average have done well, when in fact they have not. And even if the huge size of the Magnificent Six companies means that they comprise about 32% of every dollar invested in the S&P 500, that still means that 68% is in a group of companies that have, in aggregate, been unimpressive and yet trade at a large premium to stocks in the rest of the world. For those companies to justify their valuations, they are going to need to deliver substantially better returns over the coming years than they have in the trailing ones.
Given the size of the U.S. market in global benchmarks and most portfolios, investors have a huge amount riding on their ability to improve their aggregate growth. But is that plausible? From a macroeconomic perspective, it certainly does not seem so.
Supply-Side Economics
Let’s start with the Magnificent Six. At 30 times forward aggregate earnings, they are trading at a valuation that is attractive if they can achieve the kind of growth they have achieved over the last decade, but would lead to deeply disappointing returns should their growth fall back to Earth. While those who have bet against these companies in the past have generally lived to regret it, one difference between today and the past is that these famously “capital light” businesses are making capital expenditures at rates vastly higher than they ever have. It is possible that the hoped-for AI riches will come and therefore justify that massive investment. But if part of the magic of these companies in the past was their ability to grow without the massive investments that other giants of the past required, they will need to acquire a new form of magic moving forward.
When it comes to the rest of the S&P 500, investors are hoping for better than historical results, and there, the path looks particularly difficult to pull off. The U.S. and U.S.-based companies are facing three simultaneous negative supply shocks, and while there are some potential positives on the other side, it seems very likely that U.S. economic growth will be slower and that monetary policy is unlikely to be able to come to the rescue. Those shocks are: 13
- The imposition of large tariffs on most imports. While this will be positive for a handful of U.S. companies, such as domestic steel and aluminum producers, for almost all others, it will raise costs, reduce the global competitiveness of goods produced in the U.S., and raise the general price level.
- A negative labor supply shock as immigration falls, deportations rise, and immigrant labor participation falls for fear of deportation.
- Greater policy uncertainty makes long-term corporate investment decisions more difficult and will likely lower returns.
Not all is negative for U.S. companies, however. There are two countervailing forces that push the other way. While their aggregate impact looks smaller to us than the negatives, they will help cushion the blow a bit, particularly for oligopolistic multinationals like the Magnificent Six. Those positives are:
- A weaker dollar. While the U.S. dollar still looks significantly overvalued on a purchasing power parity basis, it has weakened significantly this year.
- Domestic R&D expensing. The recent tax bill 14 reinstated immediate expensing for research and development performed in the U.S. Domestic R&D had been subject to five-year amortization as of 2022, and this change effectively reduces corporate tax rates for companies with heavy R&D spend.
Let’s dive into why this combination is very likely to be a net negative for U.S.-based companies going forward.
First, the tariffs. Tariffs are a tax, which is paid by companies importing products in the U.S. This tax increases the price level both directly, by increasing the cost of goods with imported content, and indirectly, by increasing the price of domestically produced goods that compete with imports. Whether a manufacturer uses domestically produced steel or imported steel makes little difference to the price they pay. As soon as tariffs on imported steel were imposed, the price of steel in the U.S. increased to levels far above those in the rest of the world. Goods prices will generally increase except where corporations choose to absorb the costs themselves at a hit to their profits. And where corporations defend their profit margins by fully passing through the increased costs, they will get hit on volumes.
From an overall macroeconomic perspective, the tariffs are a new source of revenue for the government. That revenue will be basically entirely countered by the provisions of the “One Big Beautiful Bill Act” (OBBA), which otherwise reduces government revenue significantly. While the aggregate effect is essentially a wash, 15 tariffs are a regressive tax since the poor spend a greater proportion of their income on goods, and the OBBA is also regressive as the tax cuts accrue largely to the rich and the spending cuts disproportionately hit the poor. Whatever one thinks about the fairness of this, it is almost certainly a net drag on domestic demand because poorer households spend a larger portion of their income than the rich do.
Second, labor supply. Part of the reason that the U.S. grew so quickly in the post-pandemic years was that its working-age population increased dramatically. There were lots of jobs that needed workers, lots of people became said workers, and as a result, more houses got built, more wheat got sown, and more law got lawyered. Some of this workforce growth came from people who already lived in the U.S. but hadn’t previously wanted a job; most of it came from immigration. This immigration was probably critical to the “immaculate disinflation” that the U.S. economy achieved since 2022, with wages and therefore costs decelerating despite continued decent job growth.
As we know, immigration is falling. The foreign-born workforce has dropped by over 1.9 million since the inauguration. 16 The new administration’s desire to curb immigration has led many would-be immigrants, and some former immigrants as well, to give up on working in the United States, leading to a direct slowdown in low-skilled labor supply growth. This has increased the likelihood of labor shortages in areas that typically employ undocumented migrants (e.g., agriculture, construction) – which we already see reports of in the Fed’s beige book – while creating some slack in the demand for goods and services typically consumed by lower-income individuals. On net, the migration crackdown has probably helped keep the unemployment rate lower than it would have otherwise been by pushing down labor supply at a time when labor demand is waning. That might be helpful for that statistic, but it is still net negative for economic growth. Given that immigration policies are unlikely to change in the near future, we should expect lower economic growth – and lower revenue growth as a result – for companies that operate mostly in the U.S.
Third, uncertainty. Tariffs and immigration changes are an outcome of the Trump administration’s stated policy goals. Policy uncertainty is, on the other hand, an outcome of the administration’s management style. The on-again, off-again, on-again cadence of tariffs, government job cuts, and other policy shifts may be par for the course for Trump, but they are a stark change from normal government actions and make decision-making very difficult for corporations contemplating investments with multi-year timelines. Shifts in government policies risk turning expensive investments into stranded assets and discouraging corporate investment, just as greater uncertainty about the future employment situation leads to lower spending by households. Even if that policy uncertainty were to suddenly vanish for the remainder of Trump’s presidency, 17 the changes this administration has put in place are sufficiently massive that even three years of certainty is of limited benefit. Manufacturing facilities generally take two to six years to complete and then operate for over a decade. Certainty about current government policy would mean a company can be certain that costs to build will be higher (due to higher metal prices and a labor-constrained construction sector), but said company has no certainty that the completed factory will benefit from reduced competition due to import tariffs being maintained into the 2030s and beyond. For a company contemplating an alumina or copper mine with its 10- to 15-year lead times and 40+ year expected life, even a CEO who was confident that tariffs would last the next several presidential terms would have to think twice about OK’ing the initiation of that mining project.
Put these three shocks together, and the offsets are likely to prove insufficient. A weakening dollar is disproportionately helpful for goods exporters with a local manufacturing base – not the description for most companies in the S&P 500. It is also helpful in making dollar profits go up on the back of euro or yen-denominated revenues, but that is not much comfort for an investor who could simply hold euro- or yen-denominated equities instead. 18 The tax provision that reinstates R&D expensing is a genuinely helpful tax cut for companies that spend on software development or pharmaceutical research, and its cousin clause for accelerated depreciation on certain capital expenditures is also a boon. But it seems likely to be dwarfed by the costs that have and will come – both directly and indirectly – from a regulatory environment that might charitably be described as “fluid.”
There Is an Alternative
Forgive us for emphasizing one last time: the U.S. faces a self-inflicted triad of supply shocks. The responses that fix supply shocks, unfortunately, are almost always complicated and structural, with stimulative macroeconomic policy largely an irrelevance. Consider an economy that doesn’t have enough workers and where companies are hesitant to invest because of regulatory uncertainty. Now imagine the government sends everyone a check and lowers interest rates. The result is that the same number of people are available to produce the same number of things while wanting to spend a greater amount of money. 19 All that this would lead to is inflation, and inflation is not good for asset prices. 20
International economies, we all know, are not immune to the vicissitudes of U.S. policy. But the problem these economies currently face is one of less demand for their goods. All else equal – absent any countercyclical policy – this would cause job losses and investment write-downs, potentially bringing about a full-on recession. But demand problems are a somewhat solved problem. Spend money! Lower interest rates! People will want more things, the spare labor capacity will be absorbed, some investment will be salvaged, and the economy is much more likely to get back on track. 21
Now, we are keenly aware that even if foreign equities’ prospects aren’t threatened by this most recent demand shock, investing in them has had little of the splendor of the early aughts. In part, this is because by the time the GFC rolled around, international currencies were very expensive relative to the dollar (Exhibit 4), and the dollar’s performance has been a sustained headwind in the past 15 years. The consequence is that the U.S. dollar is close to its most overvalued level in the last half-century. Considering the policies the administration is pursuing, our best guess is that the direction of travel for the dollar is continued depreciation, and that currency gains will be a tailwind for investors in foreign equities as a result.
EXHIBIT 4: U.S. DOLLAR REAL EFFECTIVE EXCHANGE RATE
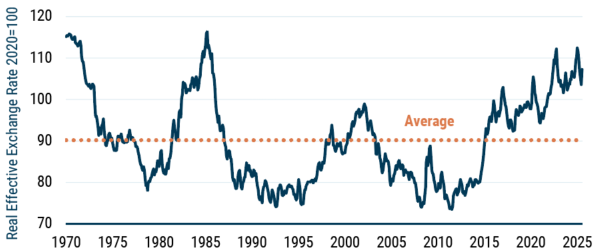
Data from 1970–2025 | Source: BIS, GMO
Bank of International Settlements Narrow Real Effective Exchange Rate
The main concern investors have with international equities, it bears mentioning, is their disappointing fundamental growth. Countries as varied as Germany, South Korea, Brazil, and South Africa all delivered subpar growth in the last 15 years. A good deal of the post-GFC fundamental underperformance of equity markets came from global growth slowing a decent amount from 1995-2010 to 2010-2025. This slowdown, combined with some country-specific blows (debt overhang in Europe, the UK’s decision to supply-shock itself, commodity producers overinvesting, etc.), caused many businesses to grow at a slower pace than anticipated. But old problems, even those which seem intractable, don’t last forever. Japan is a prime example. After spending the 1980s overinvesting on the back of a massive asset bubble, the country needed two full decades to work through its stock market malaise. While the country has returned to investors’ attention in the post-pandemic period, the reality is that its fundamental performance has been strong since 2012 (Exhibit 5).
EXHIBIT 5: FUNDAMENTAL RETURNS – 2012-2015
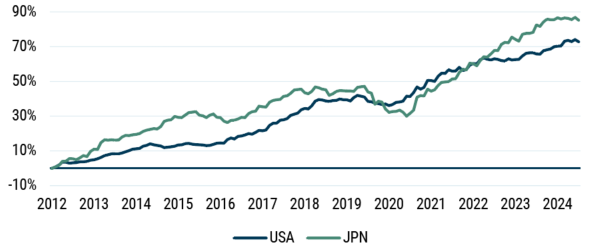
As of 6/30/2025 | Source: Compustat, Worldscope, MSCI, S&P Global, Bloomberg, GMO
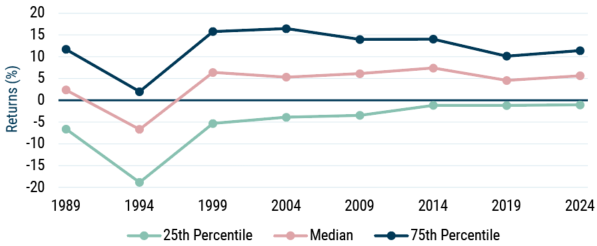
We are sanguine that, much like with Japan, international equities will return to a path of normal growth. There are certainly equity markets that still look problematic – China is a case in point 22 – but most economies learn from and adapt to prior mistakes (if slowly). Exhibit 6 shows the distribution of fundamental returns for the companies in MSCI World ex-USA. The period ending in 2019 was an absolute terror for international stocks, but over the past five years, they have been showing clear signs of recovery. In fact, their median fundamental return was 6.1% in the five years ending 2024 – handsomely exceeding the median fundamental return of the S&P 500.
EXHIBIT 6: MSCI WORLD EX-USA – FUNDAMENTAL RETURNS
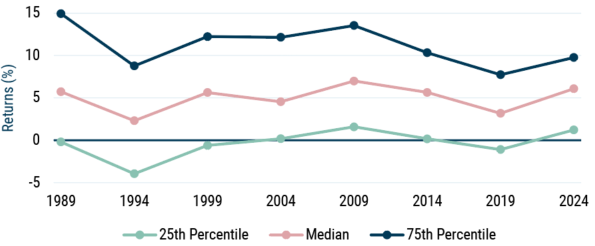
As of 12/31/2024 | Source: Compustat, Worldscope, MSCI, S&P Global, Bloomberg, GMO
It isn’t true, moreover, that stocks outside of the U.S. can’t deliver outsized fundamental gains. If we take the top five fundamental returns among the largest companies in both the S&P 500 and other developed markets, 23 we find that, beyond Nvidia (which has done something absolutely unprecedented for what was already a giant company), fundamental returns are actually on par for the top performers in both regions. It is truly impressive that U.S. businesses that were already immense to begin with, like Meta and Amazon, were able to continue to compound growth at the blistering pace that they did; by themselves, these companies have managed to make the S&P 500’s fundamental return look passable. But you shouldn’t ignore that you could have found a similar level of fundamental return among some very big companies in the rest of the developed markets. 24
EXHIBIT 7: MSCI WORLD MEGA-CAP ANNUALIZED FUNDAMENTAL RETURNS (2019-2024)
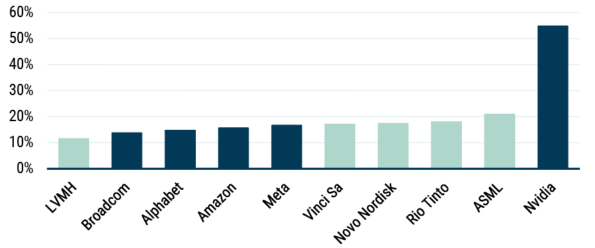
As of 12/31/2024 | Source: Compustat, Worldscope, MSCI, S&P Global, Bloomberg, GMO
That said, the main attraction of international stocks is not that they are growing at a competitive clip to their U.S. counterparts; it’s their valuations. Normal growth is certainly a welcome development: it means that, absent any valuation change, we should expect prices to drift upward. But even absent growth, low valuations allow firms to pay their investors a healthy yield through dividends and buybacks. These might be boring sources of return – prices shooting up are certainly more exciting – but we are not here to give our investors joyrides; we are here to make them money. Exhibit 8 shows the lovely relative discount of international stocks versus their competitors in the S&P 500. The UK, Europe, Japan, and the rest of developed markets all trade at a 33% to 55% discount to American stocks. 25
EXHIBIT 8: PRICE/GROSS PROFIT (BY REGION)
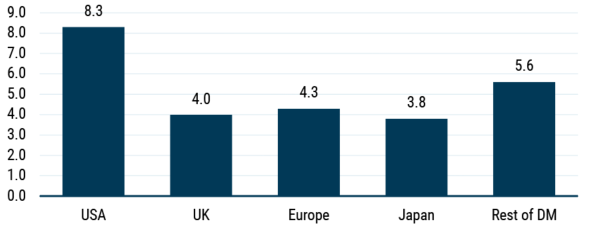
As of 6/30/2025 | Source: Compustat, Worldscope, MSCI, S&P Global, Bloomberg, GMO
We have made the point that on past growth alone – and on macroeconomic prospects – this valuation differential doesn’t make much sense. You don’t have to take our word for it, though.
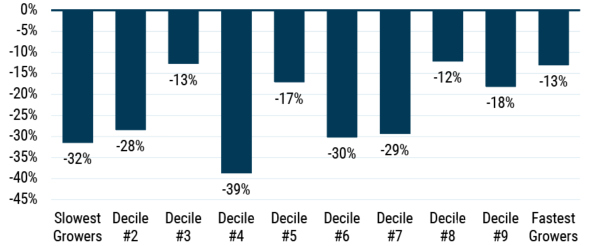
If we split MSCI World stocks (ex-financials) into 10 bins sorted on expected two-year EPS growth rates – where the two-year expectations come from sell-side analysts’ forecasts – we can select stocks in the U.S. and stocks outside the U.S. that have almost the same expected growth. 26 We can then contrast their valuations while making sure that valuation differences aren’t arising from expected growth mismatches. The results – whether you look at price to gross profit or price to forward earnings as your valuation anchor (see appendix) – are jarring. Exhibit 9 shows that for basically the same level of growth, international stocks trade at a 15% to 50% discount to their U.S. counterparts. That, frankly, is very hard to justify.
EXHIBIT 9: PRICE TO GROSS PROFIT DISCOUNT
MSCI World Ex-USA vs. USA
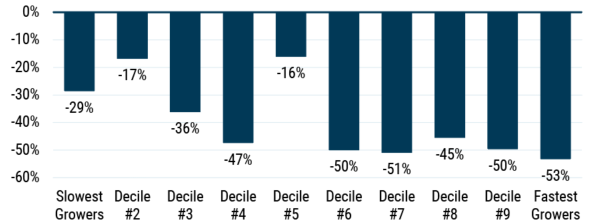
As of 6/30/2025 | Source: Compustat, Worldscope, MSCI, S&P Global, Bloomberg, IBES/LSEG, GMO
With international stocks “on sale" on a relative basis, currencies undervalued against a U.S. dollar that is actively and continually harangued, and growth differentials not looking like they particularly favor the U.S. on backward- or forward-looking metrics, there is an opportunity today in the rest of the world to outperform U.S. equities. Regional diversification – for all its inherent theoretical appeal – might not have been a mantra that worked for the past 15 years. But regional diversification remains a good idea. And today you are getting paid (for no particularly obvious reason) to do it.
Conclusion
There is no disputing the amazing fundamental performance of the Magnificent Six stocks in the U.S. They have delivered exceptional fundamental returns, which have been particularly helpful for U.S. investors, given their size. They all have massively valuable franchises; they offer products and services that people and companies find extremely useful (or that they at least can’t seem to live without), and the scale to not only navigate complex regulatory regimes, but at times, to choose to ignore them and shrug off the fines that result. But it is worth recognizing that, while those who have suggested their growth was waning have been wrong so far, no company remains a growth company forever. And the Magnificent Six are certainly priced for continued strong growth.
The rest of the S&P 500, by contrast, shares much less in common with the Magnificent Six than most investors seem to think (beyond a lofty valuation premium to the rest of the world). Its aggregate growth has not been particularly impressive, either by historical standards or against global peers. And the economic headwinds facing U.S.-based companies today are almost certainly harder to handle than those of most other countries. 27 The leap of faith that investors are implicitly making in an acceleration of the aggregate growth of these companies is perhaps touching, but extremely hard to justify. Non-U.S. stocks today offer strikingly better valuations, much cheaper home currencies, and a less troubling economic backdrop. Indeed, we believe they are well worth a larger share of investor portfolios than they currently command.
APPENDIX:
Results on Forward-Looking Earnings
As we mentioned in the introduction, earnings estimates are a popular measure on which to assess fundamental growth, with price to forward earnings probably the most cited valuation metric by market participants. Because earnings are generally quite cyclical (they expand a lot during industry cycle peaks and crash during industry cycle troughs), start-and-end points tend to matter a lot more for any kind of analysis than with top-line measures, and the choice of how to “smooth” earnings to ameliorate cyclicality often has an outsized impact on results.
That said, one legitimate concern with gross profit (or other top-line measures) is that over the last 10 years, we have seen a meaningful shift in the composition of the S&P 500. It has moved toward companies that are better at converting gross profit to earnings – a trend not observed in the rest of the world. This means that results that show gross profit growth has been middling might be understating the U.S. equity market’s superiority in earnings growth, which is precisely what ultimately funds shareholder returns. Exhibit A1, which replicates our decomposition of returns since 2010 using IBES forward earnings 28 instead of gross profit, shows that this has not been the case (though in the middle of the pandemic, forward earnings might have had you fooled).
EXHIBIT A-1: S&P 500 VS. MSCI WORLD EX-USA
As of 6/30/2025 | Source: Compustat, Worldscope, MSCI, S&P Global, Bloomberg, IBES/LSEG, GMO
The recent fundamental performance of the S&P 500 vs. MSCI World ex-USA measured on forward earnings has – much like with gross profit – been close to flat. This is not because of the Magnificent Six (whose incredible earnings growth we are all familiar with, so we find no need to replicate Exhibit 2). It is instead because – much like with gross profit (albeit to a smaller extent) – the median company in the S&P 500 has delivered slightly lower fundamental returns in the 2019-2024 period than the median company in MSCI World Ex-USA (Exhibit A3, Exhibit A6).
EXHIBIT A-3: S&P 500 FUNDAMENTAL RETURNS
As of 12/31/2024 | Source: Compustat, Worldscope, MSCI, S&P Global, Bloomberg, IBES/LSEG, GMO
EXHIBIT A-6: MSCI WORLD EX-USA – FUNDAMENTAL RETURNS
As of 12/31/2024 | Source: Compustat, Worldscope, MSCI, S&P Global, Bloomberg, IBES/LSEG, GMO
It also remains true on forward earnings that some mega-cap international companies have been able to deliver fundamental returns in line with the best of the giants of the S&P 500. The winners on forward EPS are somewhat different for the U.S. and MSCI World ex-USA, but international stocks are still clearly able to hold their own.
EXHIBIT A-7: MSCI WORLD MEGA-CAP ANNUALIZED FUNDAMENTAL RETURNS (2019-2024)
As of 12/31/2024 | Source: Compustat, Worldscope, MSCI, S&P Global, Bloomberg, IBES/LSEG, GMO
Finally: valuations. We can once more look at MSCI World and split the companies within it into 10 groups, sorted on expected two-year EPS growth. Within each expected growth decile – from slowest expected growers (or de-growers) to fastest growers – we can separate U.S. and non-U.S. companies, calculate their valuations, and compare them. This is what we do in Exhibit A9. The result, once more, is 10% to 40% discounts (lower than what we saw on gross profit, but still significant) for international stocks conditional on having the same expected growth as their U.S. comparators. U.S. stocks are trading at a premium not because of how quickly they’re expected to grow, but because of their domicile.
EXHIBIT A-9: Price to Forward Earnings Discount
MSCI World Ex-USA vs. USA
As of 6/30/2025 | Source: Compustat, Worldscope, MSCI, S&P Global, Bloomberg, IBES/LSEG, GMO
With the possible exception of the Nasdaq 100.
MSCI World ex-USA Index
Price/gross profit. The breakdown is quite similar if we were to use price/forward earnings (35% instead of 45%), if a little more favorable to the U.S. See the appendix.
If you don’t believe us, there is some stuff we’d love to sell you.
They could have out-dividended and share-repurchased them, but that’s where high valuations make it hard to outperform. If you trade at a P/E of 10x and pay all your earnings to investors, they make 10% on dividends. If you trade at a P/E of 25x, they make 4% instead.
If we were to use forward earnings, which we tend to look at with a little more care given its cyclicality and bias, the U.S. would have fundamentally outperformed by a more respectable, if volatile, 12%.
If we were to use forward earnings (again – really cyclical) fundamental performance would also be flat.
Tesla doesn’t make the cut on Magnificence, and it also wasn’t in the S&P 500 at the end of 2019.
We smooth gross profit over time to avoid the residual cyclicality that we would see during, for instance, the GFC. This helps discount temporarily depressed numbers and reduce base effects in our sample.
We exclude financials because their fundamentals tend to be the least stable of the bunch and, in the case of gross profit, are harder to interpret than for most other businesses. The results with financials are qualitatively the same as the results without them.
The mean was even worse, at 3.6% annualized.
We start in the 1980s because that is when gross profit and forward earnings data became widely reported. It should be said that results on forward earnings (see appendix) show a slowdown in fundamental returns, but one that is less extreme, especially compared to the early years.
In the longer run, the drop-off in government funding for scientific research might well be the most consequential negative shock to the U.S. economy. But given the generally long lead times between fundamental scientific research and the products and services that result, the other shocks will hit the economy substantially sooner.
The OBBA was quite good at undoing provisions from the TCJA. Section 163(j) – which previously limited interest expense deductions to 30% of EBIT (a topic we touched on in 2023’s Beyond the Landing) – has reverted to capping interest expense deductions at 30% of EBITDA. This change is helpful for leveraged U.S. corporations; the LBO crowd is certain to be celebrating
At least relative to current policy, it is a wash, sort of…for now. Against the prior law, it is an increase because temporary tax cuts that were due to expire were made permanent. It would be easier to sympathize with the claim that extending current policy is a better baseline for scoring tax bills if Congress weren’t simultaneously claiming that the cost of this bill will be lower because they assume the temporary tax cuts in this bill will actually expire when the law says they will.
Bureau of Labor Statistics August Employment Situation Summary.
We are prepared to bet against this should anyone wish to take the other side. For anyone interested and knowledgeable about how to structure prediction markets, perhaps we can get this up on Kalshi and get favorable tax treatment for it.
The investor may prefer to own the U.S. equities, but outside exporters, anticipated FX depreciation is unlikely to be a good reason to do that.
Stimulating demand when you have supply-side problems is sadly a well-trod path. Many emerging market economies with different supply problems have attempted this over the past thirty years, and they have all succeeded in remaining emerging market economies.
Beyond increasing discount rates, inflation also increases nominal capital gains. This means most people get to pay taxes on paper gains, which did nothing except keep their purchasing power unchanged. Inflation is, quite literally, a tax.
The key reason the money makes a difference when there is a demand shortfall is that there is spare capacity available to produce the new things being demanded.
See Bargain, Value Trap, or Something In Between? (Ben Inker and Anna Chetoukhina 2024).
The top 50 in the S&P 500 and the top 50 in MSCI World ex-USA.
Or emerging markets, for that matter. Consider TSMC.
Emerging markets (ex-financials) trade at a 35% discount to the S&P 500 (ex-financials).
To be clear, the bins are defined on the same growth expectation bounds for U.S. and non-U.S. corporations. If you are in decile 10, for instance, you must be in the top 10% of growth expectations among all stocks in MSCI World.
Barring a complete about-face from the U.S. government on its signature policy goals, which is theoretically fairly easy, if unlikely, any time soon. And even if the about-face were to miraculously occur, it could arguably worsen the degree of policy uncertainty, assuming the policies in question were reversed by the same folks who instituted them in the first place.
We floor forward earnings at zero to alleviate cyclicality somewhat.
Disclaimer: The views expressed are the views of Ben Inker and John Pease through the period ending August 2025 and are subject to change at any time based on market and other conditions. This is not an offer or solicitation for the purchase or sale of any security and should not be construed as such. References to specific securities and issuers are for illustrative purposes only and are not intended to be, and should not be interpreted as, recommendations to purchase or sell such securities.
With the possible exception of the Nasdaq 100.
MSCI World ex-USA Index
Price/gross profit. The breakdown is quite similar if we were to use price/forward earnings (35% instead of 45%), if a little more favorable to the U.S. See the appendix.
If you don’t believe us, there is some stuff we’d love to sell you.
They could have out-dividended and share-repurchased them, but that’s where high valuations make it hard to outperform. If you trade at a P/E of 10x and pay all your earnings to investors, they make 10% on dividends. If you trade at a P/E of 25x, they make 4% instead.
If we were to use forward earnings, which we tend to look at with a little more care given its cyclicality and bias, the U.S. would have fundamentally outperformed by a more respectable, if volatile, 12%.
If we were to use forward earnings (again – really cyclical) fundamental performance would also be flat.
Tesla doesn’t make the cut on Magnificence, and it also wasn’t in the S&P 500 at the end of 2019.
We smooth gross profit over time to avoid the residual cyclicality that we would see during, for instance, the GFC. This helps discount temporarily depressed numbers and reduce base effects in our sample.
We exclude financials because their fundamentals tend to be the least stable of the bunch and, in the case of gross profit, are harder to interpret than for most other businesses. The results with financials are qualitatively the same as the results without them.
The mean was even worse, at 3.6% annualized.
We start in the 1980s because that is when gross profit and forward earnings data became widely reported. It should be said that results on forward earnings (see appendix) show a slowdown in fundamental returns, but one that is less extreme, especially compared to the early years.
In the longer run, the drop-off in government funding for scientific research might well be the most consequential negative shock to the U.S. economy. But given the generally long lead times between fundamental scientific research and the products and services that result, the other shocks will hit the economy substantially sooner.
The OBBA was quite good at undoing provisions from the TCJA. Section 163(j) – which previously limited interest expense deductions to 30% of EBIT (a topic we touched on in 2023’s Beyond the Landing) – has reverted to capping interest expense deductions at 30% of EBITDA. This change is helpful for leveraged U.S. corporations; the LBO crowd is certain to be celebrating
At least relative to current policy, it is a wash, sort of…for now. Against the prior law, it is an increase because temporary tax cuts that were due to expire were made permanent. It would be easier to sympathize with the claim that extending current policy is a better baseline for scoring tax bills if Congress weren’t simultaneously claiming that the cost of this bill will be lower because they assume the temporary tax cuts in this bill will actually expire when the law says they will.
Bureau of Labor Statistics August Employment Situation Summary.
We are prepared to bet against this should anyone wish to take the other side. For anyone interested and knowledgeable about how to structure prediction markets, perhaps we can get this up on Kalshi and get favorable tax treatment for it.
The investor may prefer to own the U.S. equities, but outside exporters, anticipated FX depreciation is unlikely to be a good reason to do that.
Stimulating demand when you have supply-side problems is sadly a well-trod path. Many emerging market economies with different supply problems have attempted this over the past thirty years, and they have all succeeded in remaining emerging market economies.
Beyond increasing discount rates, inflation also increases nominal capital gains. This means most people get to pay taxes on paper gains, which did nothing except keep their purchasing power unchanged. Inflation is, quite literally, a tax.
The key reason the money makes a difference when there is a demand shortfall is that there is spare capacity available to produce the new things being demanded.
See Bargain, Value Trap, or Something In Between? (Ben Inker and Anna Chetoukhina 2024).
The top 50 in the S&P 500 and the top 50 in MSCI World ex-USA.
Or emerging markets, for that matter. Consider TSMC.
Emerging markets (ex-financials) trade at a 35% discount to the S&P 500 (ex-financials).
To be clear, the bins are defined on the same growth expectation bounds for U.S. and non-U.S. corporations. If you are in decile 10, for instance, you must be in the top 10% of growth expectations among all stocks in MSCI World.
Barring a complete about-face from the U.S. government on its signature policy goals, which is theoretically fairly easy, if unlikely, any time soon. And even if the about-face were to miraculously occur, it could arguably worsen the degree of policy uncertainty, assuming the policies in question were reversed by the same folks who instituted them in the first place.
We floor forward earnings at zero to alleviate cyclicality somewhat.